

Earlier this year, we explained why residents of the PJM area, America’s largest electricity market, have seen their power bills rise by ~20%. We argued that the main culprit was PJM’s auction design choices and how PJM models demand and supply. To better understand the extent of the problem, our Energy Model team spent the last 6 months reverse-engineering PJM’s main system model, the ‘Reserve Requirement Study’, which to date has been a black box. This study is how PJM decides what type of and how many power plants to buy to make sure electricity is reliable, using an annual auction, and spending billions each year.
Armed with a reconstructed model we argue that the problem is worse than we thought. PJM’s model includes errors that we estimate have cost all of its 66 million residents a total of $12B between 2025 and 2027 alone. We share our method in the annex of this newsletter for our subscribers; as well as the results of the model in our PJM Model dashboard. Our live rebuild of the Reserve Requirement Model is a tab available exclusively to our Energy Model clients; which also includes a quarter-by-quarter forecast of the whole US grid tracking >40,000 grid-connected power plants, and every single behind-the-meter datacenter power order.
PJM’s model is structurally anti-growth with a poorly designed capacity market that is globally unique and a governance system that is too big to function.
These failings magnify the negative impact of bad system modeling, which is the focus of this report:
PJM underestimates by ~4 gigawatts the existing power plants it already has; owing to a methodology which doesn’t account for the higher efficiency of power plants in winter and improved power plant resilience since Storm Elliott.
PJM has wasted ~$12 billion of ratepayers’ money from 2025 to 2027 due to this weak methodology, which dramatically overstated the supply/demand shortfall it faced. Household electricity bills would have risen much less if PJM’s model was accurate.
PJM’s emergency auction is putting ratepayers at risk by signing contracts for too much power without committed counter-parties.
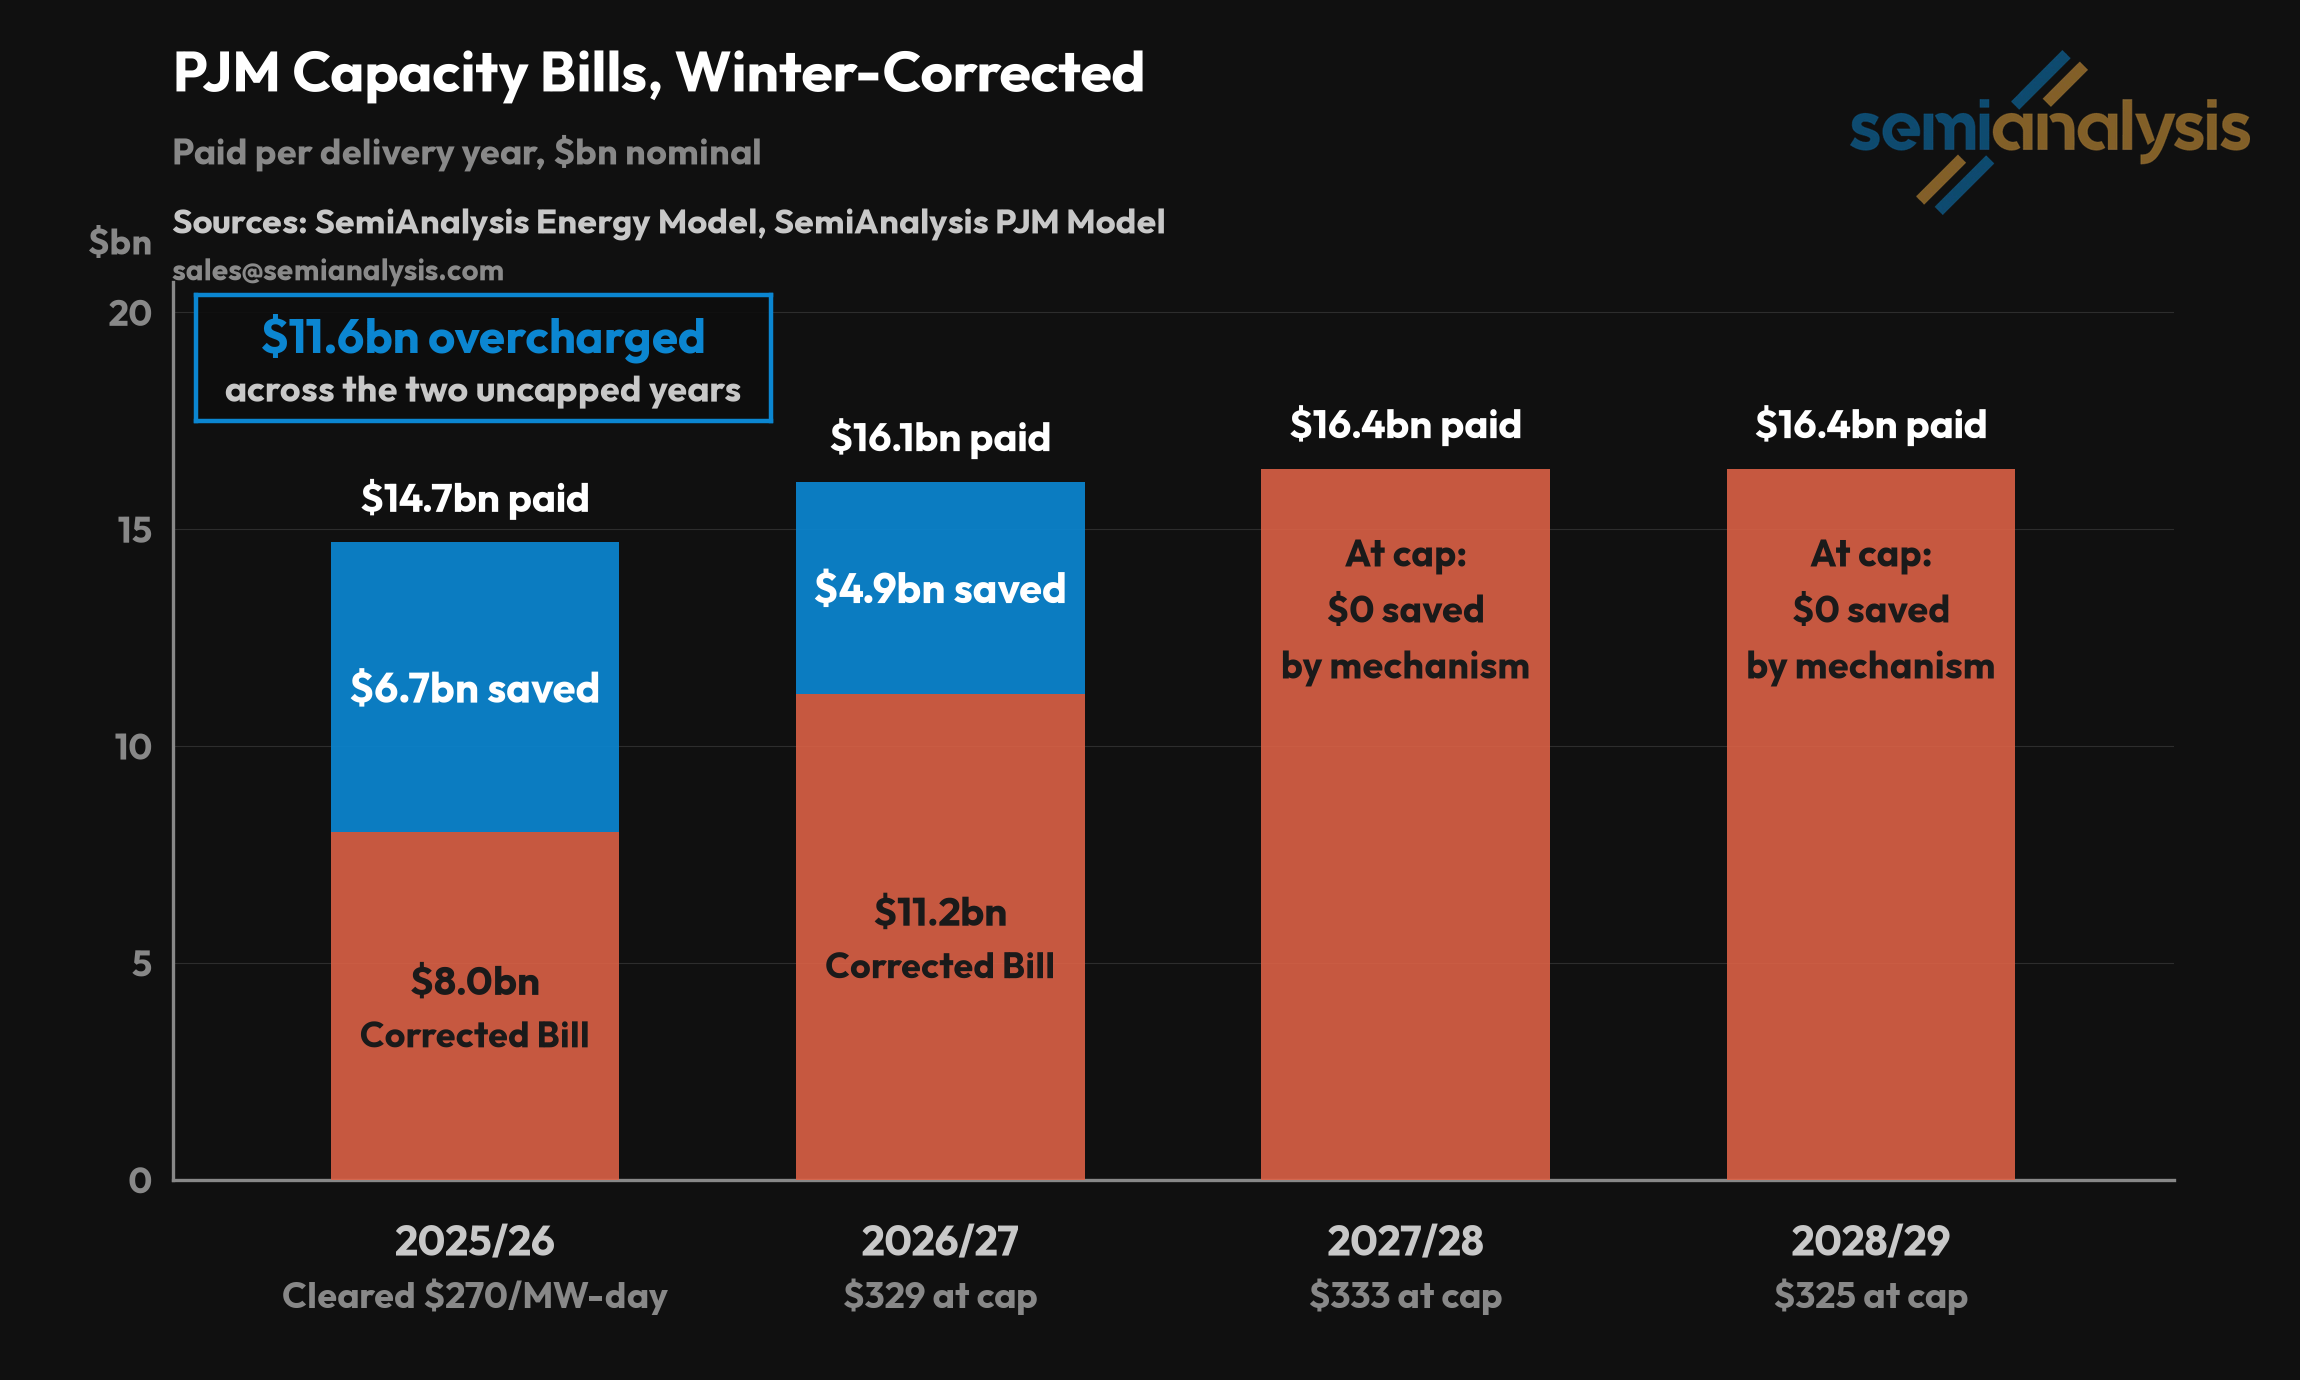
Using PJM’s demand and supply curves we calculate that better modeling would have resulted in $6.7B of savings with only 0.014GW (yes, 14MW) less power procured for 2025/26; then $4.9B and 0.8GW for 2026/27. More power meaning less in savings might be counter-intuitive but we have the supply and demand curves to show how these disproportionate impacts occur. PJM has forced itself into operating at the limit, so inaccurately modeling power plants’ capacities has a massive impact on auction costs.
PJM has constrained its own supply of new power by having one-year contracts that start too soon after they are signed, as well as being slow to connect these new plants to the grid. This means fulfilling any demand growth requires paying a big premium for new power plants to be built at unrealistic speeds. PJM also runs the only capacity market in the world that does not distinguish between new and existing power plants. So that premium paid for new power plants is also paid to existing power plants for doing nothing. The same growth in a market that splits new and existing power plant auctions avoids the volume effect of repricing the entire fleet; which means ratepayers are better protected from price spikes.
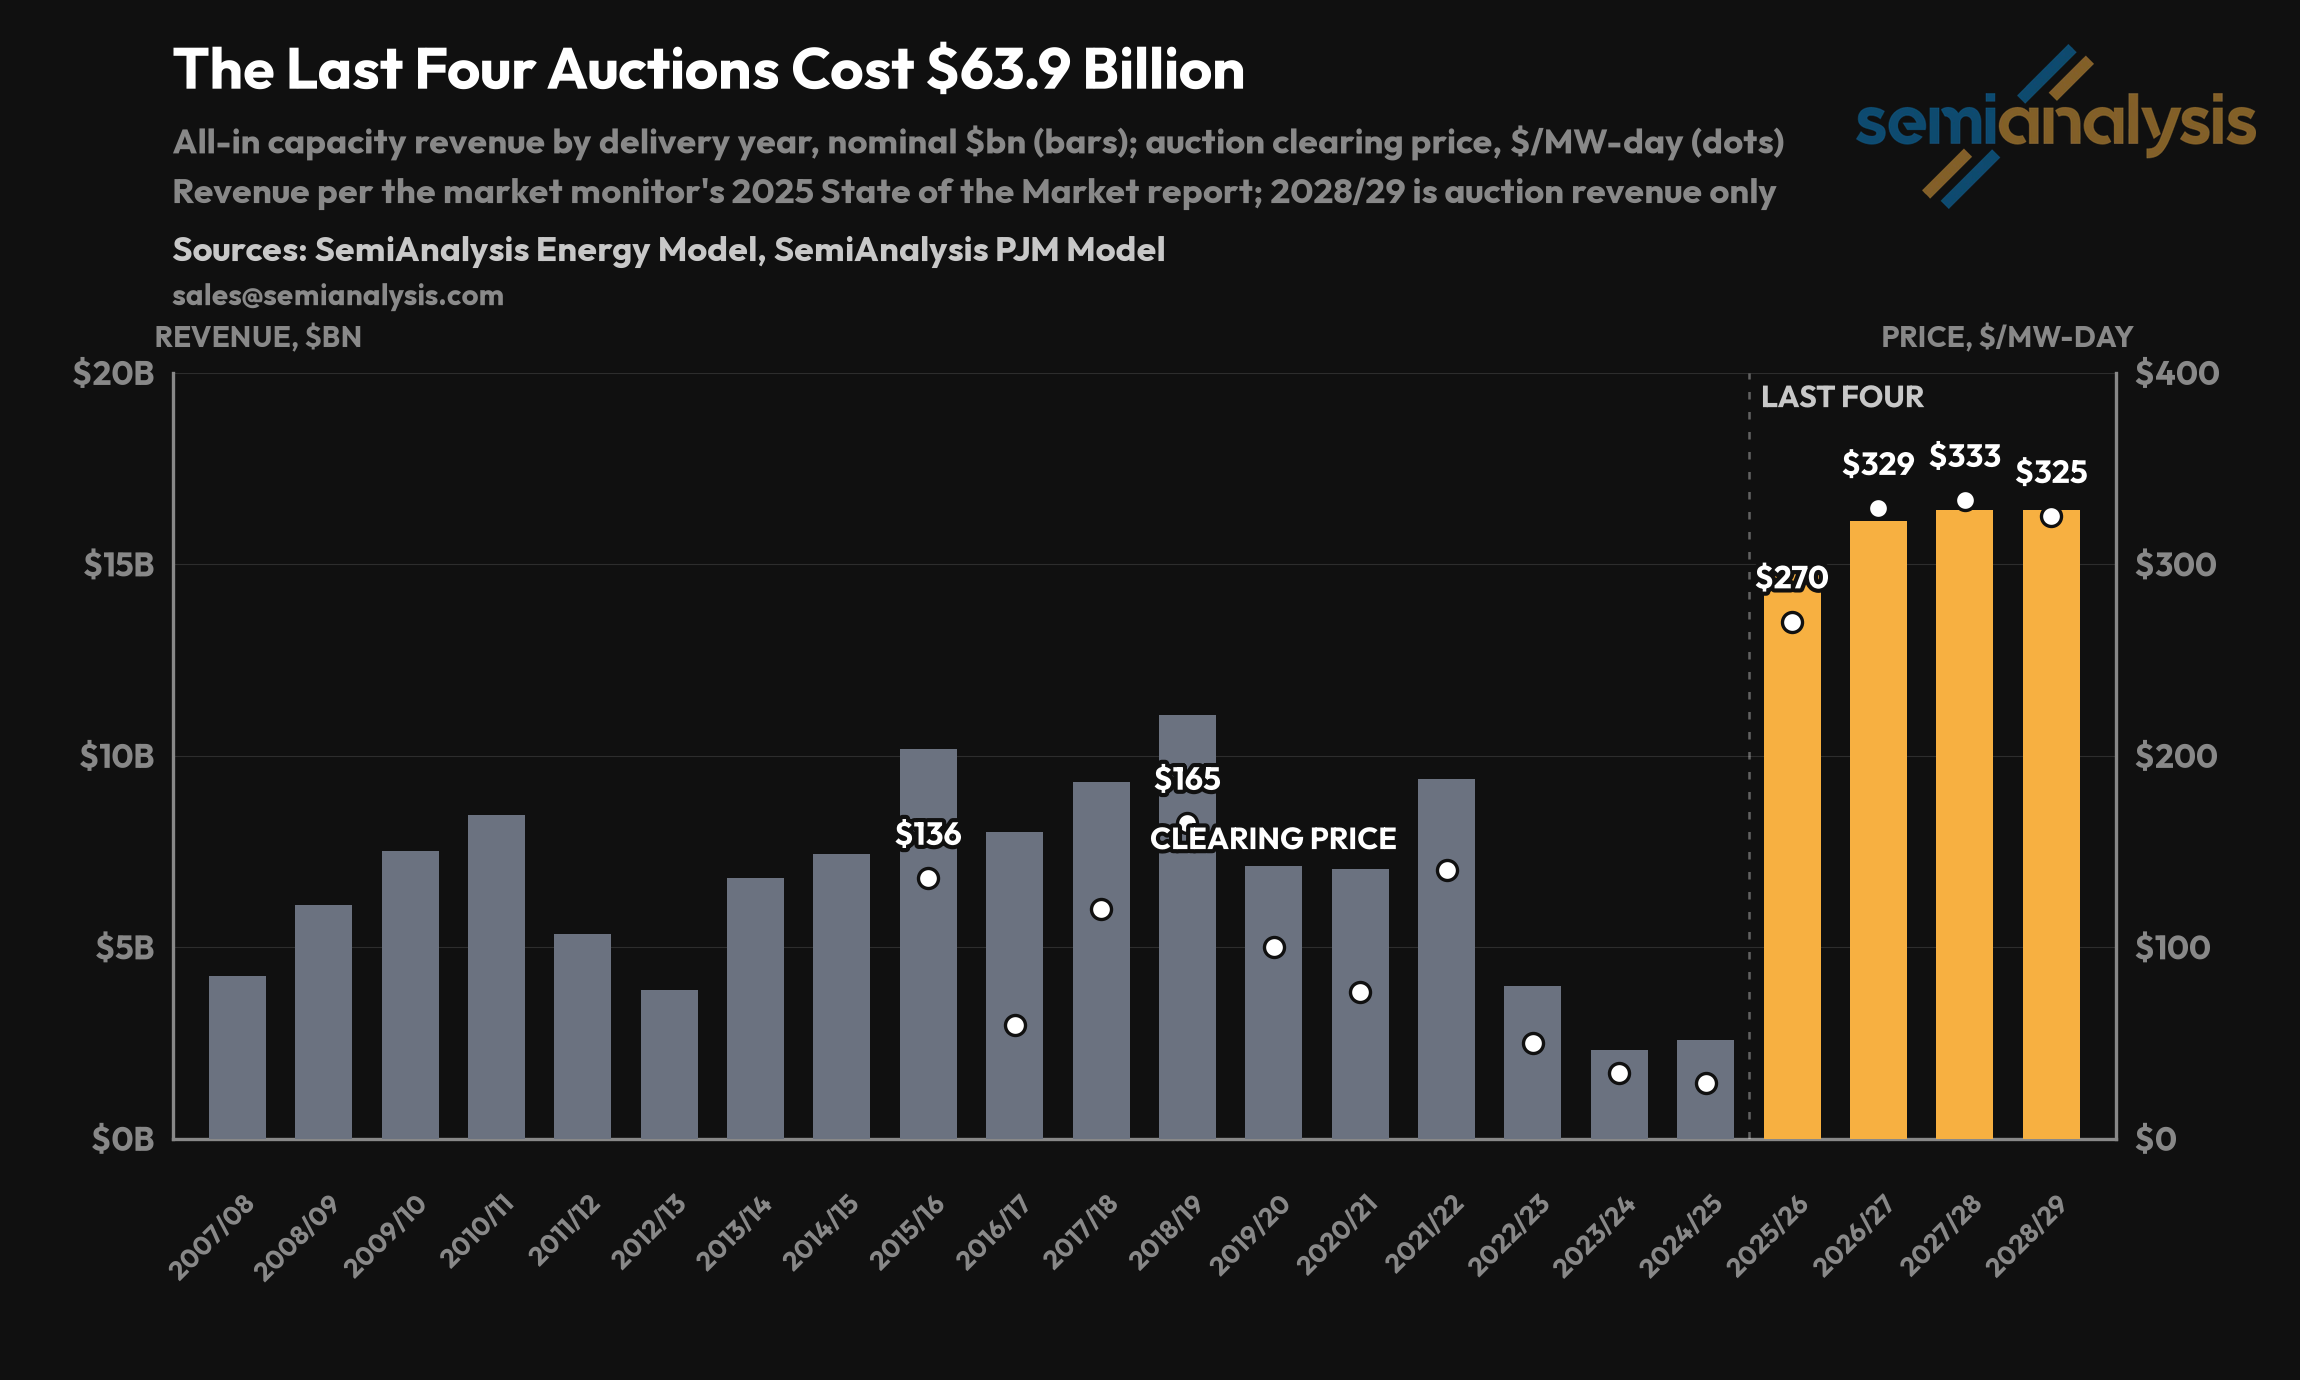
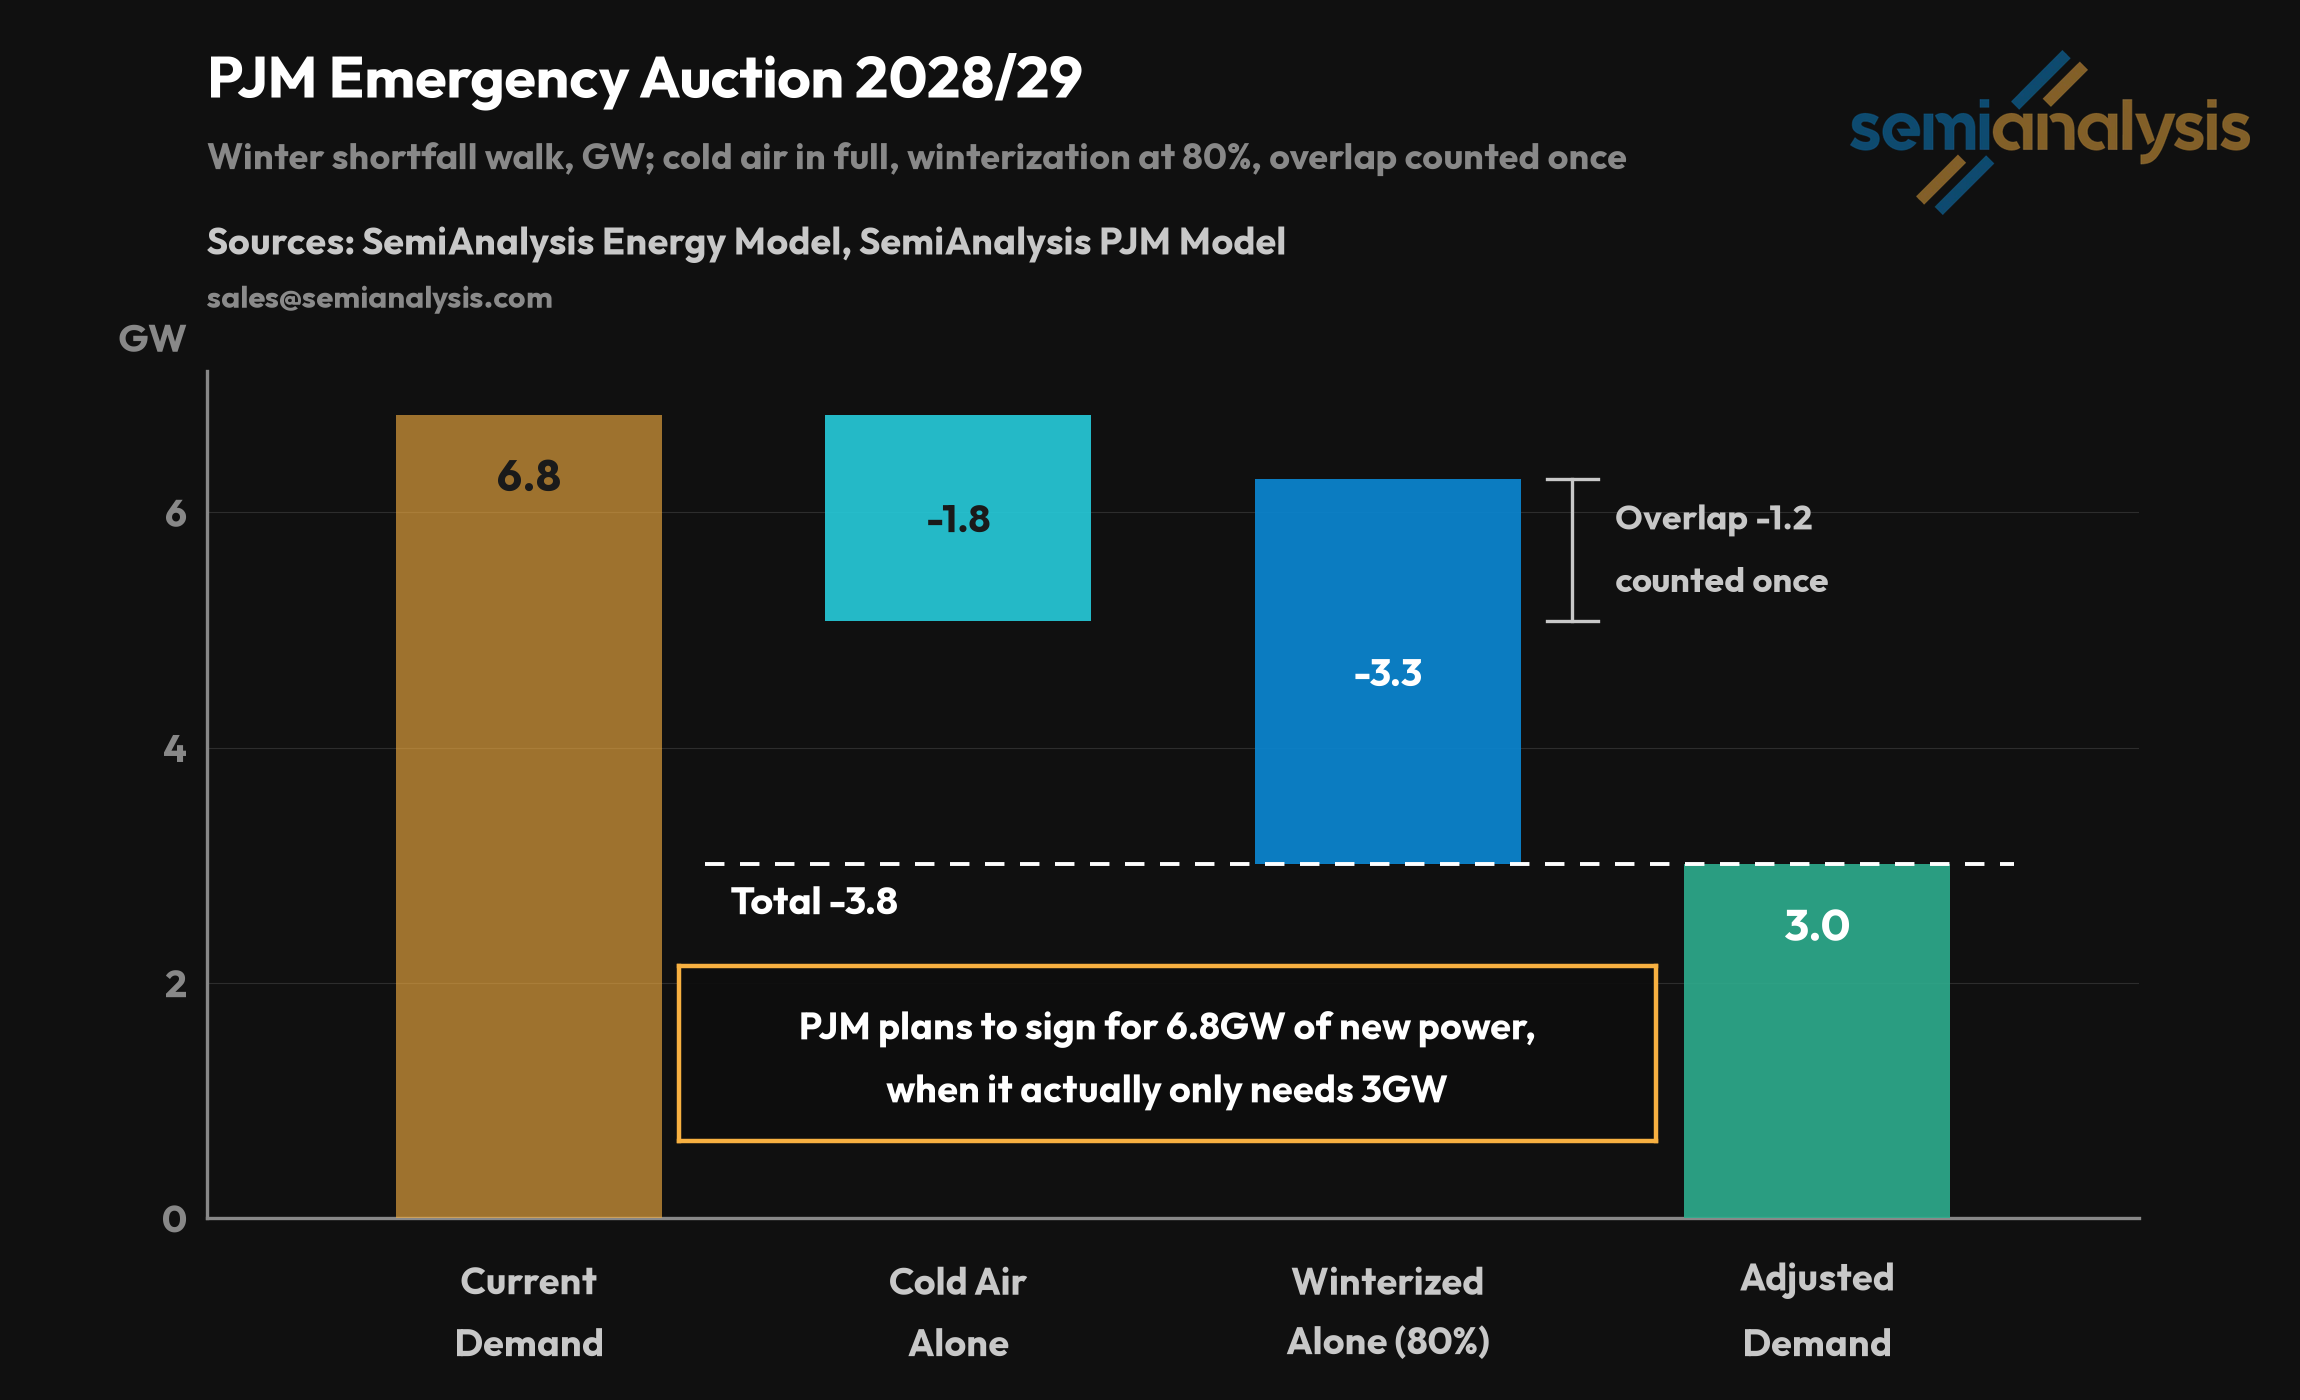
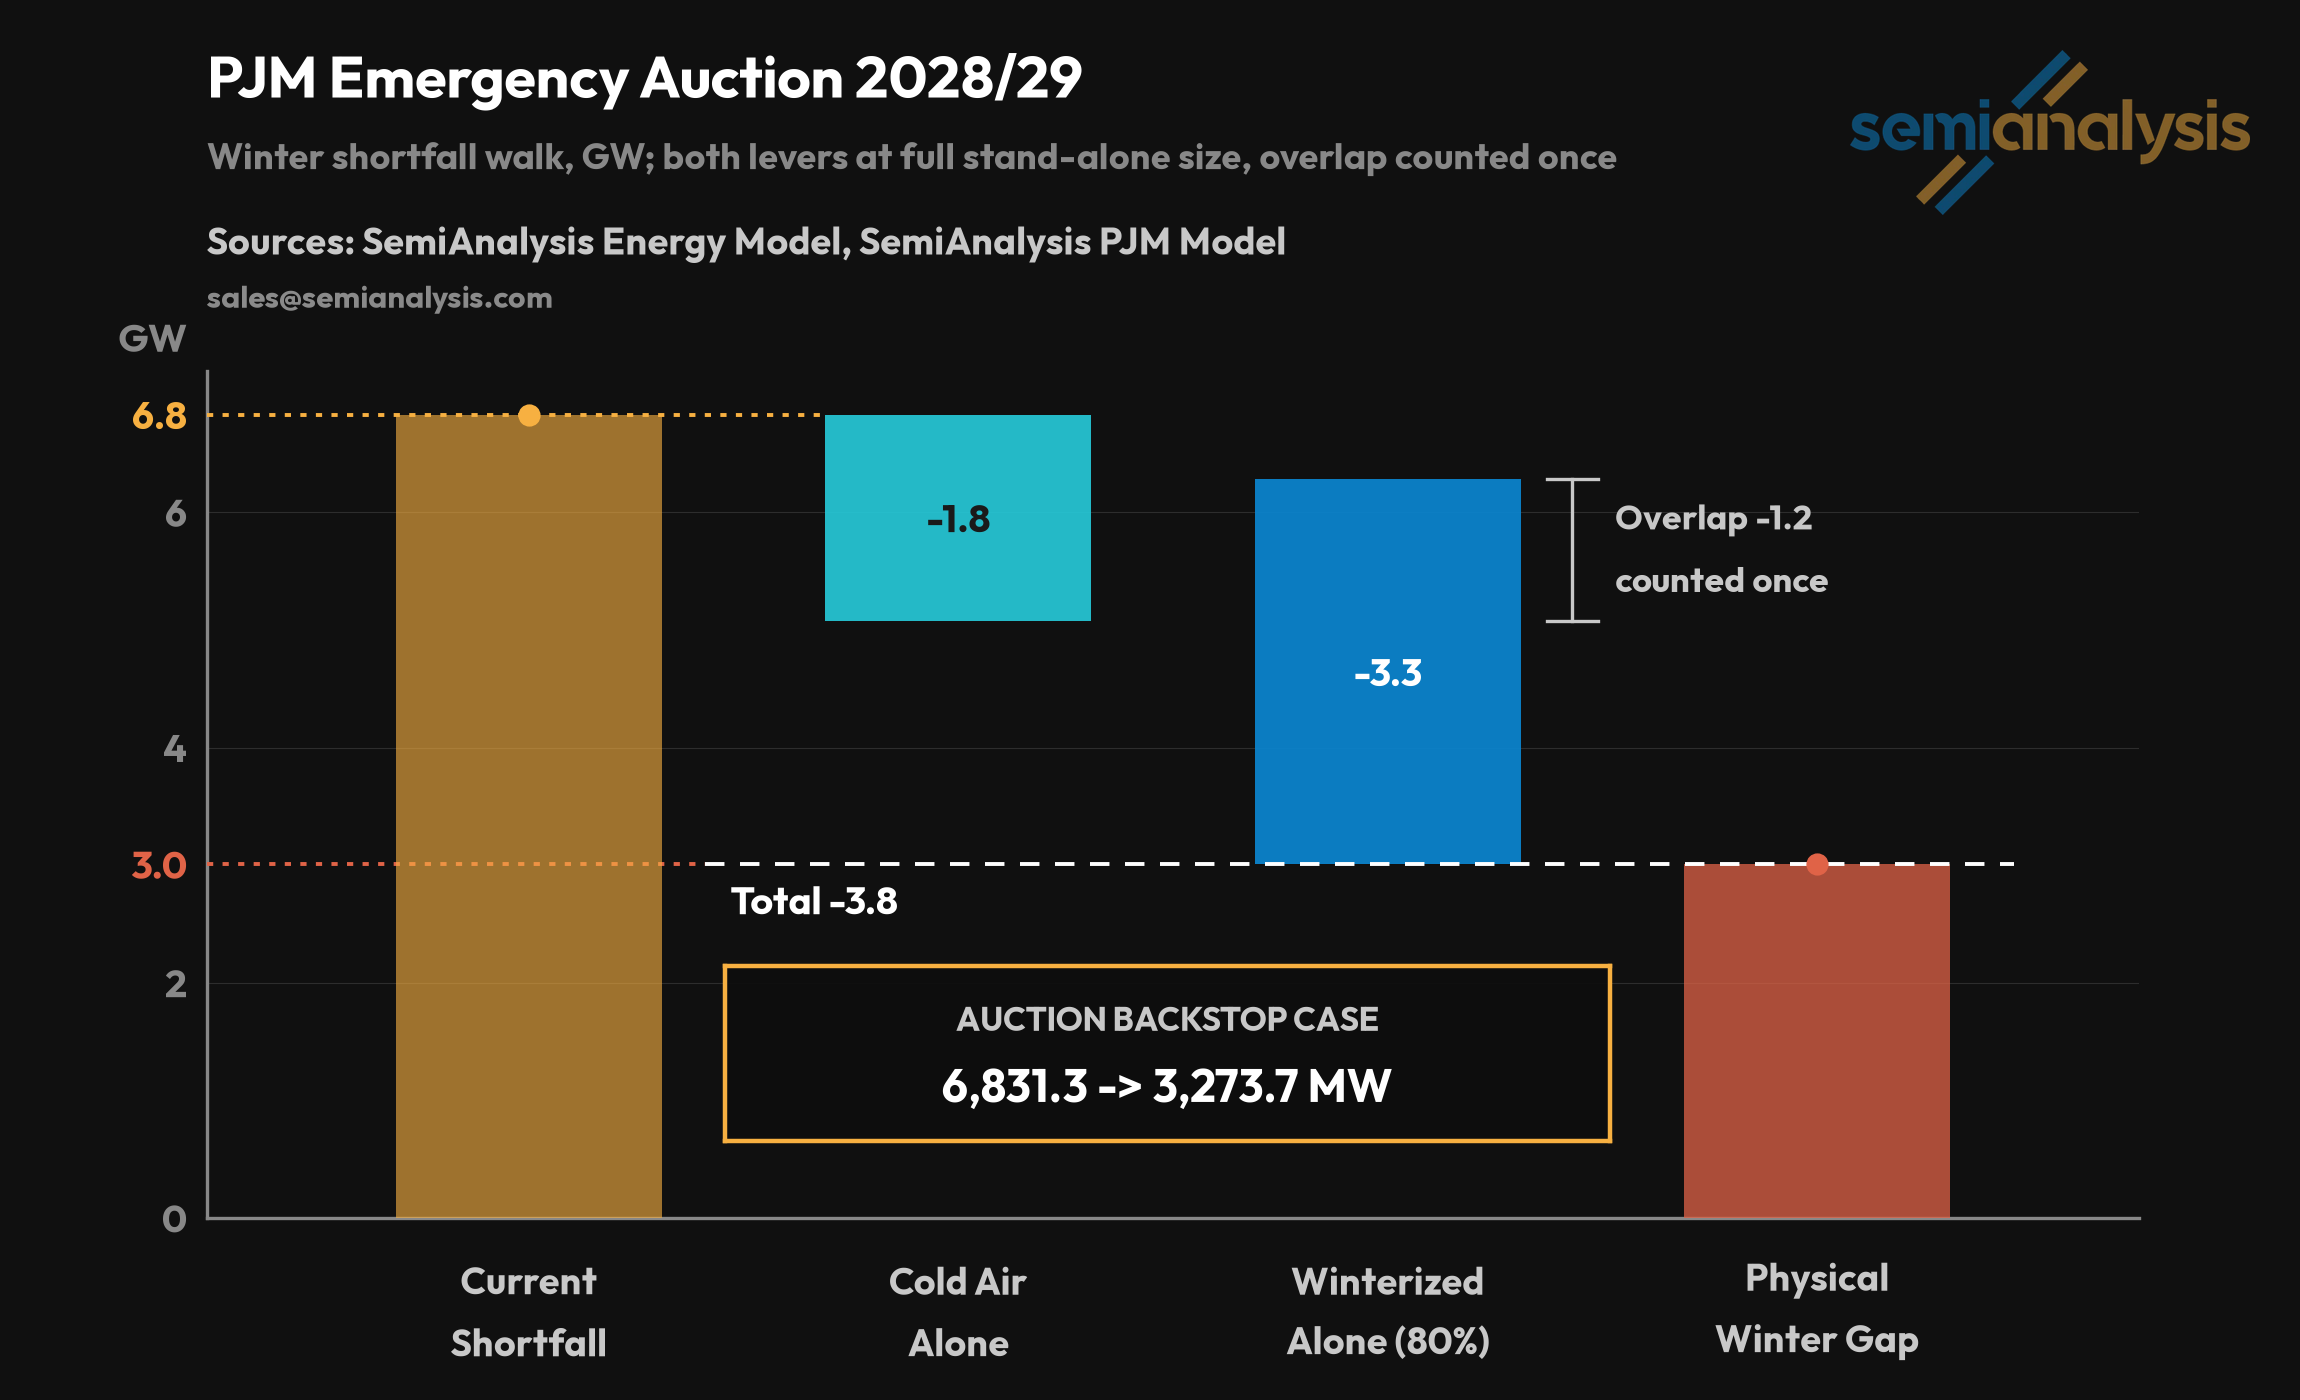
Despite four record-breaking auctions costing $63B, PJM will be short of the amount of generation it needs to run reliably, and plans to run an “emergency auction” from September 30th to October 21st with results by December 2nd. SemiAnalysis concludes there is an additional 3.8GW of reliable power on PJM’s system by taking into account increased turbine efficiency from cold air, and reduced risk of winter failure after federally mandated asset winterization investments. This is the equivalent of eight large gas power plants which would cost around $10 billion to build today. This 3.8GW would negate 56% of the 6.8GW that PJM plans to procure in its emergency auction.
PJM’s emergency auction presents serious risks, it will sign contracts running to 2043 that are supposed to be paid for by new large loads. These are not sales of electricity; the plants get paid just for existing, whether or not the forecast demand ever arrives. But PJM is doing this with no committed counter-parties. PJM does not have its own money, everything it spends is from ratepayers.
Every PJM state will have to pass (but none have done so yet) their own cost-allocation policy to pass on costs to participating new large loads. But those large loads can opt out if they contract their own additional power plants directly. If they participate there is little clarity on how much of the auction’s capacity they are expected to pay for. Participation brings no other benefits, like accelerated interconnection timelines. Many datacenter developers have written off PJM regardless, going elsewhere or planning behind-the-meter power configurations. If no other counter-party emerges, then once again those left holding the bag will be the residential ratepayers.
In this report, we dive into PJM’s capacity market and introduce our proprietary reverse-engineered model. We believe that PJM fails to accurately model two critical supply characteristics, despite key stakeholders recognizing them to be both real and of importance:
PJM does not credit how cold, dense air makes gas plants stronger electricity generators by up to 25% in winter; and
PJM’s risk calculations have not been updated to recognize that as long ago as 2024, 400 of PJM’s ~700 gas plants had invested in winter reliability measures in response to the outages from Storm Elliott.
There are deeper problems at PJM than just modeling. Its current auctions were designed two decades ago, and it has not experienced demand growth since. Today PJM is structurally anti-growth. PJM is failing to adapt to this new era of load growth because of a governance deadlock, a vetocracy of vested interests. If it cannot achieve market reform perhaps it can stem the ratepayer bleeding by improving how capacity is modeled, especially when winter is coming.
This report will dig deep into PJM’s capacity market. After providing some introductory context, we adopt the following structure:
We start with the fundamentals and explain how PJM models supply, demand, and reliability risks. We cover their major modeling methodology change in 2024 from EFORd to Reserve Requirement Study and the implications of that change.
We introduce our reverse-engineered model and cover in greater depth how we calculate the role of various resources, outages, reliability, and fleet size.
We get to the core issue: PJM’s lack of consideration of the increased throughput of gas power plants in the winter, and their improved reliability through Asset Winterization.
We then dive into the pricing impact. PJM’s capacity auctions are highly complex and we explain why and how PJM’s 66M residents’ electricity bills were $12B higher than they needed to be.
Lastly, we provide some thoughts on the future of PJM and its upcoming Reliability Backstop Auction. This is an emergency mechanism hoping for datacenters to pay for their own capacity. We believe that ratepayers could, again, be at risk.
Let’s go.
This report is a collaboration between SemiAnalysis and Nathan Iyer in his personal capacity.
Context
If you have not been following along, let us catch you up:
Power bills in PJM states jumped 17-24% in June 2025, and the state regulators labeled the capacity auction as the main driver. Read our PJM vs ERCOT article to understand PJM’s capacity auction, and how singular it is relative to other energy markets.
PJM constrains its own supply of new power plants by requiring them to be built unrealistically quickly and not even accelerating the grid connections of critical projects. This constrained supply greatly increases prices in the auction.
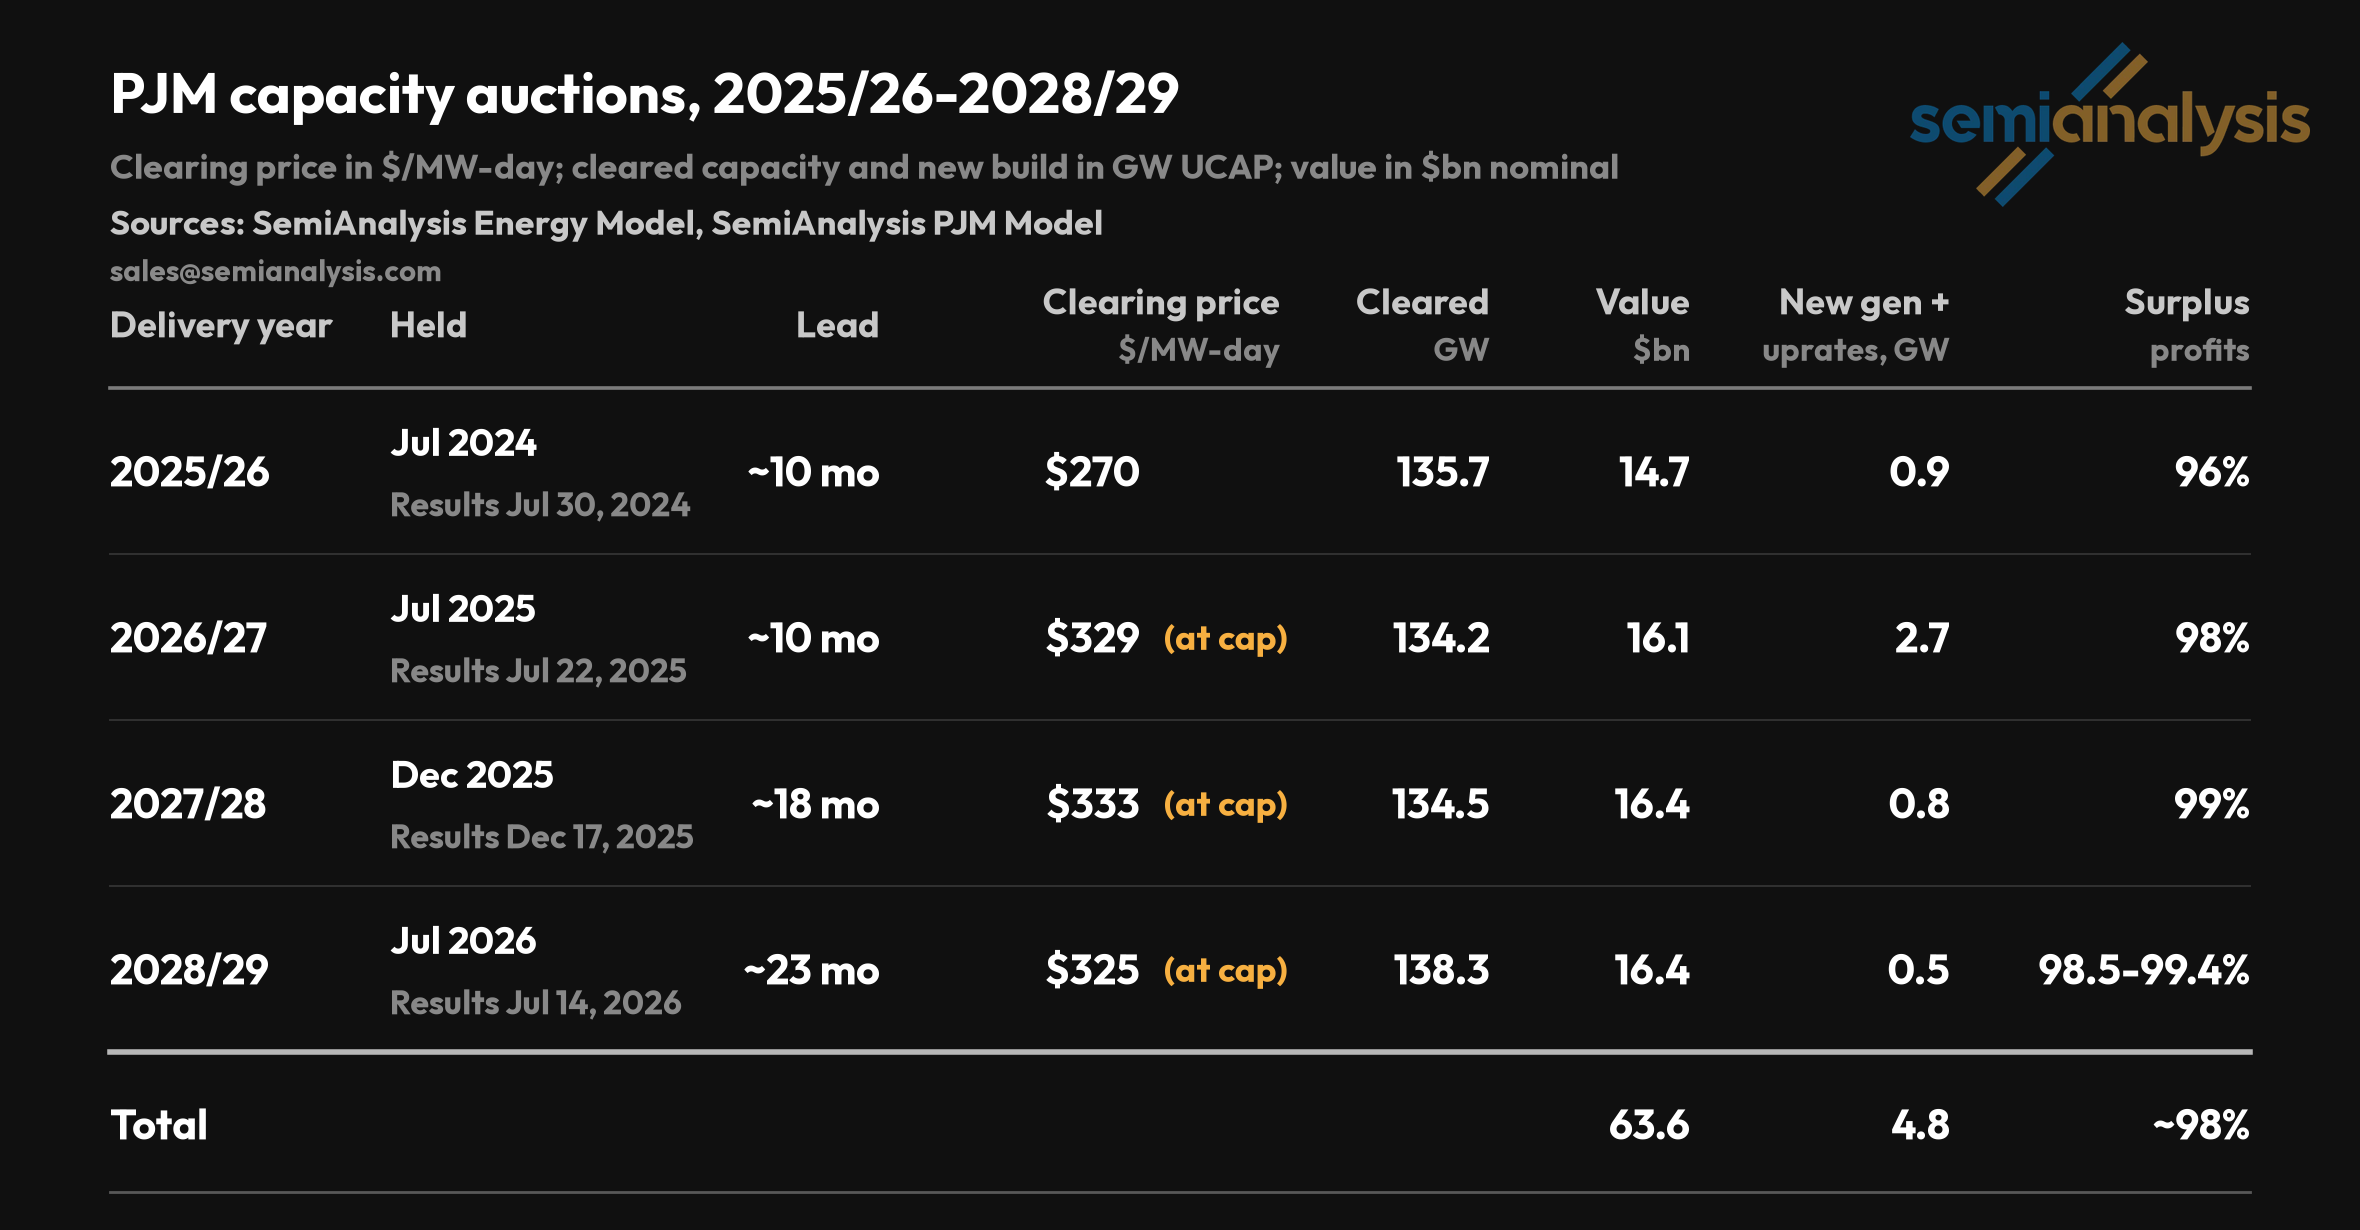
PJM’s capacity auctions restarted in July 2024 after extended delays. This cut the lead time for new generation to get built from the intended 36 months (per the Independent Market Monitor) to 10 months, rising to only 23 months for the latest auction. Power plants take time to build and need long term visibility so giving only a 23-month lead time makes it near impossible to build new generation.
The four auctions since have each procured 134-138GW a year of accredited capacity at prices that jumped from $28.92 before the delay to $270-333 per megawatt-day, raising the cost of a capacity auction from $2.2B to $16.4B, and the four-auction total to $63.6B.
This money is paid by every single household and business in the PJM area, and is little more than a transfer from ratepayers to existing power plants as over the last four auctions only 4.8GW of new capacity has been procured.
Already built capacity does not need $325/MW-day: PJM’s own market monitor says existing generators bid at $8-14/MW-day, and Great Britain’s latest auction paid existing generation $18/MW-day (£5/kW-year).
These gas plants do not need the money to stay online. The median existing combined cycle made 407% of its going-forward costs in the energy and ancillary services markets alone in 2025, before a dollar of capacity revenue.
PJM prevented new projects from getting a grid connection. From October 2021 there was no study path while PJM cleared its backlog; a general application window did not reopen until April 2026, when 220 GW applied.
Now PJM has two under-performing interconnection fast-tracks: 1. The Reliability Resource Initiative, 51 shovel-ready projects picked May 2025, now 41 with 31.5% of the megawatts withdrawn, first output scheduled 2030; 2. The 10-units-a-year Expedited Track opened July 31, 2026. Neither has energized a single megawatt.
PJM cannot reform itself: rule changes need a two-thirds majority across five equally weighted member sectors, so any two sectors can veto anything, and they often do. The Board can override depending on the reform but has chosen not to on these problems.
FERC has now given PJM until the end of September to reform its governance otherwise FERC will intervene. But FERC mainly has reactive rather than proactive powers and this threat is not strictly about the capacity auctions or modeling.
PJM is also the only market in the world where the capacity auction price is for the whole generation stack. Japan was the last other market to price the whole fleet on one year terms but has now concluded the design builds nothing and bolted on a separate 20-year auction for new entries.
Action
FERC is accepting comments on PJM’s backstop filing, until 21st August. Anyone may participate at ferconline.ferc.gov. SemiAnalysis will be submitting this analysis. We encourage others to do the same and we welcome any input on the model, please write to us at energy@semianalysis.com.
We also encourage PJM’s Board to file improved modeling criteria at FERC to change the tariff and Reliability Assurance Agreement, through the same fast-path process it used to install the current rules in 2023 and to launch the backstop this July. FERC must accept it if it is just and reasonable, and FERC accepted seasonal accreditation at MISO in 2022. The winter-ratings text was written in Package C in August 2025, passed by PJM’s own task force, but was not passed by the senior committee. The Board can pick it up tomorrow. Crediting mandated winterization has not been drafted. The closest attempt was the market monitor’s blunter version to delete the storm data outright, which was refused in the same session. FERC should require that the emergency auction’s 6.8GW target be recalculated before PJM signs contracts that will last until 2043.
Our main recommendations are:
These modeling recommendations should be implemented for the emergency auction as well as future auctions;
There should be an inquiry into the overspending of ratepayers’ money in the 2025/26 and 2026/27 auctions; and
Auctions for existing vs new capacity should be split.
Our more loosely held thoughts are:
The Emergency Auction should probably be canceled for posing too great a risk to ratepayers if new large loads do not arrive, instead only use direct capacity contracting as part of accelerated interconnection agreements; and
If the Emergency Auction is kept to make up the shortfall it should be paid for by existing demand with a short term fix of further lowering the price cap for the Base Residual Auction, this would effectively create separate existing and new capacity auctions.
Datacenters are how electricity can become cheaper than ever before by paying down high system costs using economies of scale and unprecedented value creation . To attract more datacenters and achieve this affordable energy future State Governors and customer advocates need to focus on the bureaucratic failures to create functional markets.
1. PJM underestimates the power plants it already has by ~4 gigawatts of reliable power
For a primer on PJM’s capacity market and auctions, read our previous report. As a TLDR: PJM acts as a central planner and runs auctions to ensure there is enough supply to meet peak demand, with a safety buffer. PJM made its planning more sophisticated in 2024, but due to failed stakeholder votes, did not include important inputs. The result of leaving out these inputs is that PJM overestimates system risk during winter months which leads to trying to procure too many new power plants as backup. But PJM also has a constrained supply of new power plants which leads to price spikes, trying but failing to fix this scarcity.
Things weren’t always this way.
In 2024, the same year the capacity auction prices first spiked, PJM overhauled their resource adequacy modeling. Previously, the PJM system operated under a system called “Equivalent Demand Forced Outage Rate” or EFORd. The capacity target was set by taking the peak demand and adding a margin based on the chance a generator might be offline. However, this system is not able to effectively capture correlated failures, which are more common in cold winter months for natural gas power plants. It also fails to account for newer technologies on the grid. Specifically variable resources which require modeling on at least an hourly basis to capture their contributions to capacity. These are intermittent generation such as wind, solar, or run-of-river hydro; as well as ‘limited’ resources, like storage of all kinds.
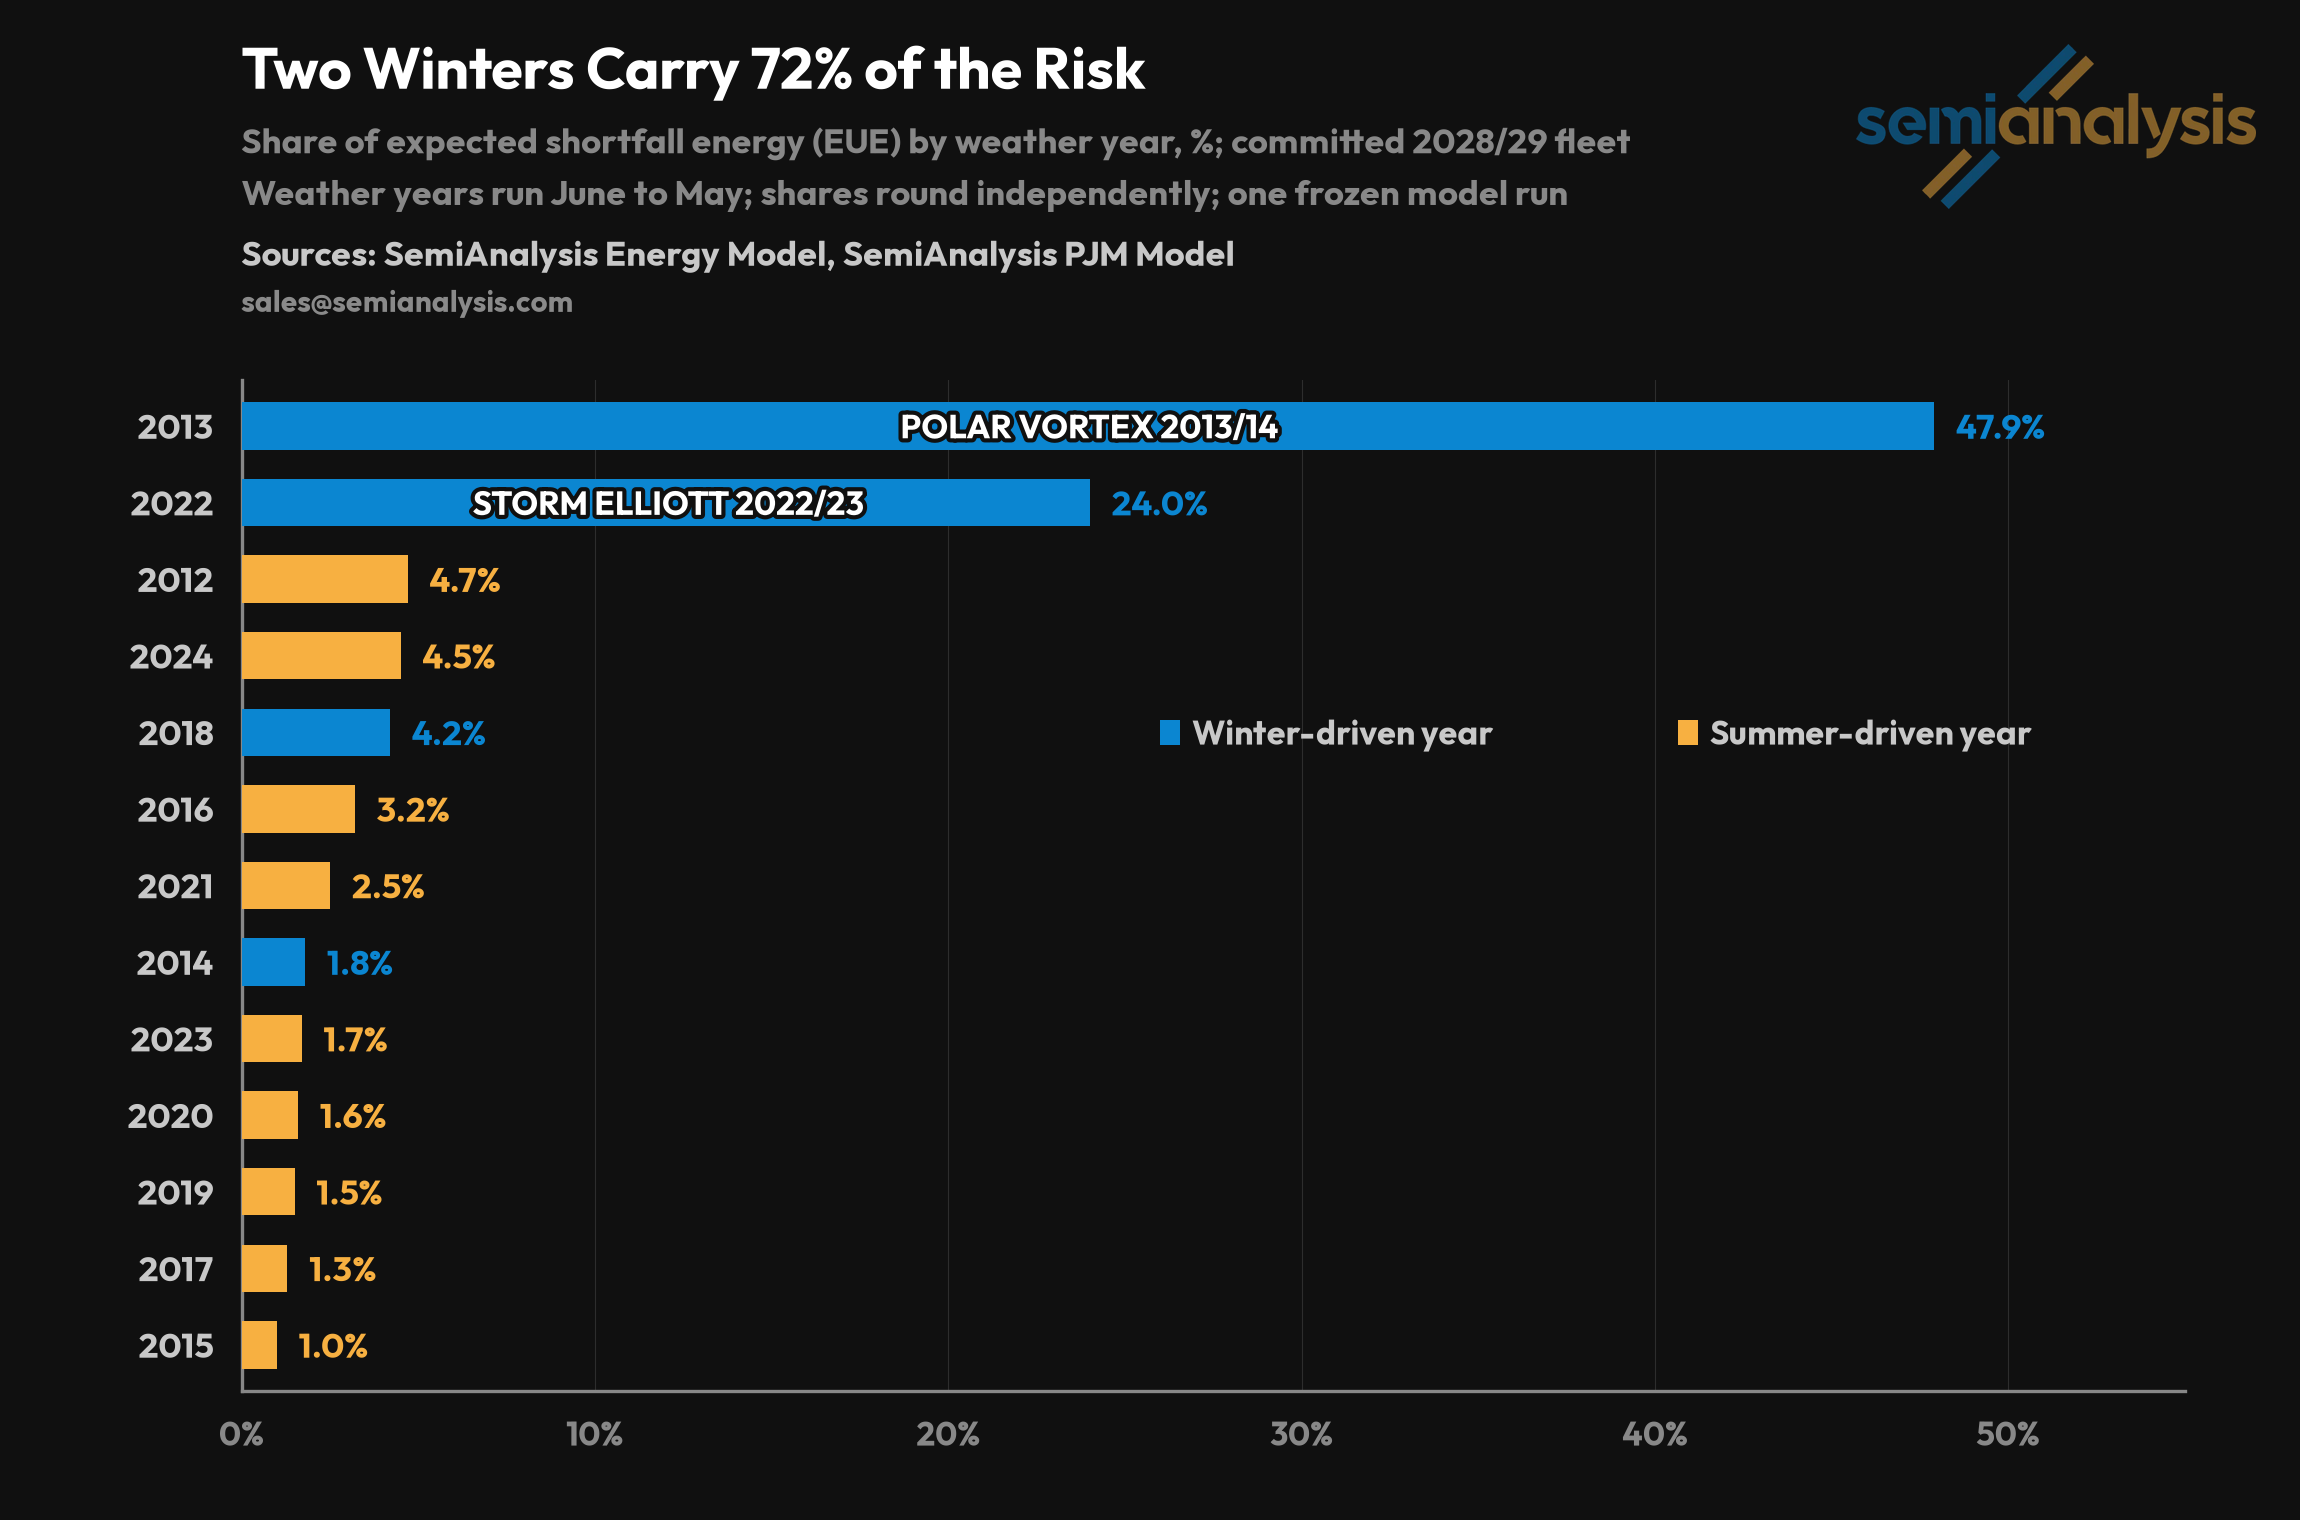
These limitations came to light in 2022. During Winter Storm Elliott, PJM lost 24% of its total generation due to forced outages and derates, and two thirds of the loss came from natural gas generators. Storm Elliott led to a substantial overhaul of the Reserve Requirement Study making it into an hourly risk framework. In this study PJM models demand against supply for every hour of the year for a number of theoretical years, using both historic and forecast-based randomized data. This more detailed approach identified that at certain times of the year there is not enough supply relative to demand.
As a result, gas in particular suffered a 10-20% knock-down. These two changes had a large system impact, cleared capacity fell by 8% (12GW from 147GW to 135GW) between the auctions for 2024/25 and 2025/26. It is as if the system lost a score of large power plants. The capacity auctions have been expensive since PJM basically had to buy replacement plants.
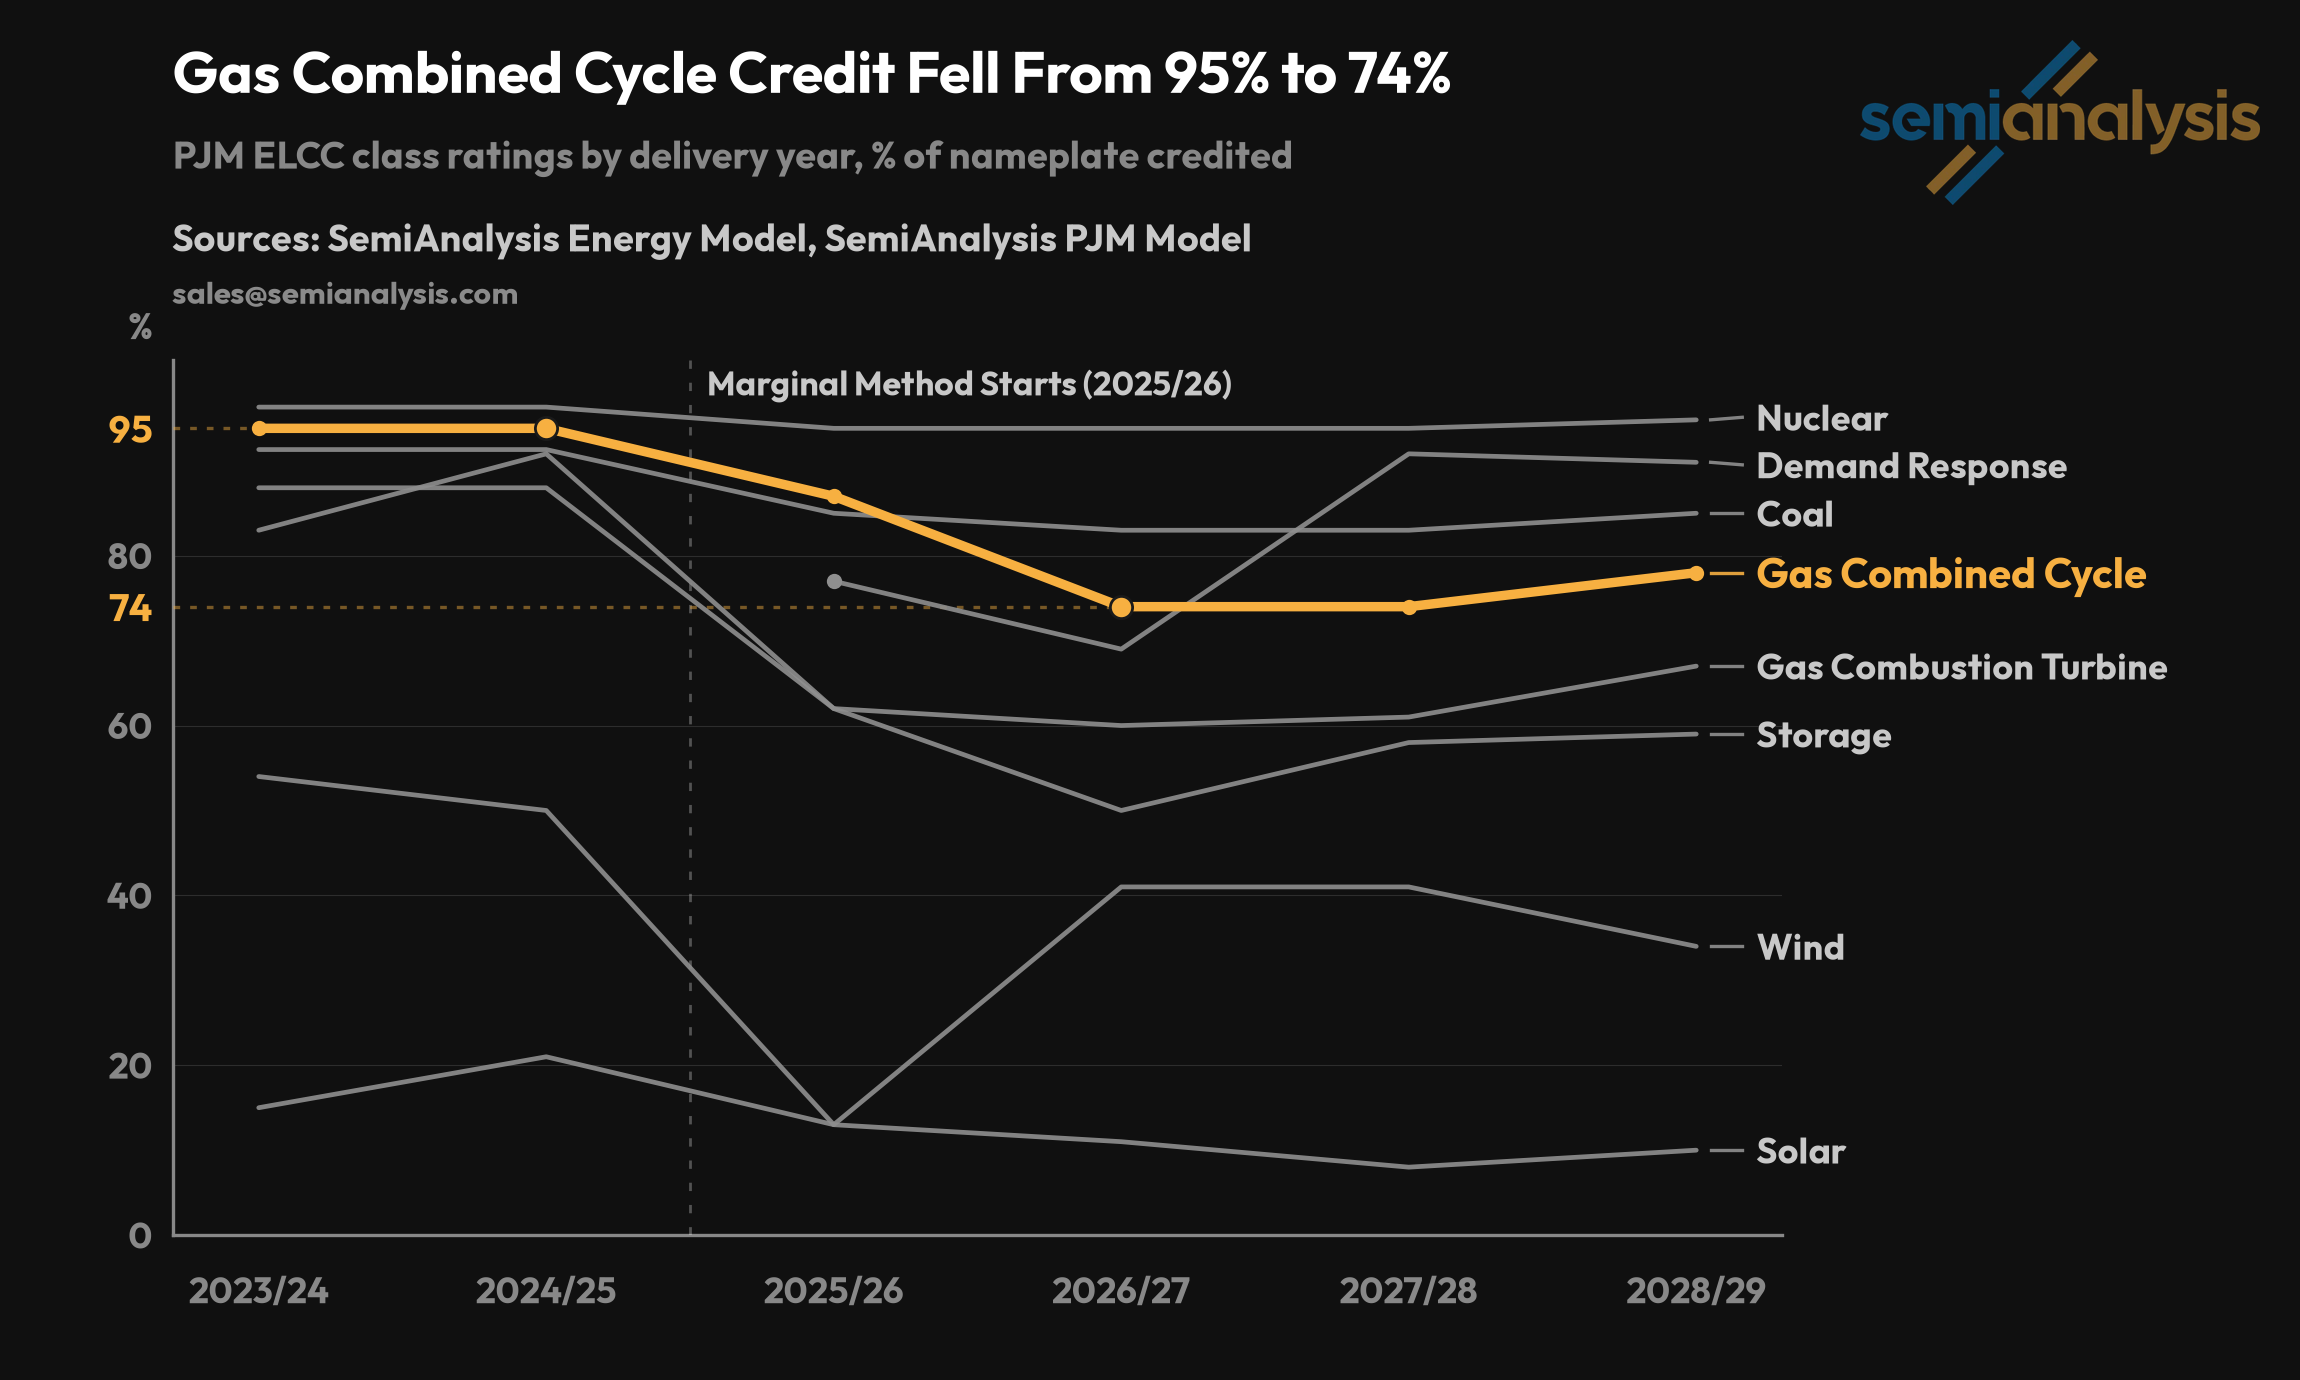
The shift from a summer risk system to a winter risk system is a much bigger deal in PJM. It has one central auction, versus other capacity markets, which instead distinguish specifically between winter and summer. For PJM, a winter risk system degrades the reliability value of stronger summer resources (e.g. solar and storage which can bridge afternoon peaks), and enhances the stronger winter resources (e.g. nuclear, coal). Even a minor improvement in winter gas risk can have ripple effects across every resource, with major commercial implications.
The study’s hourly matching against weather and demand scenarios defines how each new generator improves reliability of the system. To many this new system is a black box. PJM, to its credit, publishes a portion of its work and data. It is complex but its nuances are important for understanding PJM’s current problems. With which, combined with other public data, we have given our best shot at reconstructing the model and scrutinizing its inner workings. In doing so, we’ve identified and corroborated a number of weaknesses that are of great importance to recent price spikes; reliability concerns; and the upcoming backstop auction.
The Reserve Requirement Study
PJM’s new(ish) system overestimates the risk in winter months which leads to overbuilding power plants. Our model re-runs the Reserve Requirement Study on the same whole-system basis PJM uses. Our conclusion is that the same fleet is worth more reliable capacity than PJM credits it, so the auction requirement against total electricity demand falls.
While PJM models demand with its year-round variations, it caps supply at generators’ summer accreditations. On one hand, that makes sense as PJM is a summer peaking system. There is more air conditioning electricity demand in the summer than there is heating demand in the winter, and so the highest demand points in the year are in summer. Even when netted off against the increased output of solar, the demand for reliable power plants is still higher in the summer than it is in the winter.
On the other hand, historically failure rates of generation are much higher in the winter, tend to be correlated across fleets, and aligned with periods of highest demand. Higher failure rates mean that winter can be the most probable time for supply to fall short of demand. Gas is less reliable in winter as storms can cause them all to freeze at the same time, as seen with the Polar Vortex and Storm Elliott.
This type of winter risk is recognized in PJM’s modeling but the details are out of date and lack precision. They do not consider how cold improves the operations of the plants that do not fail, or how plants have hardened themselves against the weather in recent years.
PJM uses historical data for performance. This means that if a resource falters one time, the only way to increase reliability is to wait over a decade to flush the event out of the system. No amount of investments, regulations, or assurances can lift this judgment. As a result, the largest driver of reliability risk to this day was driven by a polar vortex in 2013 and the second is Storm Elliott in 2022.
Self-Supply
Why aren’t PJM ratepayers better protected from price swings? In most other power markets, retail customers have long-term contracts with utilities and are not exposed to yearly capacity market changes. The market next door, MISO, also experienced substantial capacity swings, but the vast majority of households were unaffected because utilities had long-term contracts.
There are a number of reasons PJM is so all-or-nothing, but it comes down to a combination of retail choice and deregulation (shorter and less certain contracts), a Supreme Court case that struck down state efforts to support long-term contracts, and a long-standing FERC fight that boiled down to a partisan battle between resource preferences.
The other main option remaining is for utilities to procure enough capacity for themselves and then effectively eject themselves fully from the capacity market for 5 years. This shows up on the capacity markets as big swings, but ends up being relatively neutral impacts because the supply and demand impact is balanced.
Fleet Uncertainty
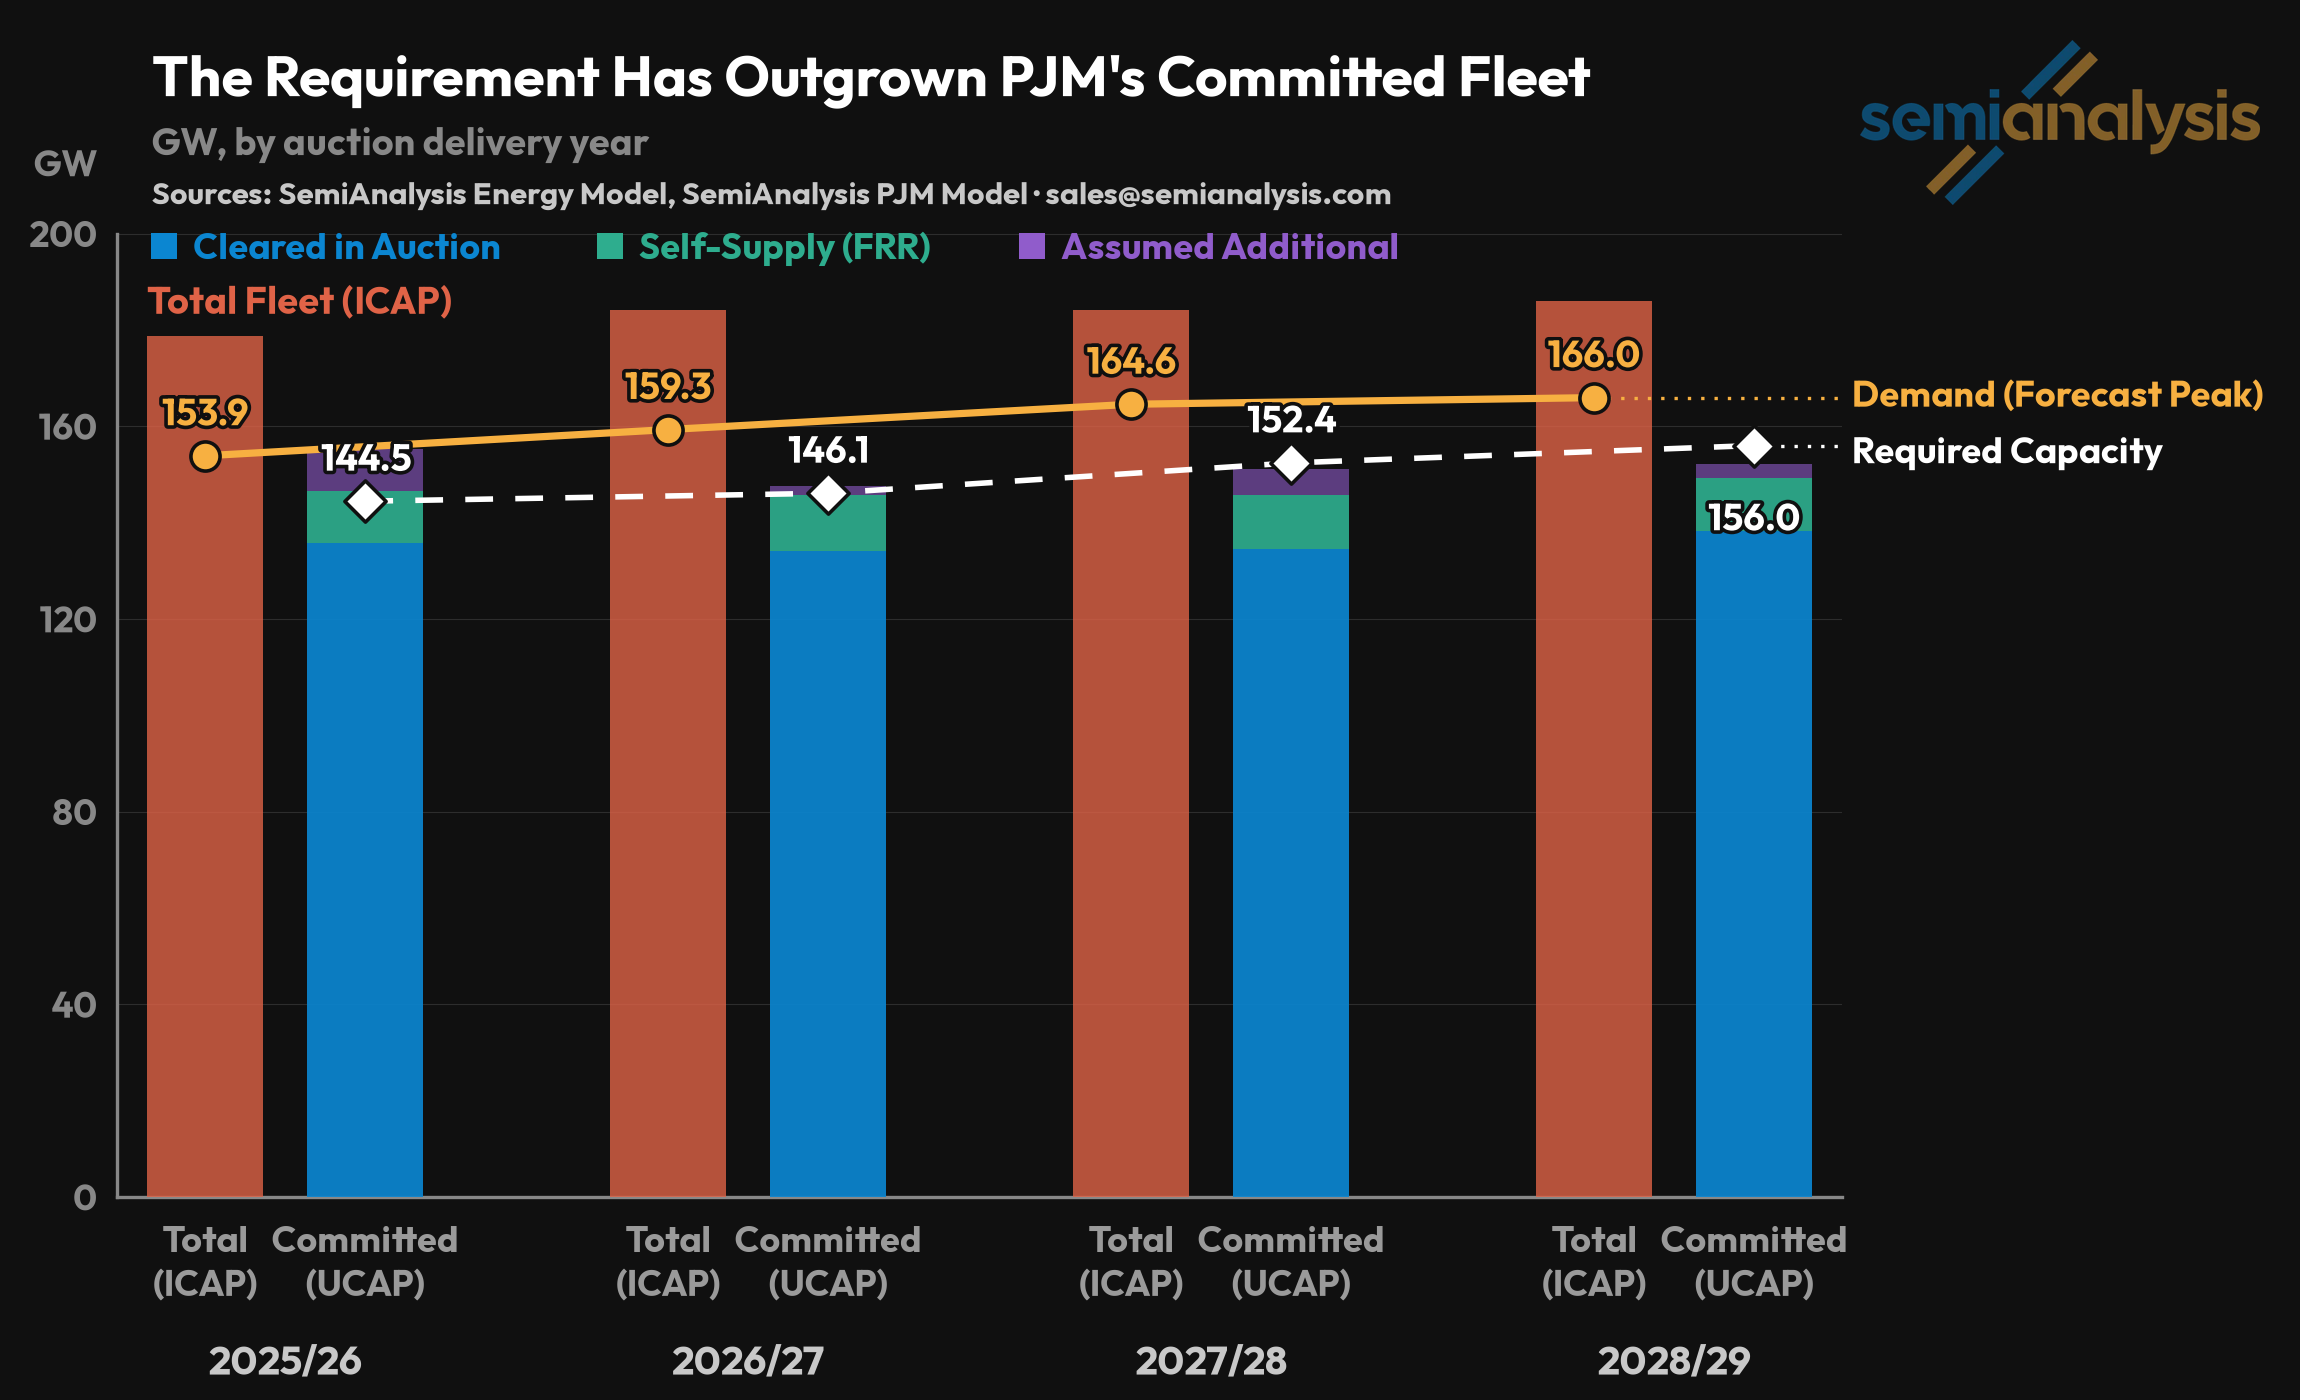
While data for PJM’s overall fleet is relatively transparent and drives their risk model, the auction itself diverges in often unpredictable ways and cannot be fully replicated.
The Reserve Requirement Study is bigger than just the Base Residual Auction, as some utilities ‘self-supply’. The Fixed Resource Requirement (FRR) alternative allows utilities to opt out of the auction and file their own capacity plans, with an obligation set by their share of load, which is ~8% of the PJM system (e.g. 12GW for 2026/27).
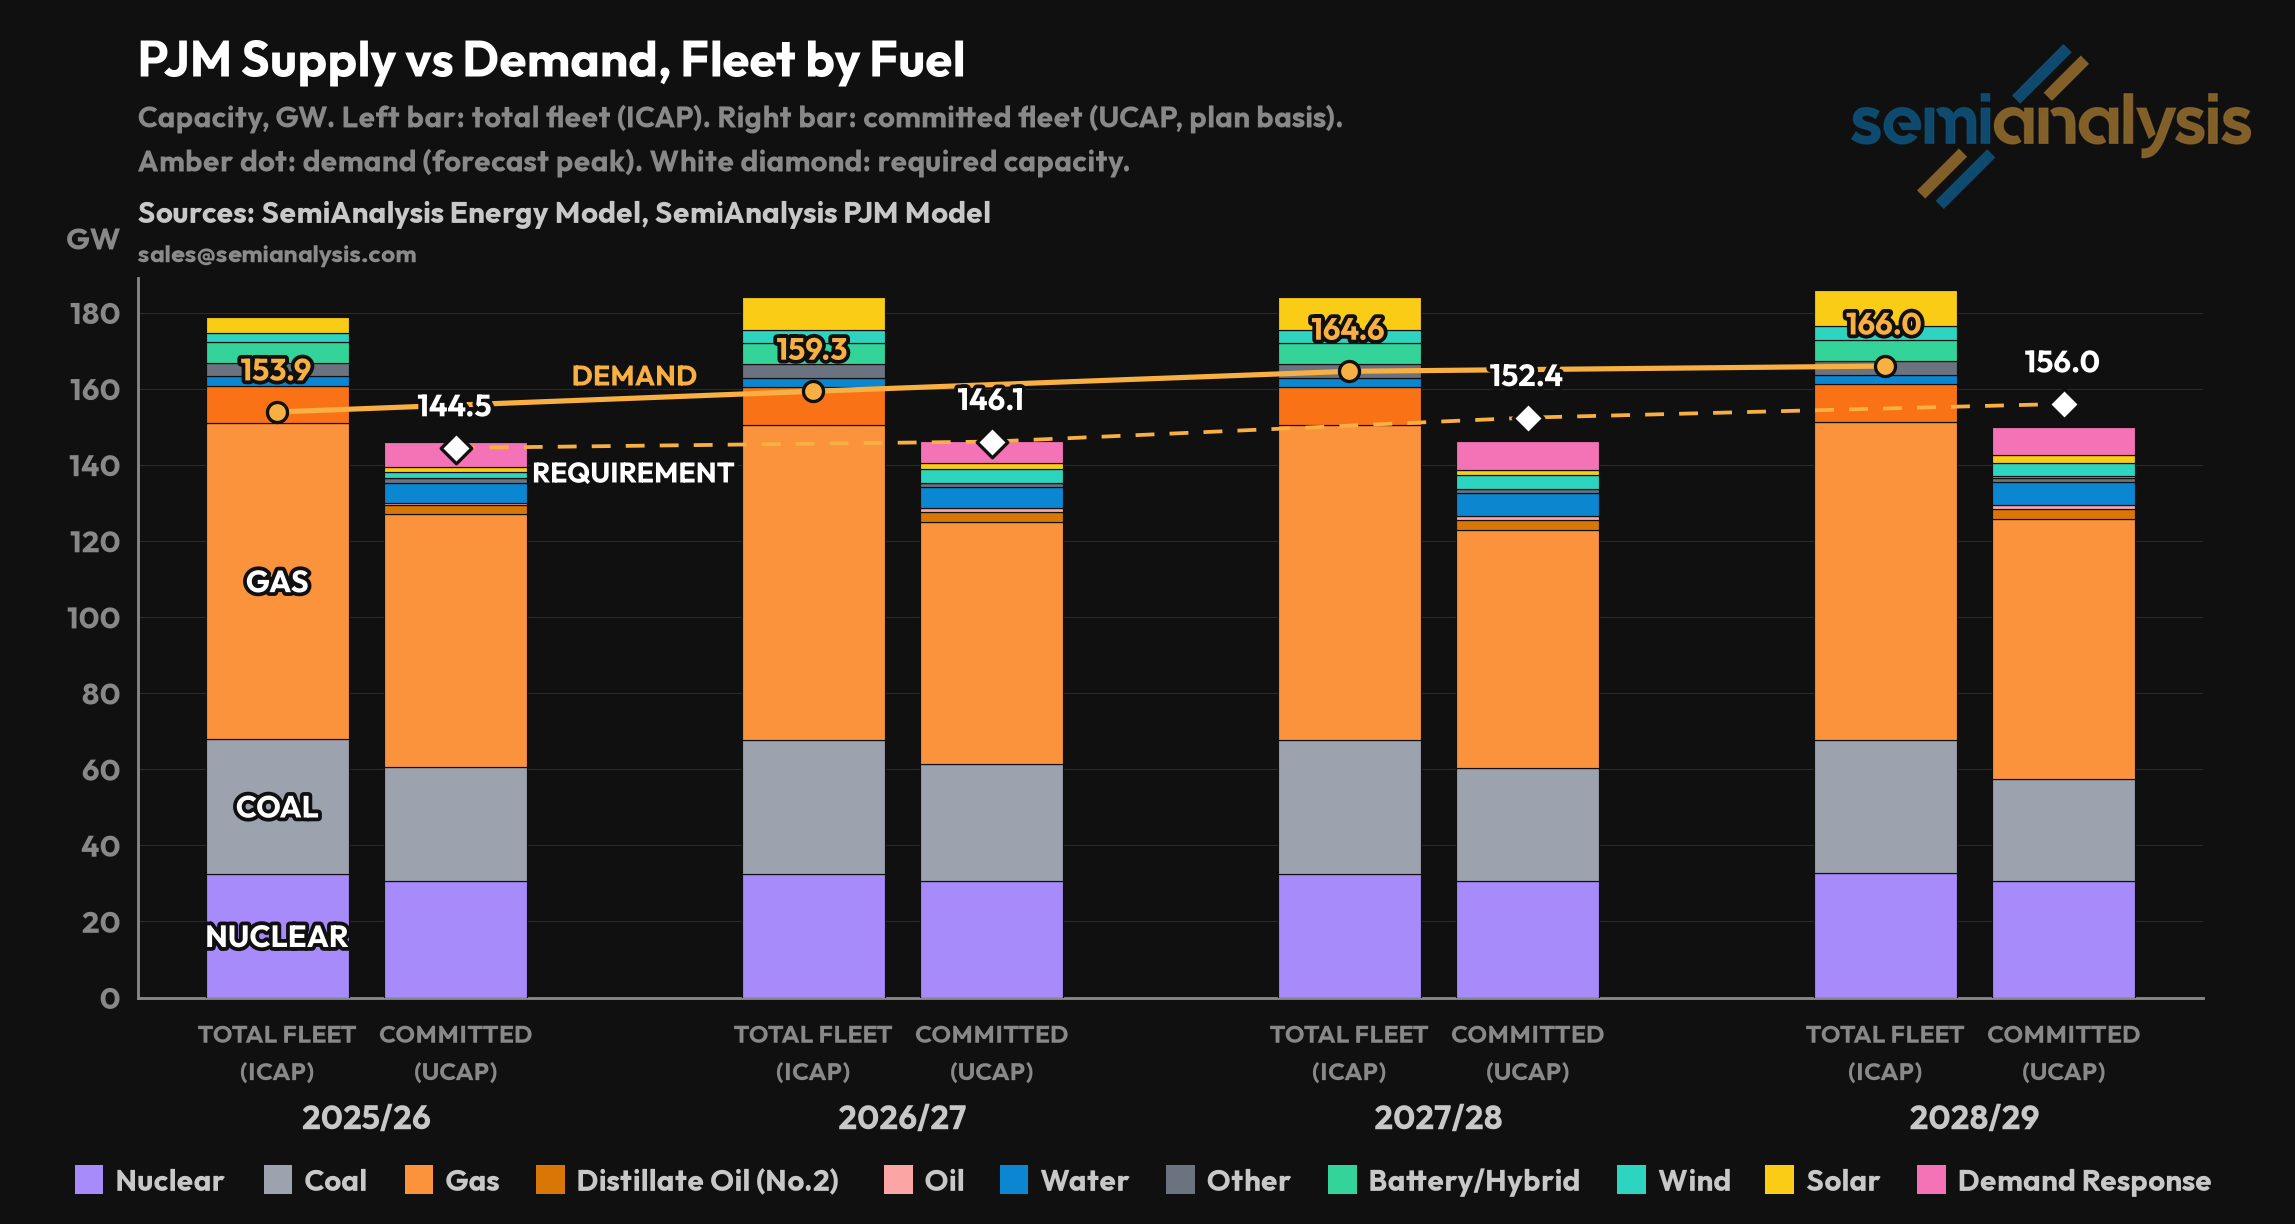
So PJM’s Reserve Requirement Study models an ‘Assumed Fleet’, and produces a whole-system number (e.g. 146GW of reliable capacity for 2026/27). The auction’s target is the requirement minus the self-supply obligation (e.g. 134GW for 2026/27).
The ‘Committed Fleet’ is the result of the auction and self-supply. In 2026/27 the auction cleared 134.3GW, 0.2GW short of its target, while the self-supply plans committed 12GW, about 0.3GW more than their obligation. The system ended the auction 0.1GW above the whole-system requirement, but only because self-supply over-delivered by more than the auction missed. Behind all of this sits the total fleet, the power plants that physically exist.
Reverse-Engineering the Model
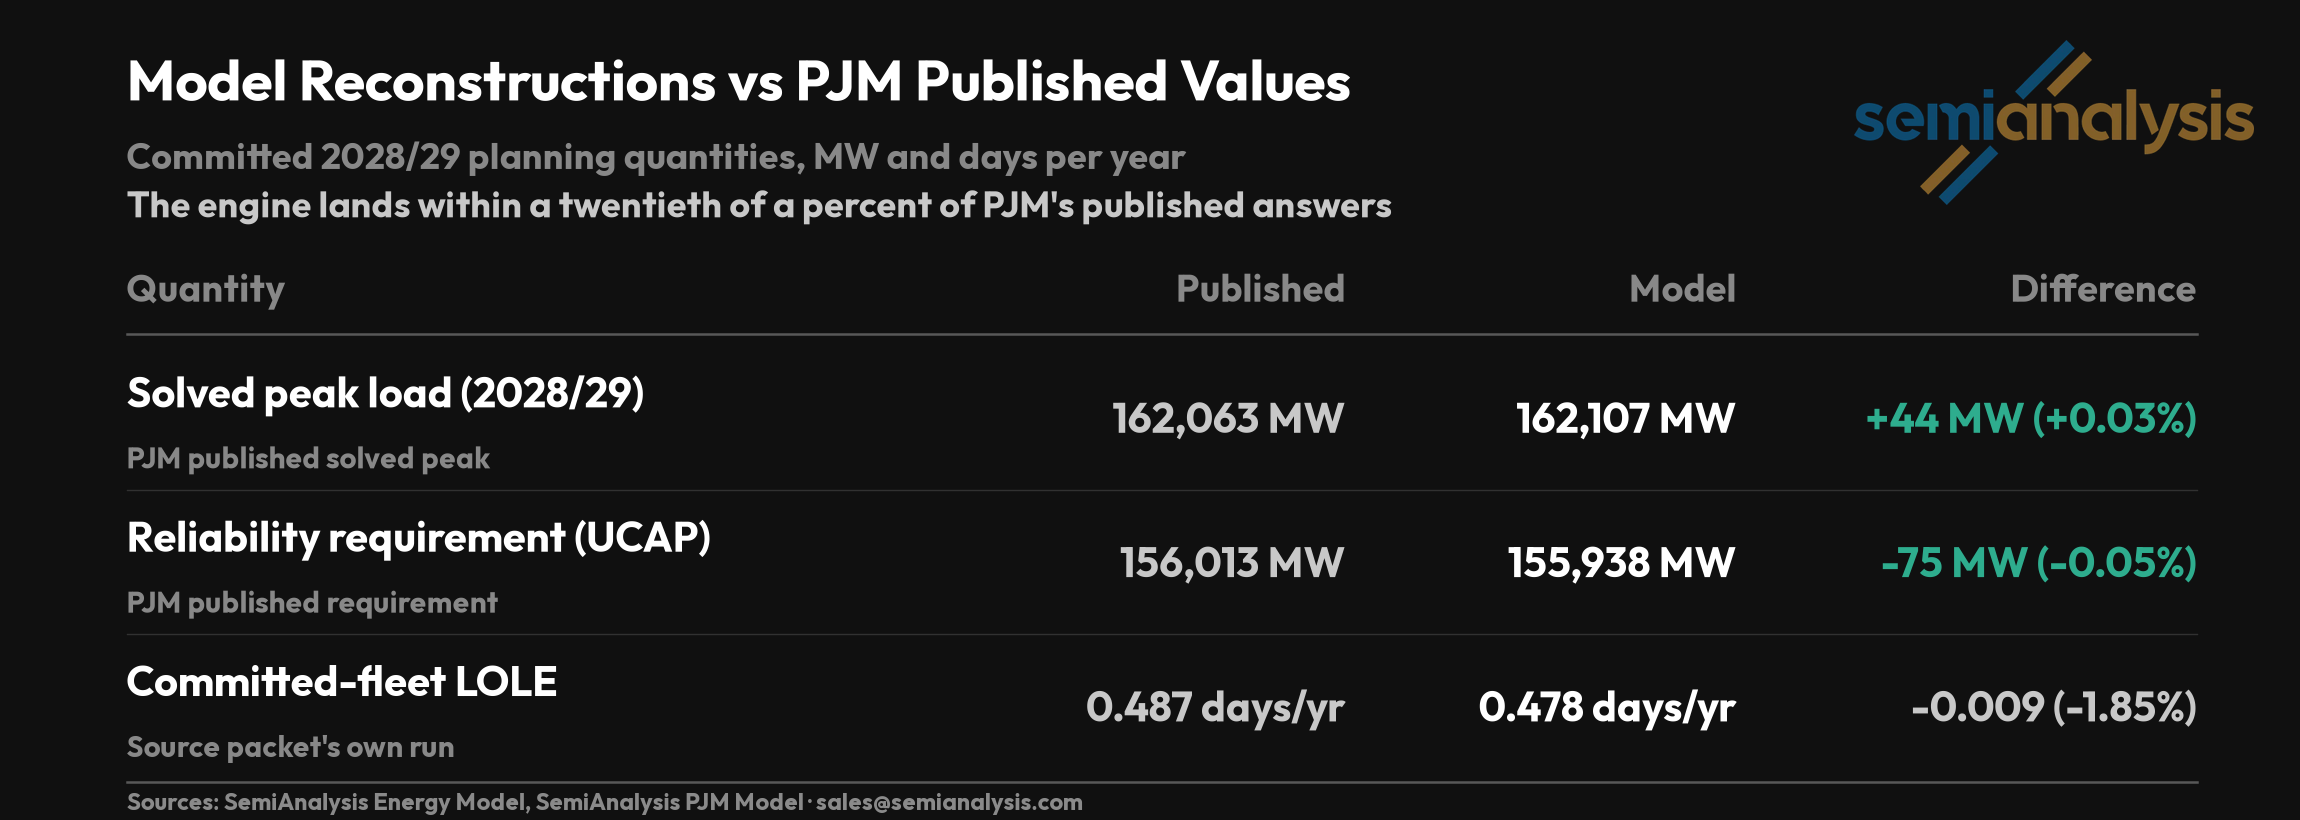
To get the real numbers we needed to rebuild the model in full. So we took PJM’s Manual, which explains how they do this study and turned it into code. Then we ran on that code the weather, demand, and generation data that they publish. For data that they do not give we used publicly available proxies, mainly from the U.S. Energy Information Administration. We got a high level of accuracy to the outputs that PJM publishes across the last four auctions. The detailed step by step is included in the Methodology Annex of this newsletter to help subscribers who wishes to recreate or audit our work.
Improving the model
In the auction for 2026/27, cold air uplift alone should have reduced the required capacity by 1.5GW and weatherization alone 2.5GW at only 60%. Together they would have been worth 3.1GW as there is a significant overlap between their effects.
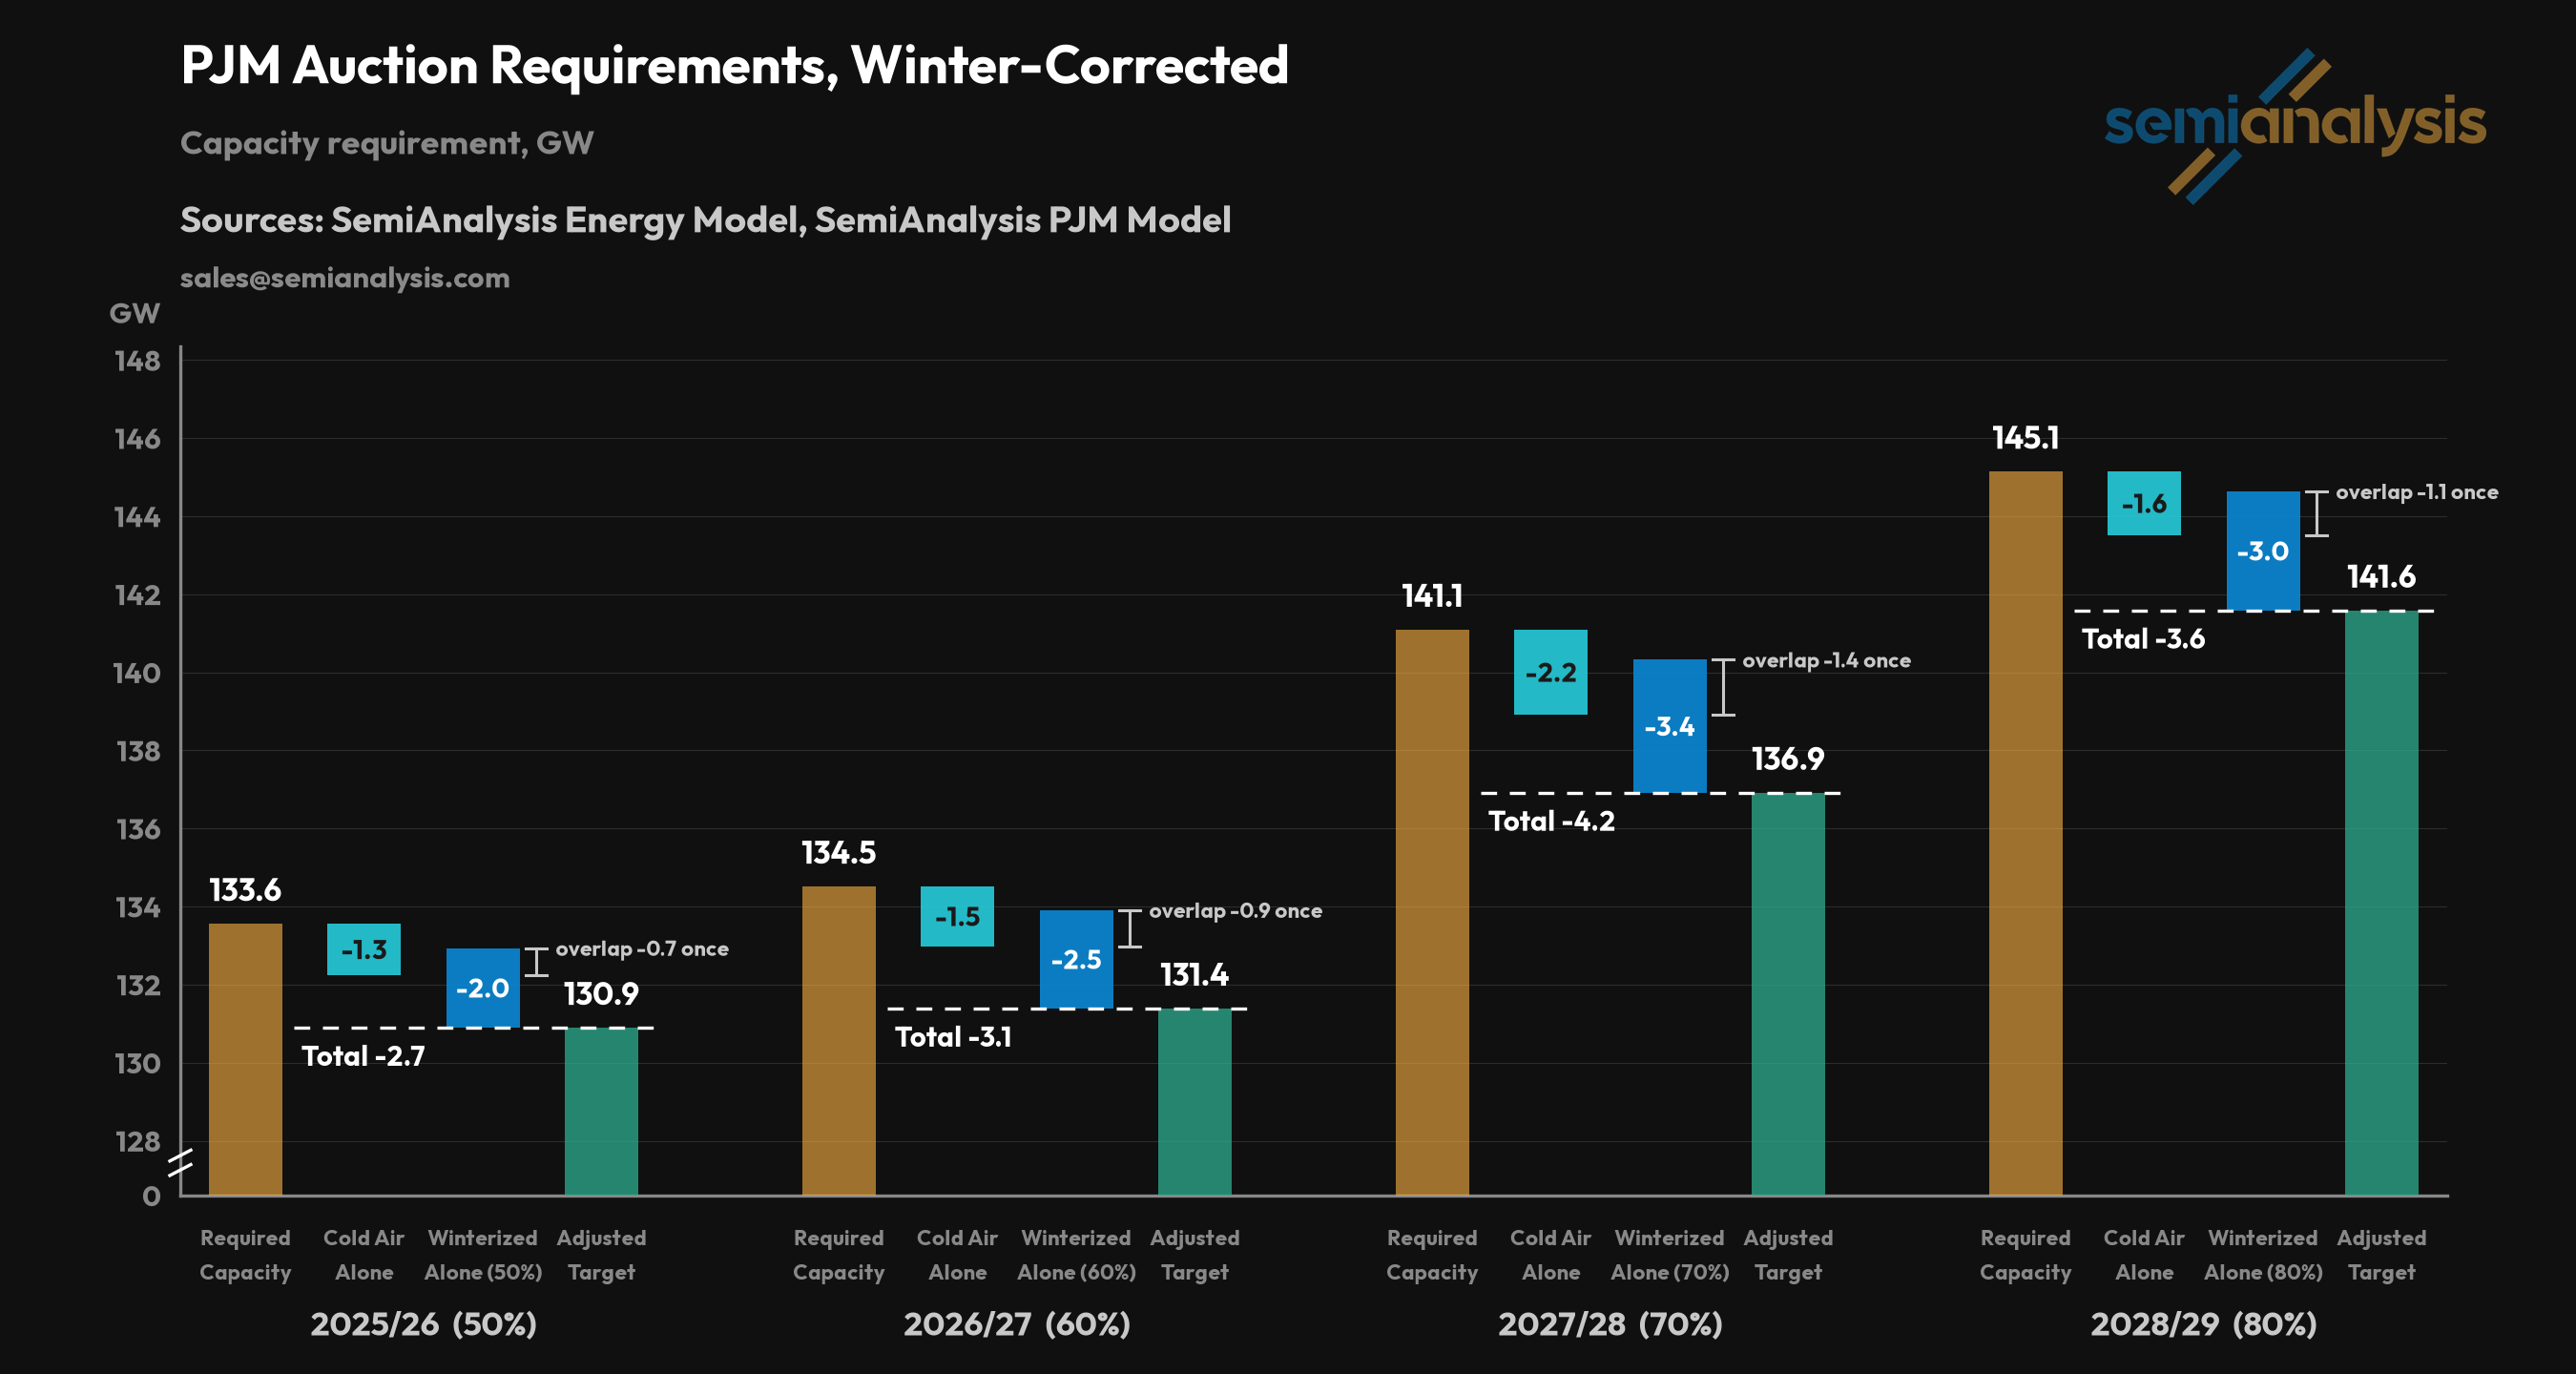
We calculated this by using our reconstructed Reserve Requirement Study to test how much the outputs would change if we altered two input assumptions that have been widely debated and previously proposed: crediting cold air uplift and asset winterization. Again, the detailed steps are in the Methodology Annex.
Crediting Cold Air Uplift
A turbine is a mass-flow machine, cold air is denser, so turbines can squeeze more electricity out when temperatures drop. If you ignore ways that a system is more efficient in winter, but still recognize winter failure risk then you double count the risk and buy too many power plants.
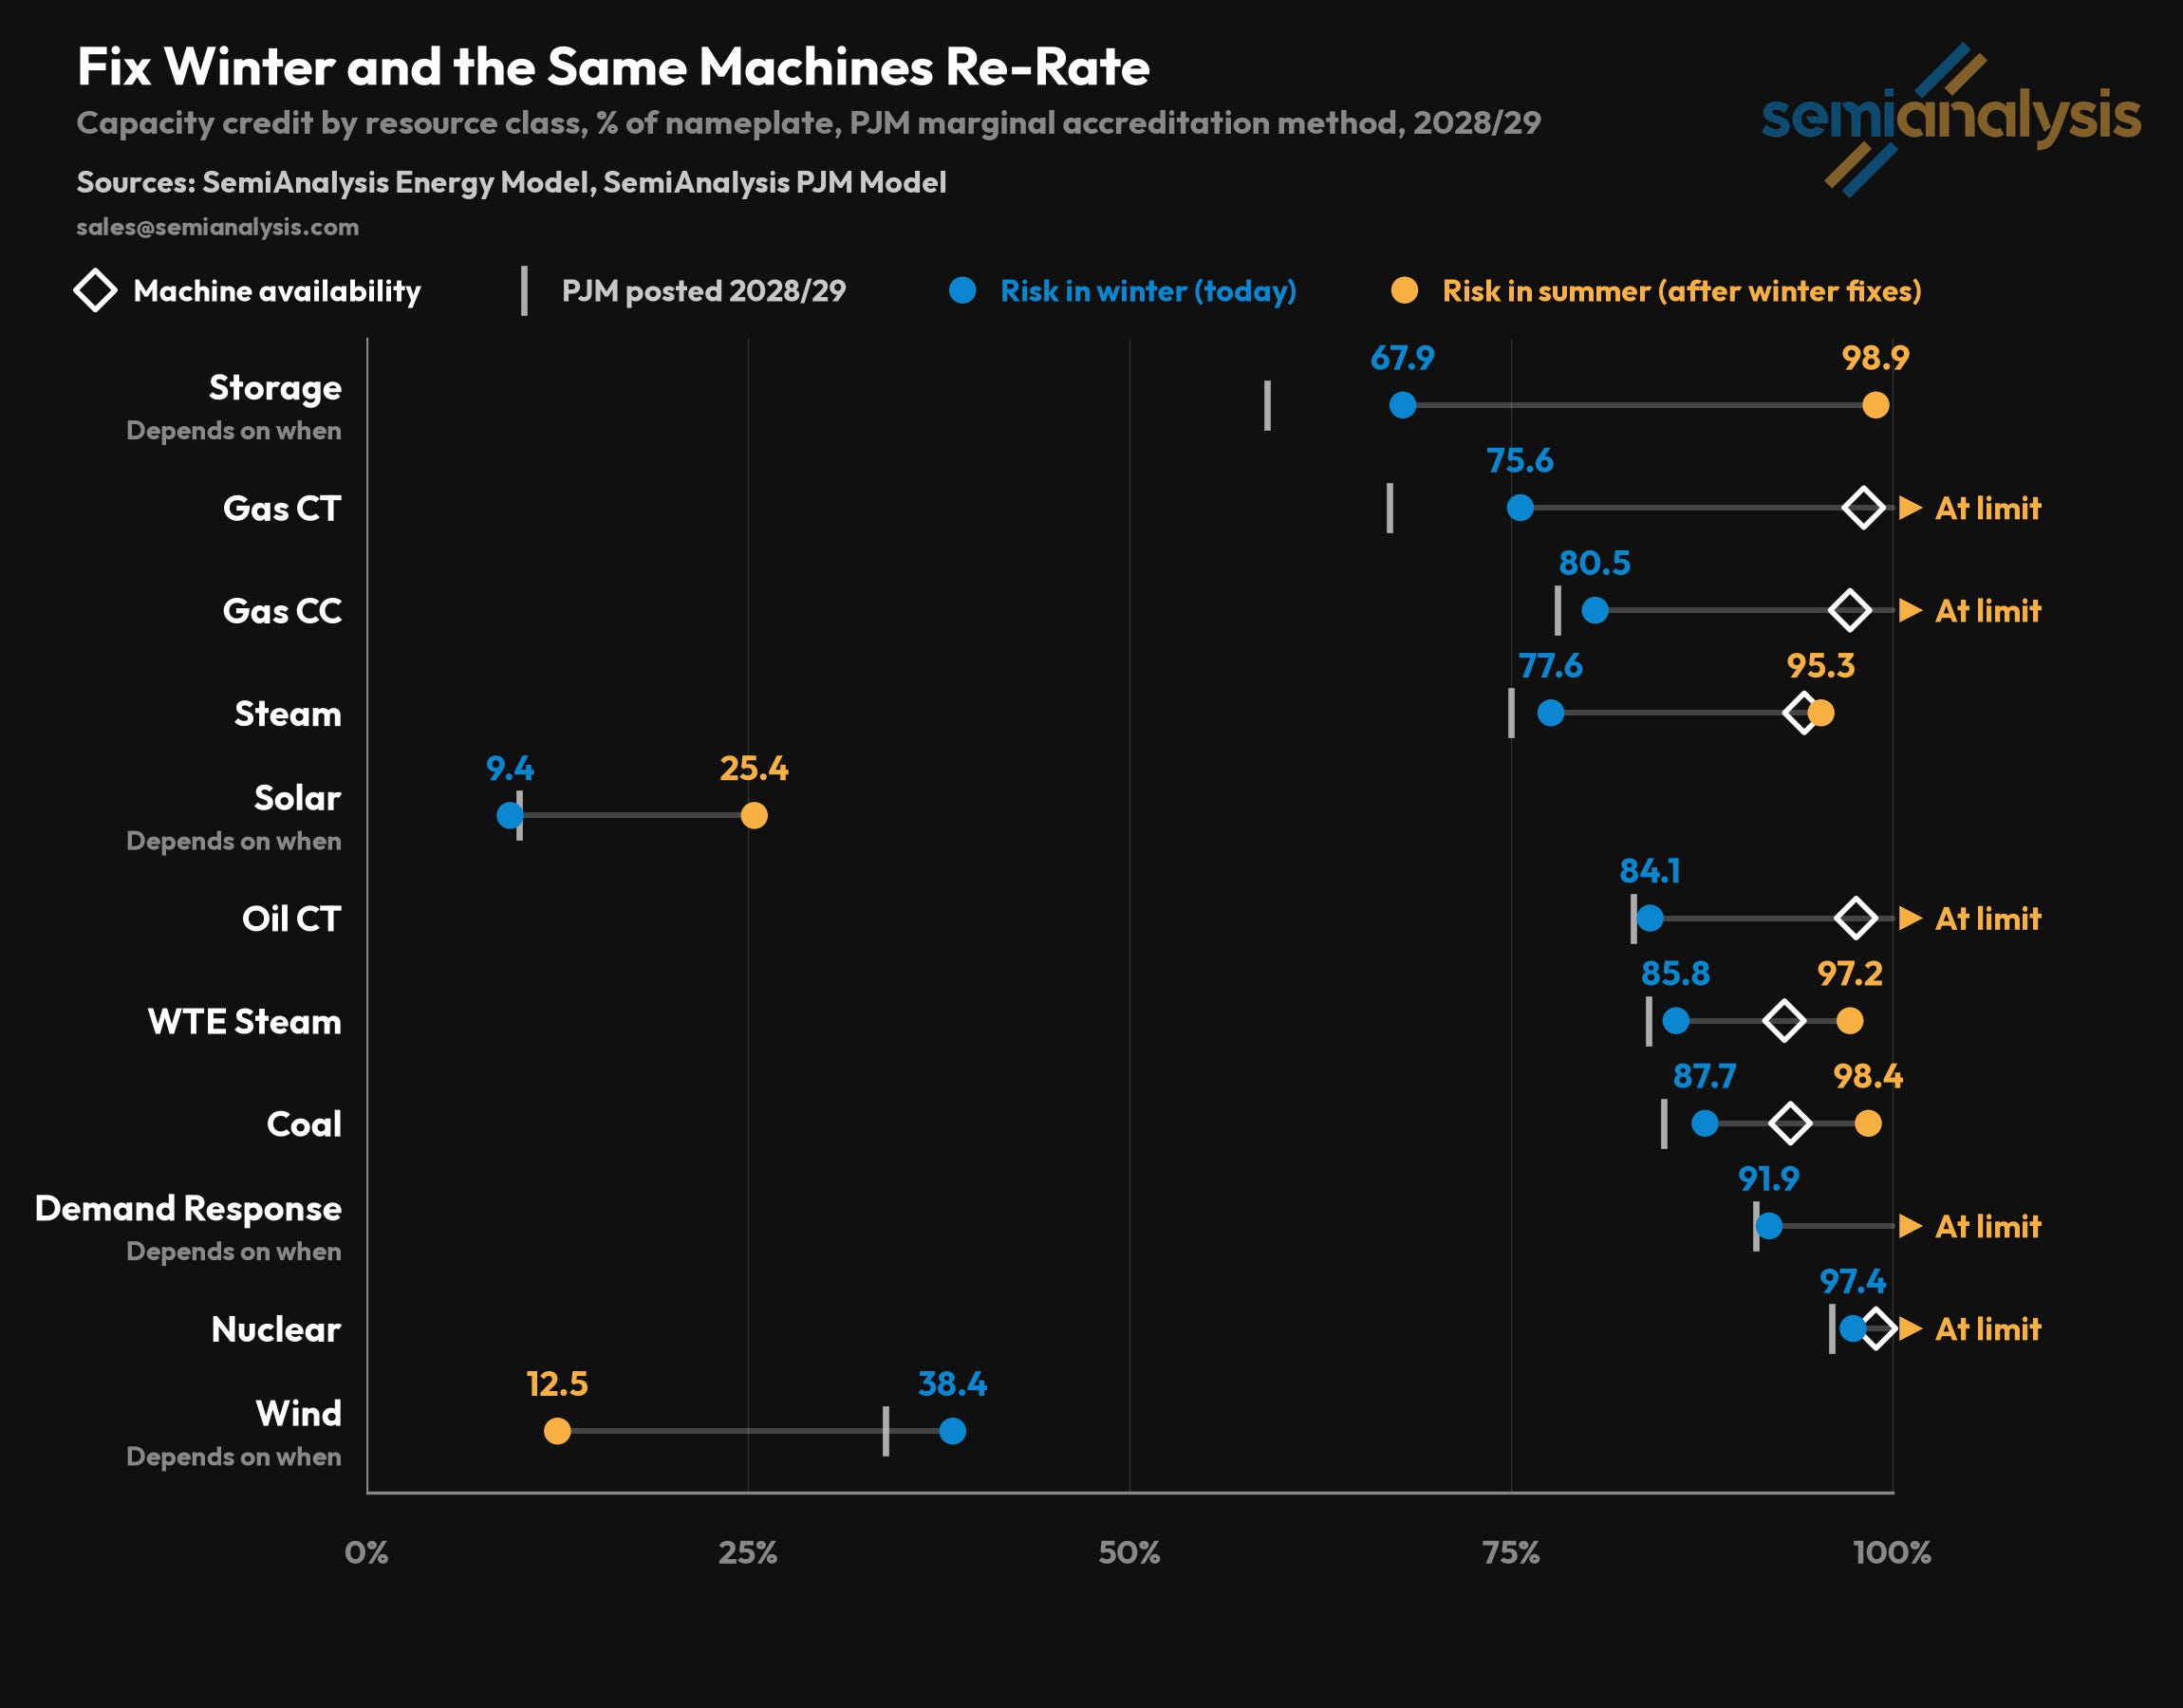
PJM’s modeling does not recognize that cold weather makes thermal plants more efficient, and increases the available capacity on the grid during cold periods. Cold temperatures make the air denser and improve temperature gradients, which improves turbine flow and increases the peak electricity output of a unit. For combustion turbines, this impact is as high as 25%, and PJM’s class table averages 8.4% for turbines over the winter months. While gas plants are more likely to come offline in the winter, their fellow gas plants are better able to produce more power to make up for it. Steam plants also benefit from colder cooling water which lowers condenser pressure, improving cycle efficiency. Instead these plants are modeled as if it were the summer months.
Crediting cold air counterbalances the greater breakdown risk. Our model runs these two dynamics side-by-side hour-by-hour. It keeps PJM’s winter breakdown rates exactly as PJM sets them, and credits extra output per thermal plant running in each simulated hour. Netted over 41,600 simulated years, crediting cold air alone, with PJM’s failure rates untouched, still cuts the capacity requirement by 1.3 to 2.2GW depending on the year.
PJM was already told they were modeling this wrong. E3, the consultant PJM hired to review its methodology, highlighted the bias in its December 2025 evaluation: “PJM asymmetrically applies ambient derates to the ICAP of unlimited resource classes when temperatures rise but does not apply ambient uprates when temperatures fall.” PJM’s own May 2025 sensitivity tested crediting it in the model which resulted in 33 percent less winter loss of load hours and a 1.1 percentage point lower reserve margin against the 2026/27 auction model. E3’s consideration 4 of 14 was to adopt seasonal or daily capability ratings.
PJM measured winter capability uplift as 8.5GW nameplate. Despite this massive impact (worth at least $13B in new gas plants at a conservative $1500/kW), PJM did not implement this adjustment despite having all the core information. One of the primary reasons is that they would have to run deliverability studies to determine if the additional capacity could serve the whole system. To our knowledge, PJM never ran these studies. It is worth noting that the likelihood of deliverability is high. In stressed circumstances, a large portion of the otherwise deliverable fleet would be offline, and the cold also improves the thermal capacity of all grid components (including conductors, substations, and breakers). Using the summertime capacity ratings for wintertime thermal production is physically inaccurate, but due to stakeholder disagreement (detailed in Package C of the ELCC taskforce), proposed reforms to implement this basic change did not pass.
Our modeling methodology is in the annex.
Updating Risk with Asset Winterization
PJM does not properly credit power plants that invest in hardening themselves against extreme events. This means it underestimated winter risk before Storm Elliott and could now overestimate the risk of their newly winterized fleet. This lack of accuracy and forecasting drives up the cost of electricity. Crediting weatherization alone for the 2026/27 auction would have been worth up to 3GW of reliable power.
Crediting winterization and other forms of resilience investment would be a strong financial incentive for plants to invest as they would then earn more in capacity auctions. Instead PJM establishes plant failure rates based on past performance, and the large collapses of the gas fleet during the Polar Vortex and more recently during Winter Storm Elliott play an outsized role in reducing the capacity value which PJM credits to gas plants. For increased statistical heft PJM uses as many historical weather years as possible. But once there is a big miss only time and good performance can slowly return this to baseline. A painstaking process of asymptotic averages. Even if gas plants invested billions in weatherization or demonstrated extraordinary resilience during a similar event.
Plants fail because components freeze: instrumentation and sensing lines, valves, fuel handling. During Winter Storm Elliott (December 2022), PJM saw 46GW of coincident outages. The FERC/NERC joint inquiry (October 2023) found that at least 75% of freezing-caused failures occurred at temperatures above the units’ documented operating limits. Which means a properly winterized unit would not have failed.
By the winter beginning November 2025, the existing fleet was winterized substantially more than PJM’s model assumes. Mandatory cold-weather preparedness plans, annual training for every unit, and reporting of each unit’s cold-weather operating limits were mandated by April 2023. By January 2024, more than 400 generators had reported winterization improvements to PJM, a figure PJM published in its own review of Storm Gerri. PJM has roughly 450 gas units and about 750 thermal units in total, so that is the majority of the relevant units. The reports are self-made but they were filed under a regime that already required every unit to hold a cold-weather plan, and they came nearly two years before the auction’s winter we are modeling. A legally required calculation of every unit’s extreme cold weather temperature was due by October 2024. The event-CAP rule was enforceable from October 2024; any unit that froze during winter 2024/25 owed a completed corrective plan before December 2025. In addition, binding NERC winterization standards ramp through 2027, although this had no impact on recent auctions that target years after it goes into effect.
There is evidence of winterization in the fleet’s recent performance. Gerri (January 2024) had a peak of 16GW or 9% in forced outages against Elliott’s 46GW. The MLK storm (January 2025) also had a 9% forced-outage rate against Elliott’s 24%, on similar weather over a holiday weekend, while serving an all-time winter peak. Storm Fern (January 2026) had outages of 18-19GW or 10%. During each of the cold events since Storm Elliott, PJM’s fleet has behaved like one substantially winterized. MLK in January 2025 with Elliott-like weather showed no excess clustering at all.
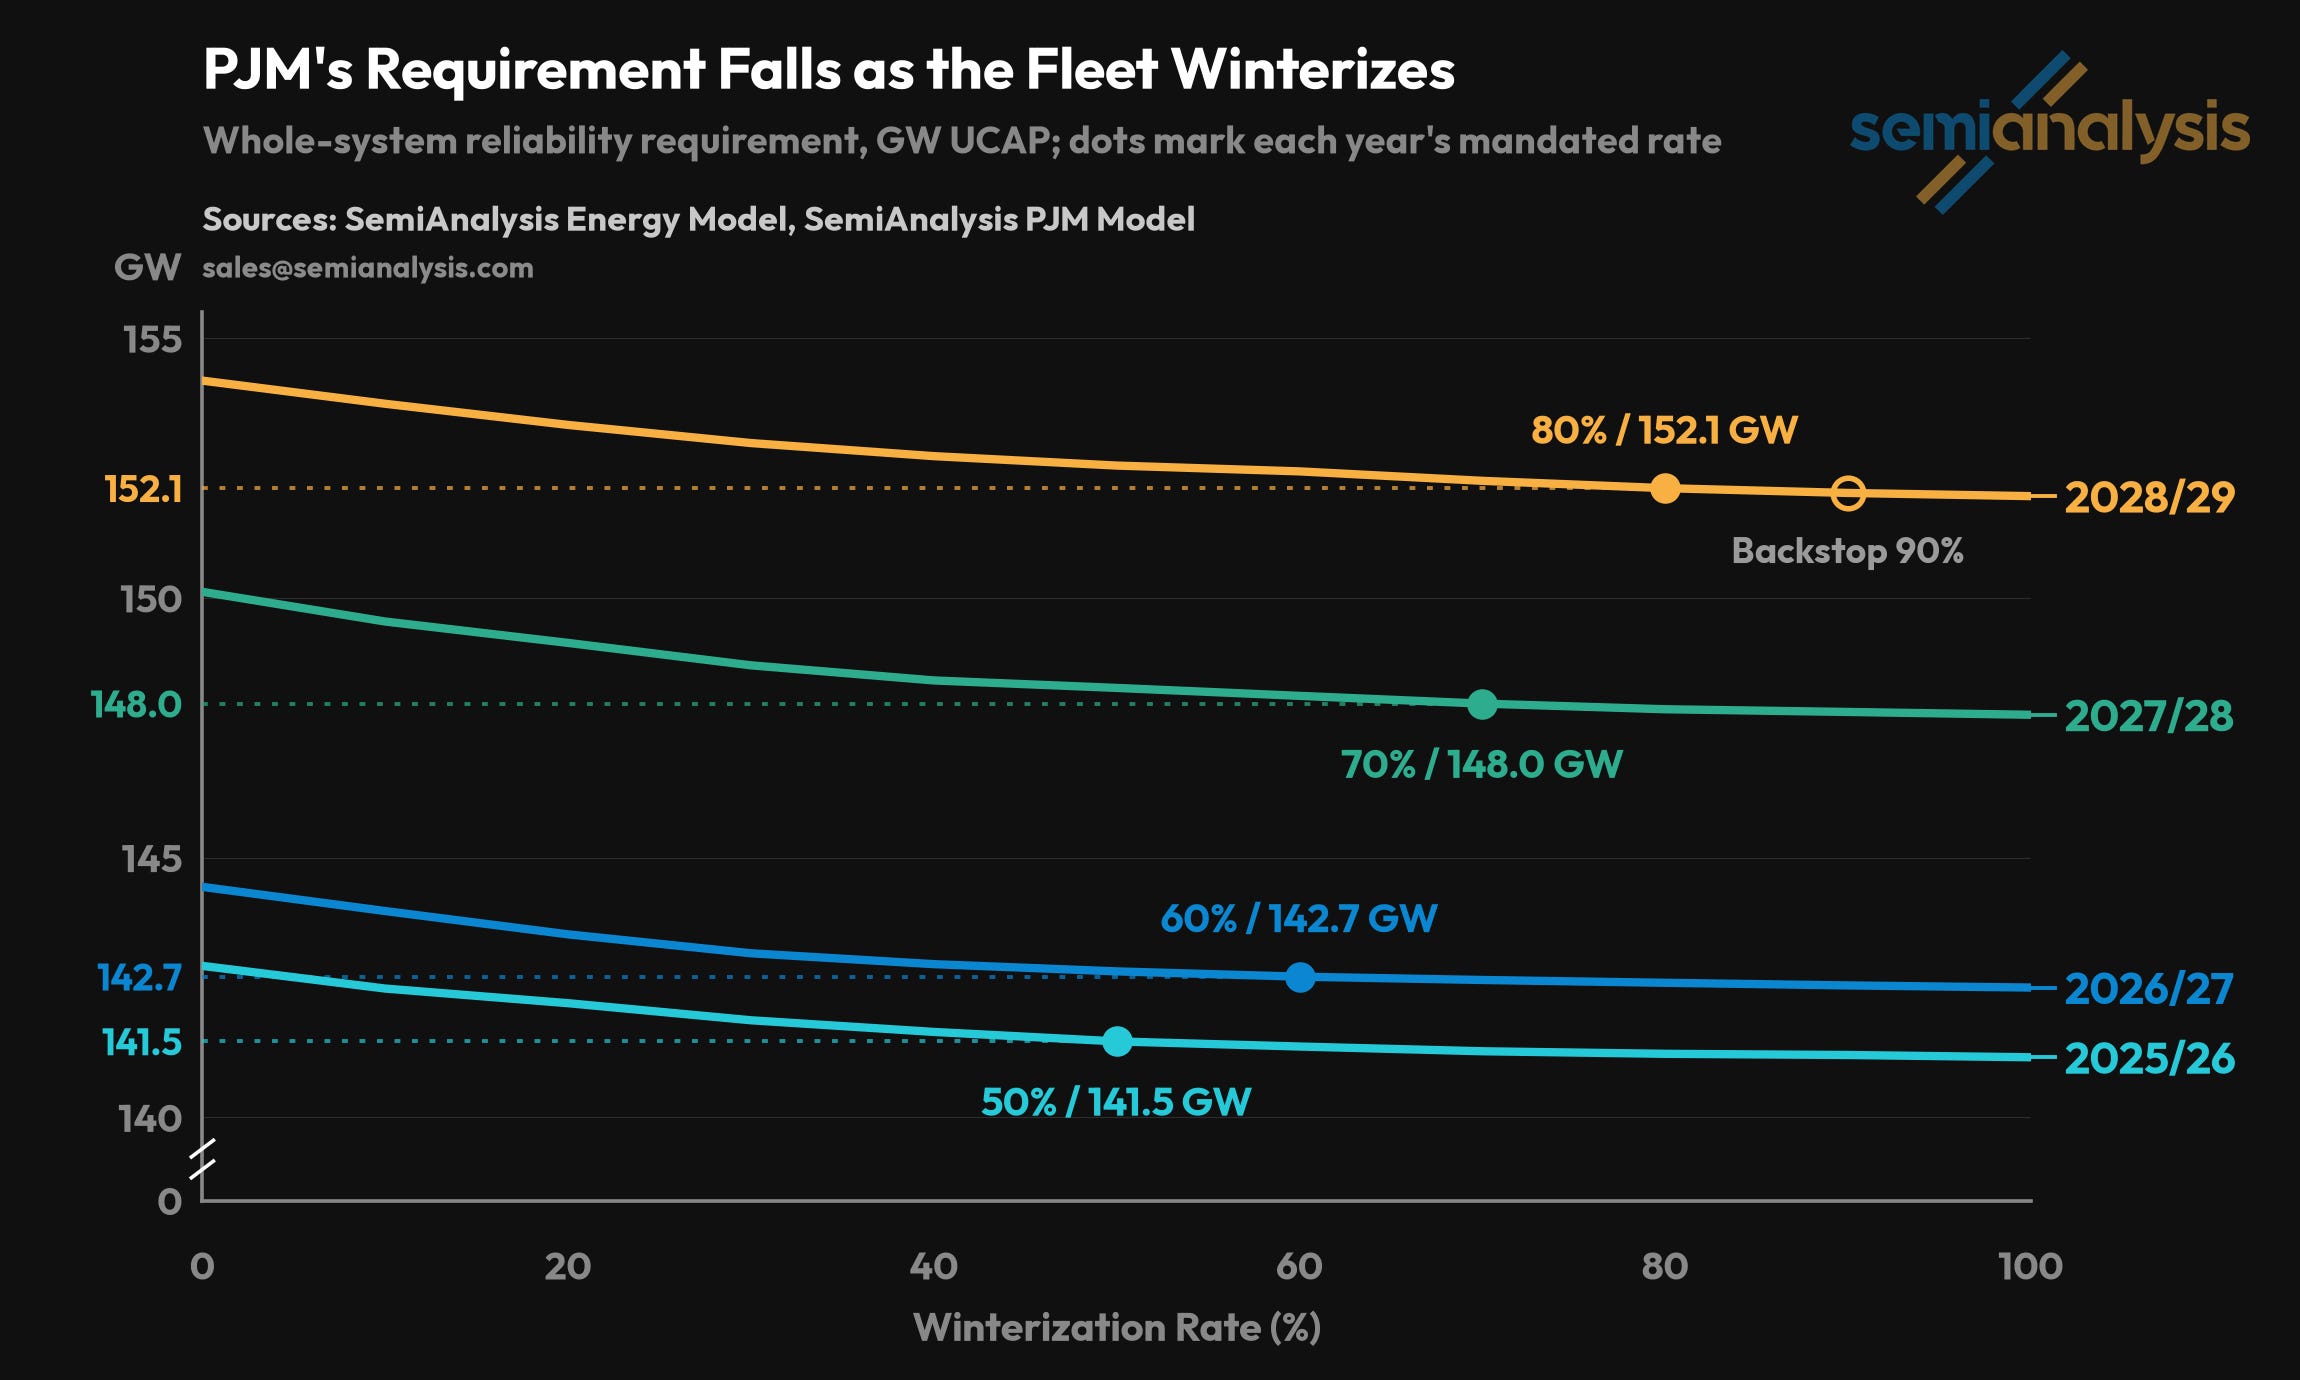
Specific methodology is in the annex but the key point is that the winterization lever does not assume plants fail less often. It preserves each class’s annual average failure rate exactly and removes only the weather clustering. A genuinely winterized fleet would also fail less on average. We do not include credit for that. To be highly conservative we assume a 50% winterization for 2025/26 then step it up by 10% each year from there.
Overlap
The outcomes of these two modeling changes have significant overlap, so together they are less than the sum of their parts. This is because they fix the same hours. PJM’s requirement is set by a handful of deep-cold hours in which the system might run short. In 2026/27, cold air alone is worth 1,535 MW of requirement relief on the auction’s scale and weatherization alone set to 100% is worth 3,143 MW, but together they are worth 3,320 MW, not 4,678. In the overlap winterization (when set to 100%) particularly dominates cold air’s effect, covering up to 76-96% depending on the year. At lower settings the overlap is reduced. For the annual settings we have chosen the overlap range becomes 53-69% depending on the year.
2. PJM has overspent by ~$12 billion
The result of these improvements to the model inputs is that PJM has a more reliable fleet than its Reserve Requirement Study currently recognizes. So relative to modeled demand load it needed to procure less capacity than it has done for the last four years. In the two auctions where the price was free to move (2025/26 and 2026/27) that difference was worth $12B.
Auction Design
Auction design is much harder to reform than modeling methodology. But you need to understand the design in order to see that relatively small shortfalls in modeled capacity can have outsized impacts on auction costs. PJM has two markets: one for energy which is in real time and one for capacity which is on an annual basis. A capacity contract pays a plant for being available, not for making energy. PJM interconnection queue is famously slow and long, but power plants applying joining the queue do so at their own risk, plants joining the capacity market are the ratepayers’ risk.
Two costs matter in any power market: what it costs to run a plant for another hour, and what it cost to build and keep the plant at all. The first short-run marginal cost and the second long-run marginal cost. The daily energy market clears at the short-run marginal cost (fuel, labor, variable maintenance) of the last needed producer. This incentivizes bidding true cost rather than gaming the system as any more than that would risk not being dispatched and so earning nothing. The difference between the short-run and the long-run marginal cost (capital, assets, fixed maintenance) creates a “missing money” problem as power plants struggle to make this back in the daily energy market. Some electricity grids, most famously ERCOT in Texas, only have an energy market. Power plants make that missing money by putting prices really high when supply is scarce. But many markets use a capacity auction to provide this missing money, considering it the more stable approach. PJM’s annual capacity auction also pays all bidders the price of the last needed capacity.
Every year PJM’s planning model (the Reserve Requirement Study, RRS) decides how much reliable power keeps shortfalls to one event in ten years (the 0.1 Loss of Load Expectation, LOLE). Because risks are spread out everyone in the market tries to free-ride on everyone else which means power capacity has no natural buyer. PJM acts as the insurance intermediary. It draws a market demand curve, a sliding schedule of what price it will pay at each level of supply (the Variable Resource Requirement, VRR). The yearly auction in which generation bids and PJM buys against that curve is the Base Residual Auction (BRA).
Unfortunately, PJM runs one capacity auction that includes ~92-93% of fleet capacity, both existing generators and new generators. Most of the rest is covered by self-supplied utilities. This is a problem as these are substantially different products, new generators have much larger long-run marginal costs. Existing generators only need to cover their annual fixed costs, the Independent Market Monitor’s offer data shows most bids at $8-14/MW-day. New generators have substantial risk-related costs and much greater initial fixed costs. New and existing plants also receive the same one-year contract, even though a new plant normally needs a long-term contract with which to raise financing cost-effectively. This auction design means that if there is electricity demand growth which requires new plants to be built then prices will need to increase by a lot compared to the baseline. In PJM’s case the whole fleet’s price went from $28.92 to $270-333 per megawatt-day, roughly 20 to 40 times the $8-14 the existing plants themselves were offering. This creates huge windfalls to existing generators without necessarily increasing generation capacity on the system in an effective manner.
Happy to be corrected, but we believe PJM is also unique in the world for how much of its fleet is put through the same marginal-priced auction. 93% of PJM capacity settles at the clearing price, against 15% in MISO’s residual auction, monthly rolling in New York, bilateral contracts in California, none in Texas, and New England just abandoned the design entirely. MISO also had a sharp auction price swing, but its auction is residual and utilities self-supply or contract for most capacity beforehand. Therefore about 86% of its 2025/26 summer requirement was met outside the auction, leaving most load protected against the swing. Great Britain, Ireland, Italy, and Japan run centralized auctions, but give qualifying new plants contracts of 10 or 20 years while existing plants generally receive one year.
All of these markets make customers pay for growth. But the same growth in those markets would not drive the repricing of nearly the entire fleet as it did in PJM. That cost shift is a product of market design rather than inherent to load growth. Reform is coming, and datacenter developers have largely supported reforms to pay for capacity as it is in their interests for growth to happen painlessly. However, currently no proposals provide any respite for ratepayers who are still paying for design choices made two decades ago.
This design is not without its reasons. For over 20 years, PJM has not experienced any load growth, and benefited from an early gas boom by Independent Power Producers that proved disastrous for early investors. Over that time less efficient plants have been pushed off the system by more efficient ones, in many ways a good system, just not one built for growth.
The Wasted $12B
For the four most recent auctions we have calculated what price and volume the auctions would have cleared at if the Reserve Requirement Study had been more accurate. That modeling improvement shifts the demand curve to the left. We find that the auctions for 2025/26 and for 2026/27 would have seen savings of $11.57 billion, with a sensitivity range between $8.0 billion and $14.5 billion combined while procuring more than the reliability requirement. The auctions for 2027/28 and 2028/29 would not have cleared at a lower price or volume because supply was tight enough that the price cap for those years still binds, even under improved modeling.
The capacity auction price is set where the supply curve crosses PJM’s demand curve (VRR). The demand curve is a published price schedule stating what PJM will pay at each level of supply. The supply curve is made up of all the bids into the market; PJM and its market monitor publish the shape with key data points. We have reconstructed these curves for each of the four auctions.
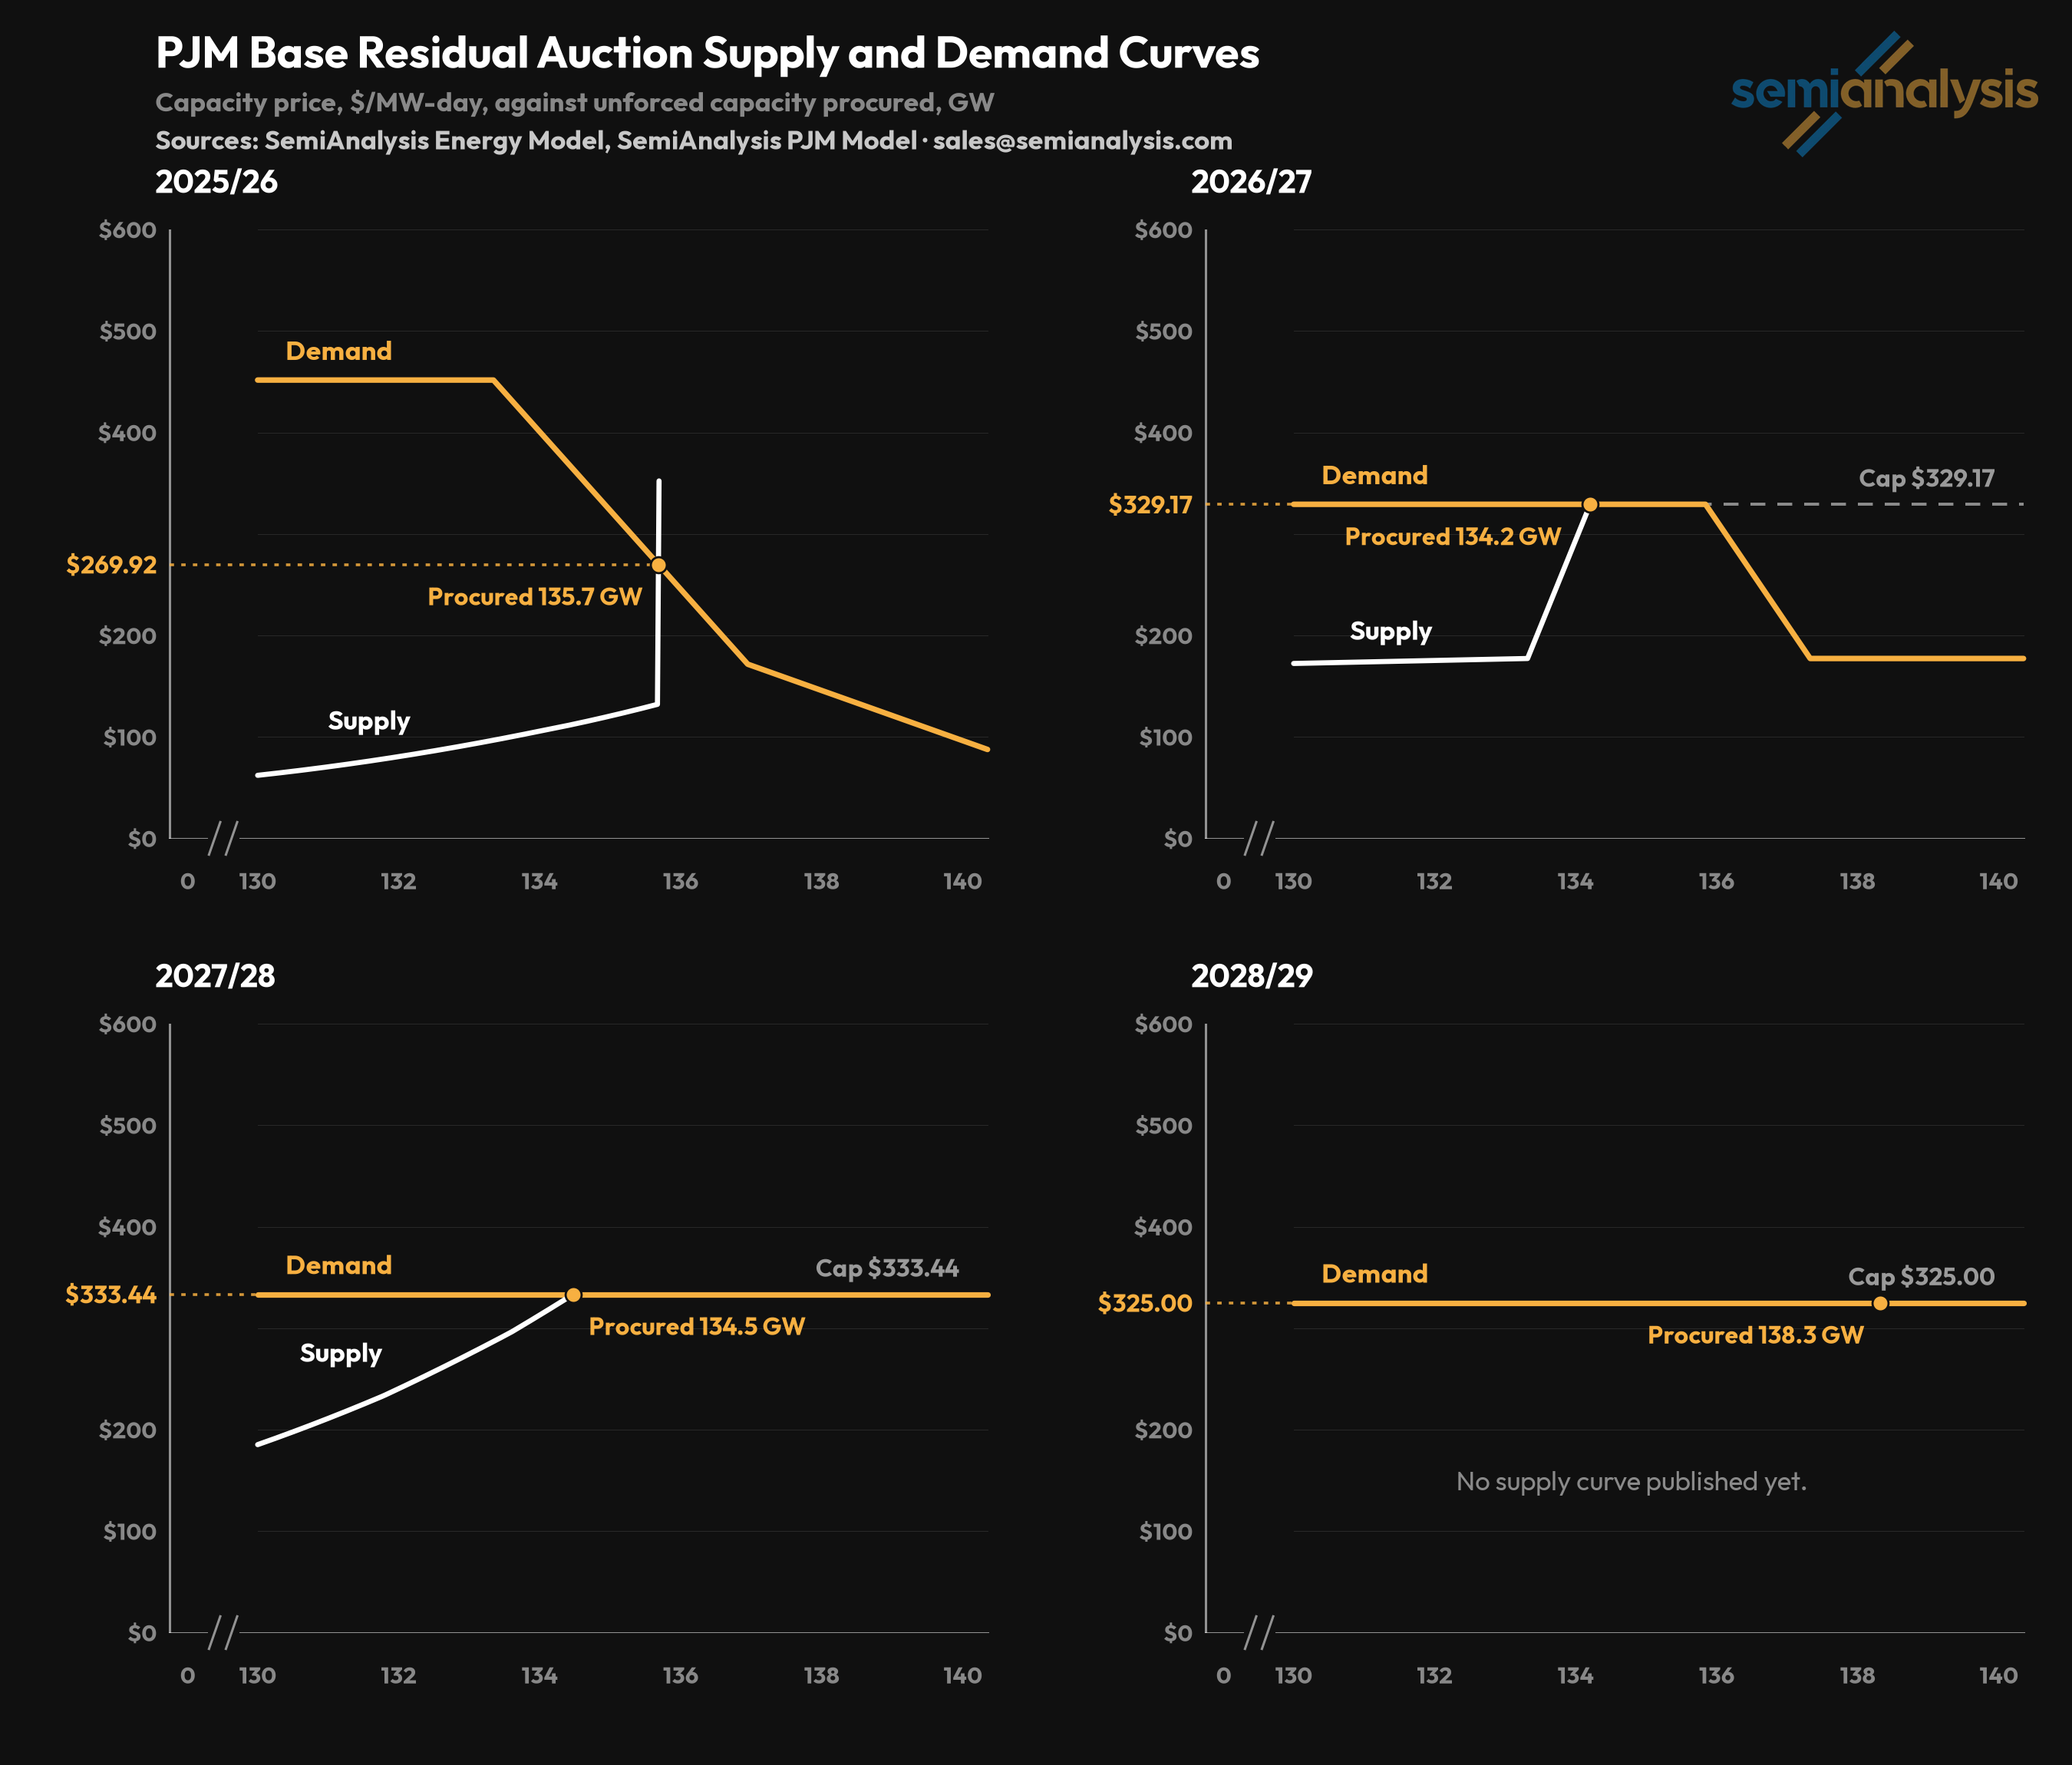
We then used our reverse-engineered Reserve Requirement Study to calculate how the curves move with improved inputs to incorporate cold air and asset winterization. Given the greater reliability of the existing fleet the need to procure a greater margin of supply over the electricity demand is reduced. This shifts the demand curve for capacity (VRR) to the left. We computed this by year given different inputs and concluded that for a 0.1 LOLE, whole-system reliable capacity requirements fall by: 2,879 MW (2025/26), 3,396 (2026/27), 4,513 (2027/28), 3,824 (2028/29). We have to assume that bids do not change as modeling bid behavior is complex, in reality there would be some change but we do not think it would be material in this context.
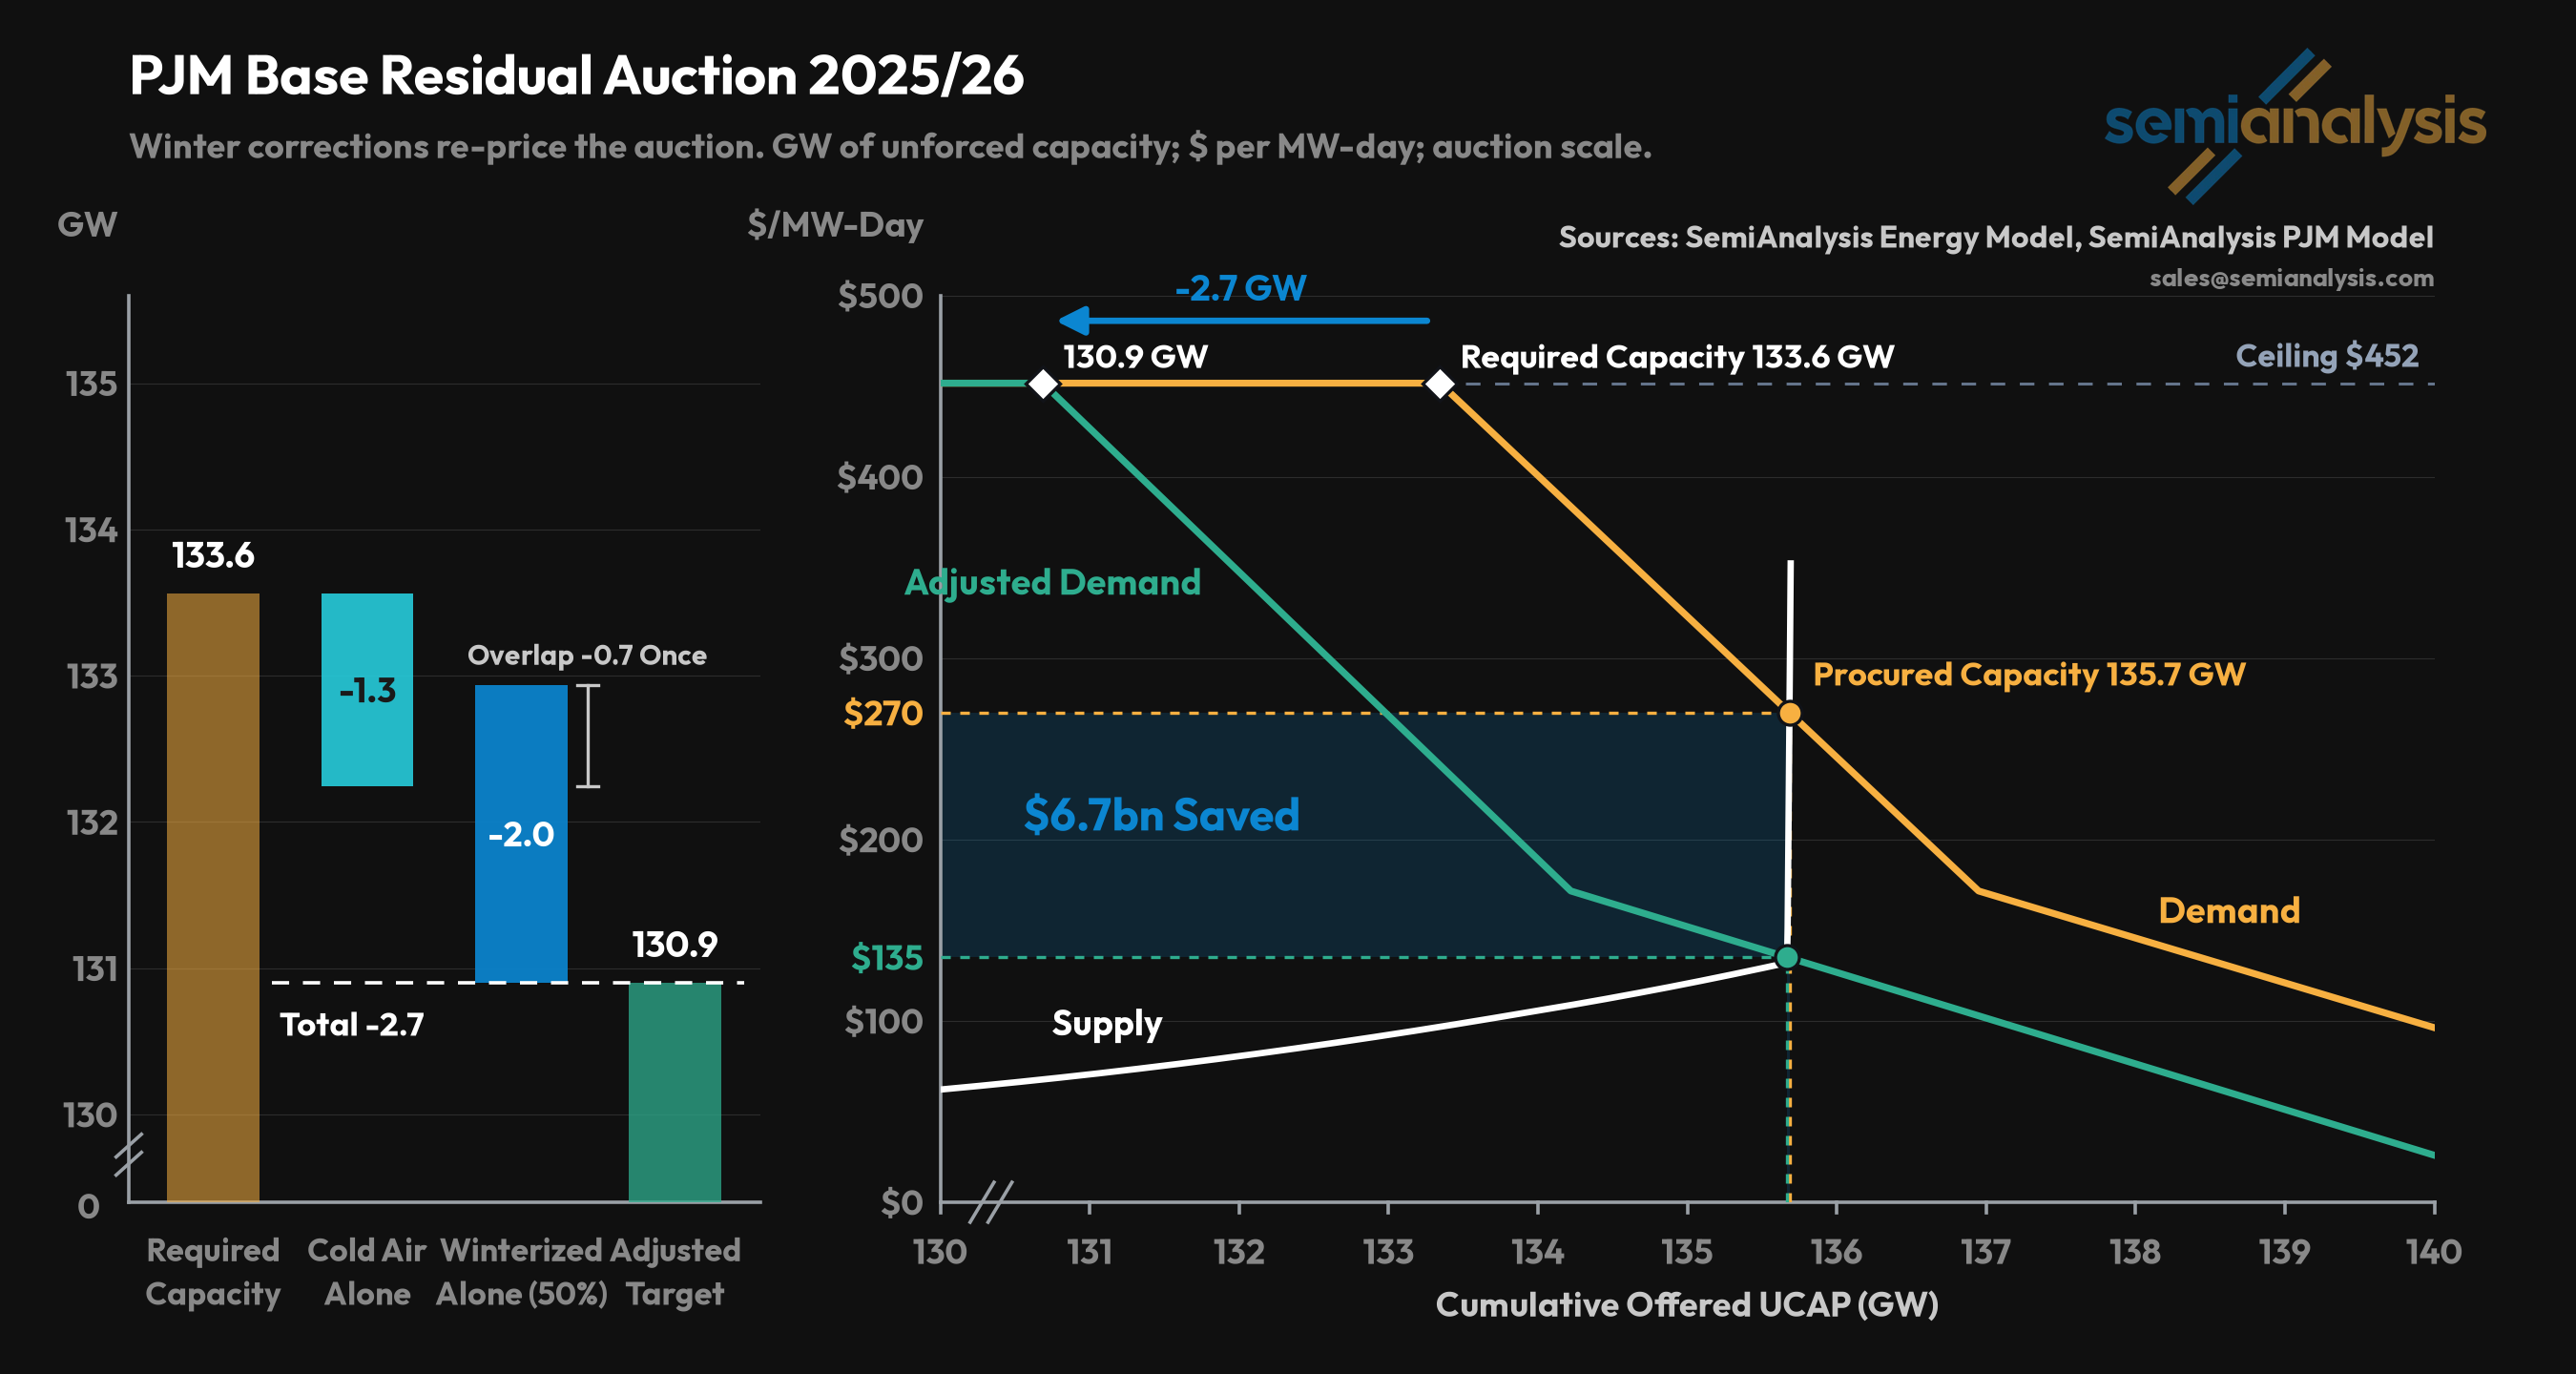
PJM’s capacity market has a right-angled supply curve. The vast majority of it is low and flat, then some steady increase, before right at the end it spikes straight up. For example the 2025/26 auction had the first 79% of the bids between $2-5, the next 20% rose until they peaked at $105, and it was only the last 1% that went as high as $352, with the market clearing at $270. This is reflecting that most of the power plants in PJM have existed for a while and bid low as they have little difference between their short-run and long-run marginal costs. But then new power plants bid high to be able to afford to be built quickly and to cover their own risk. The shape of PJM’s supply curves is why, if you are at their limit, a small change in quantity demanded has a huge impact on price and on total cost, even when having a small impact on volume procured.
The Base Residual Auctions do not stop at their required capacity, they clear on their demand curve. So if there is more capacity that can be bought at a price that PJM has decided is acceptable then it clears the auction. For the 2025/26 auction PJM’s ceiling price was $452 and enough bids came in that 135.7GW was procured for $270 against a required capacity of 133.6GW.
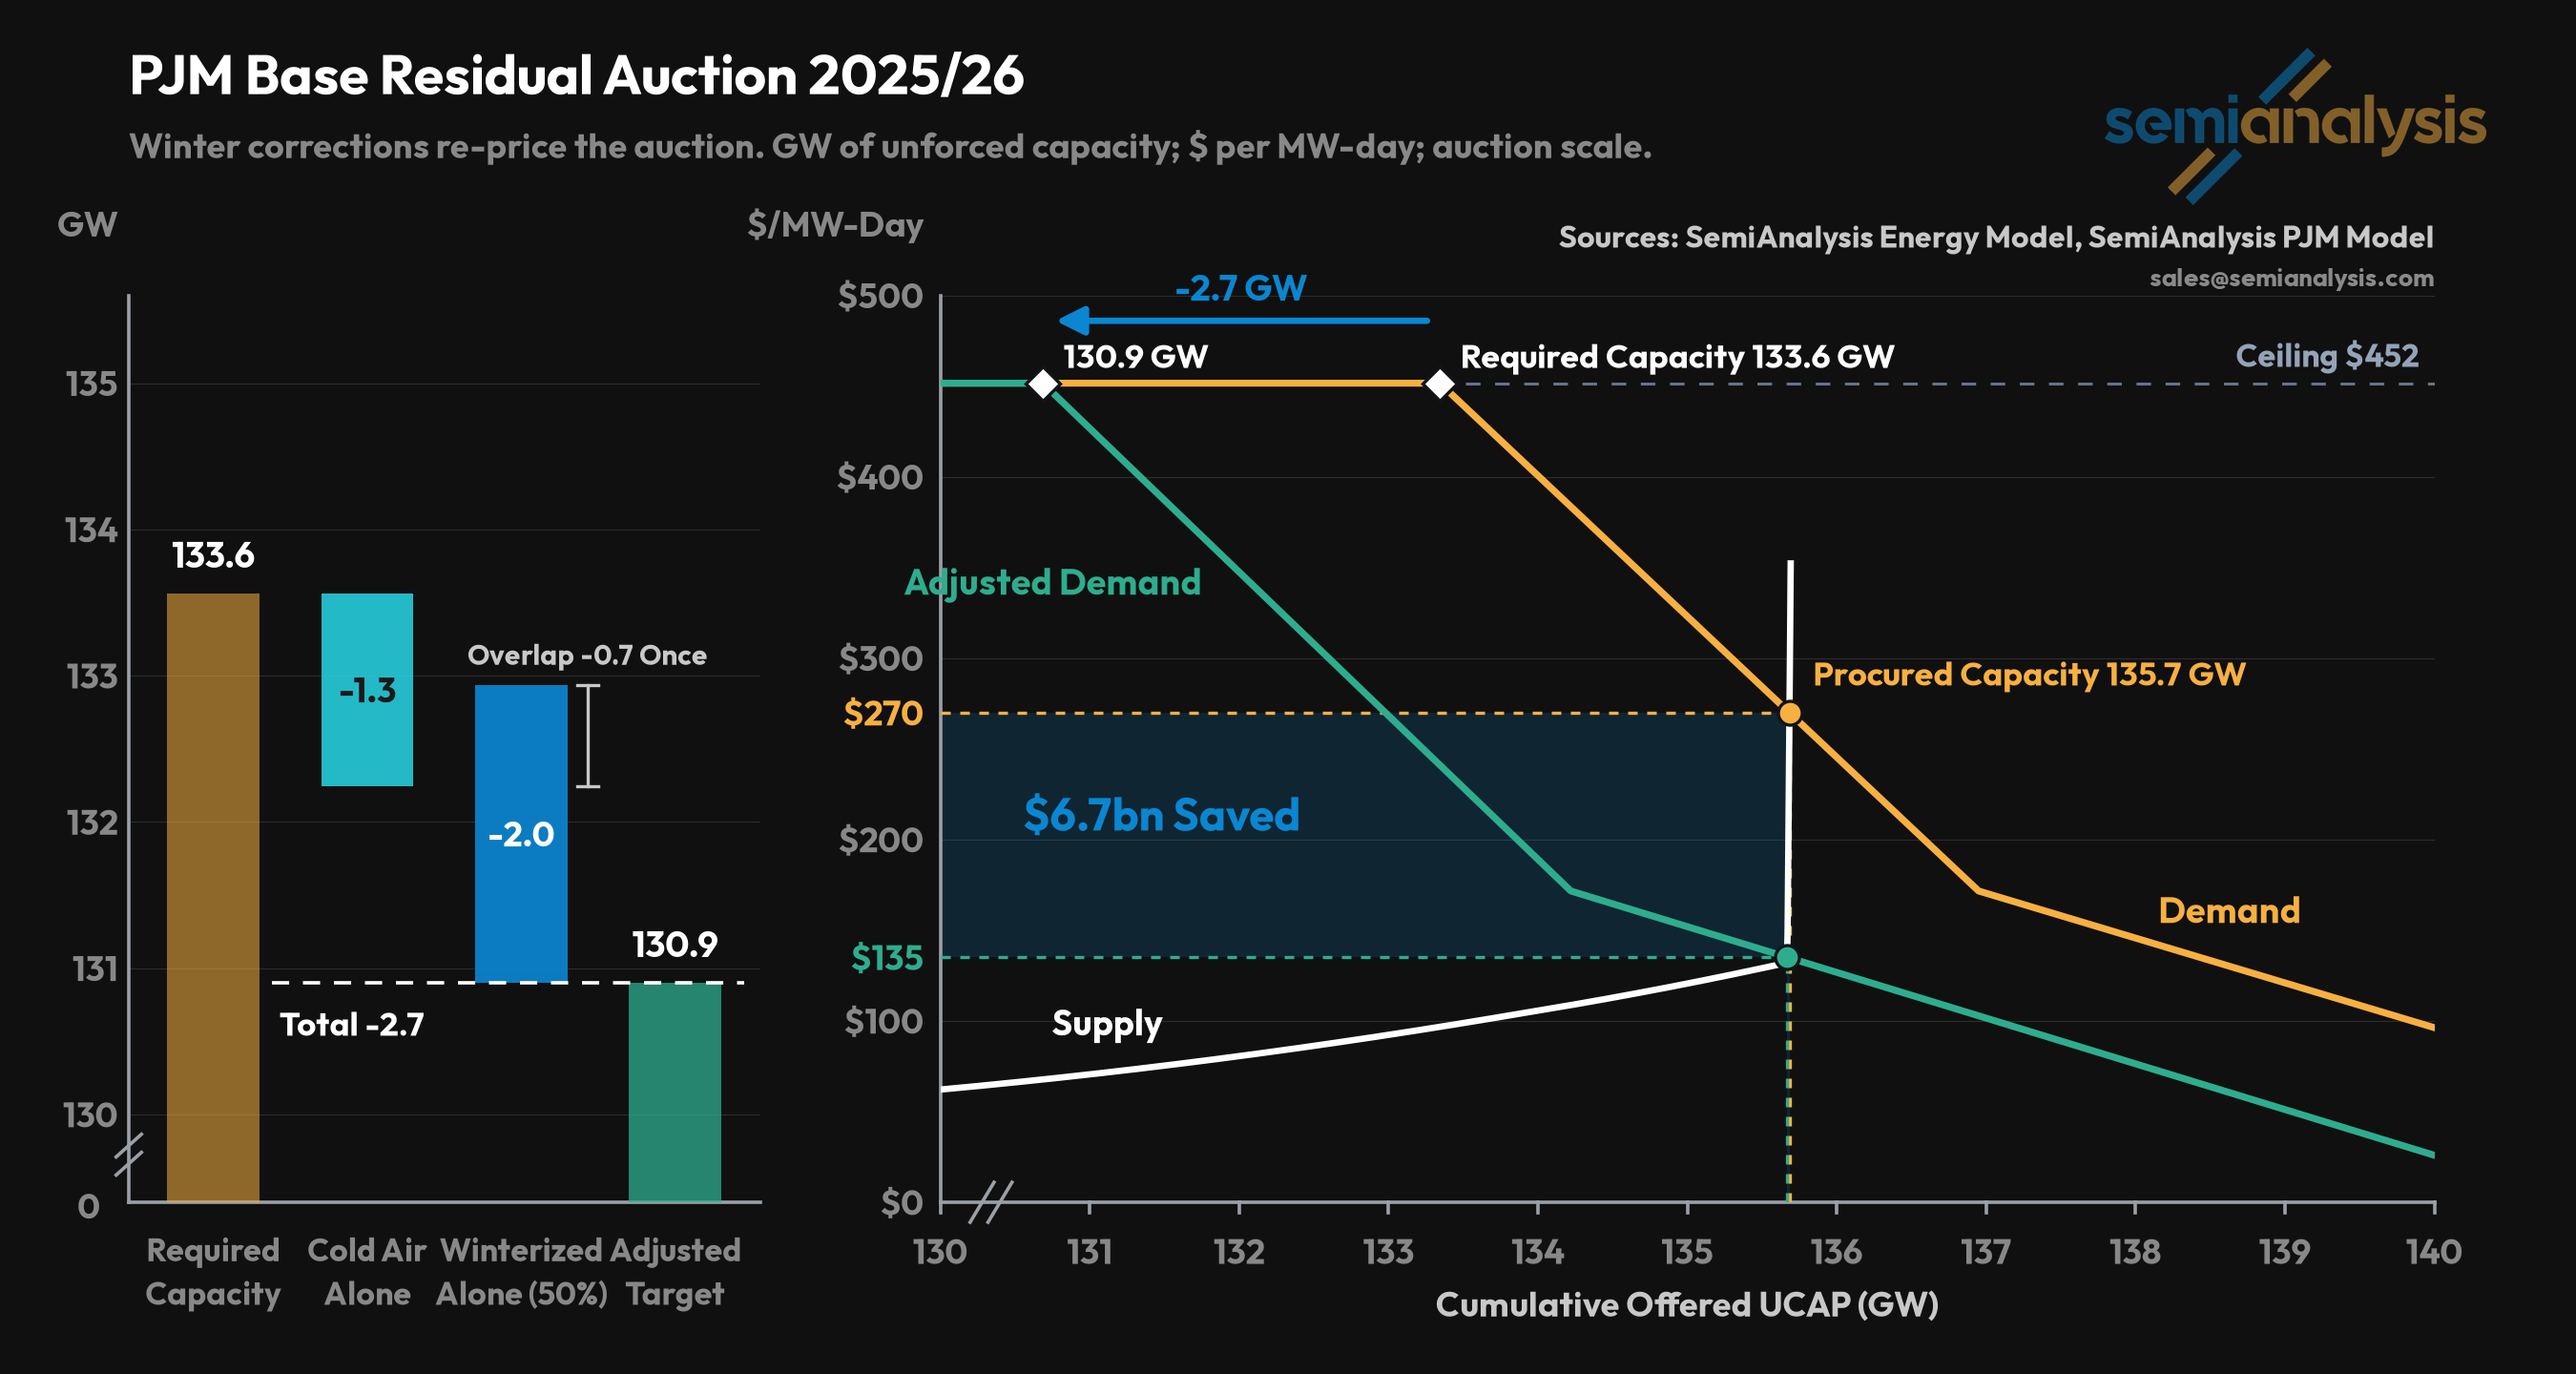
If the Reserve Requirement Study had been computed differently then the demand curve would have been shifted to the left by 2.7GW. The adjusted target required capacity would have been 130.9GW and the auction would have cleared 135.7GW at a price of $135 (a 50% discount). Only 0.014GW difference, but that $135/MW-day saving is multiplied by the full 135.7GW (plus $270 times 0.014GW), then multiplied by 365 days to give $6.7B for the full auction.
There is even a magnitude of impact sense check we can compare against. The independent market monitor ran a similar calculation in September 2024, for the cold-air credit alone. It found $2.7 billion with the reserve margin held fixed, and up to $8.0 billion without. Our figure also includes the reliability effects of winterization.
Price Caps
The auction for 2026/27 included the first politically imposed price cap. PJM has price ceilings in its demand curve modeling but price caps were set as a hasty measure by governors to prevent PJM’s awkward auction design from harming ratepayers even more. While this was achieved, the price cap of $329 also prevented the auction from clearing properly. 134.2GW was procured against a required capacity of 134.5GW, only 0.3GW short.
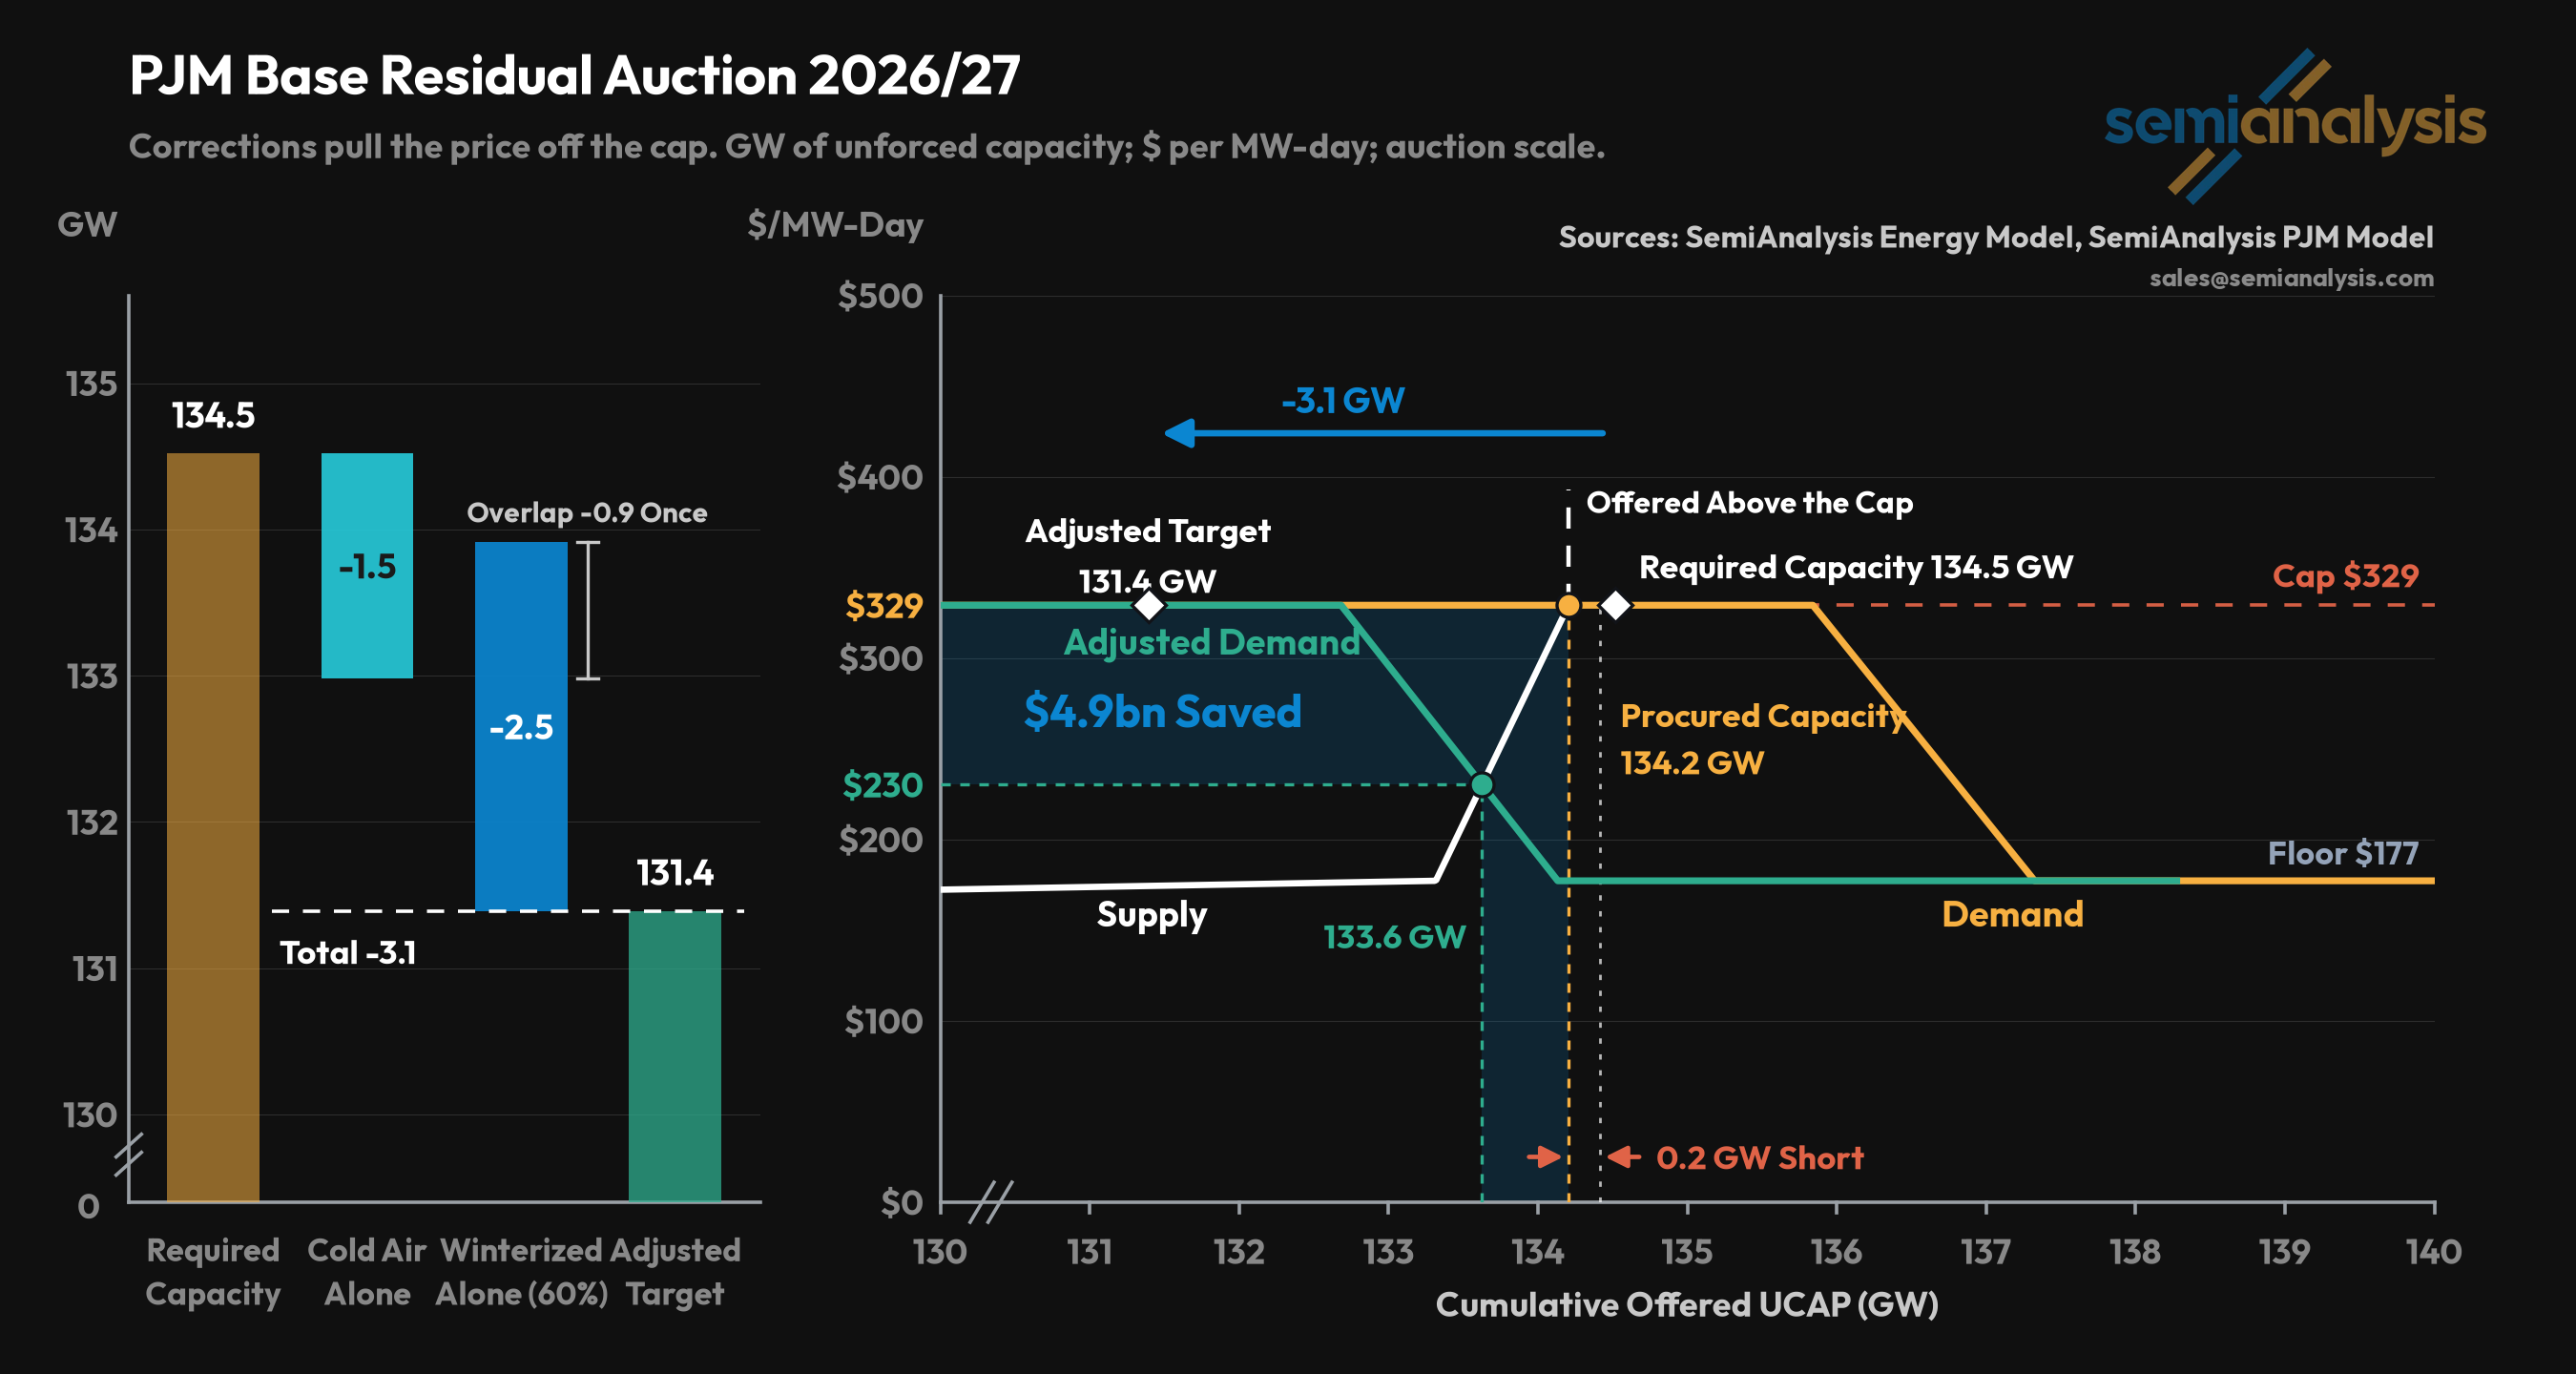
If the Reserve Requirement Study had been computed differently then the demand curve would have been shifted to the left by 3.1GW. The adjusted target required capacity would have been 131.4GW and the auction would have cleared 133.6GW at a price of $230. Only 0.6GW less, with an improved reliability margin, and $99/MW-day discount. Total auction savings of $4.9 billion.
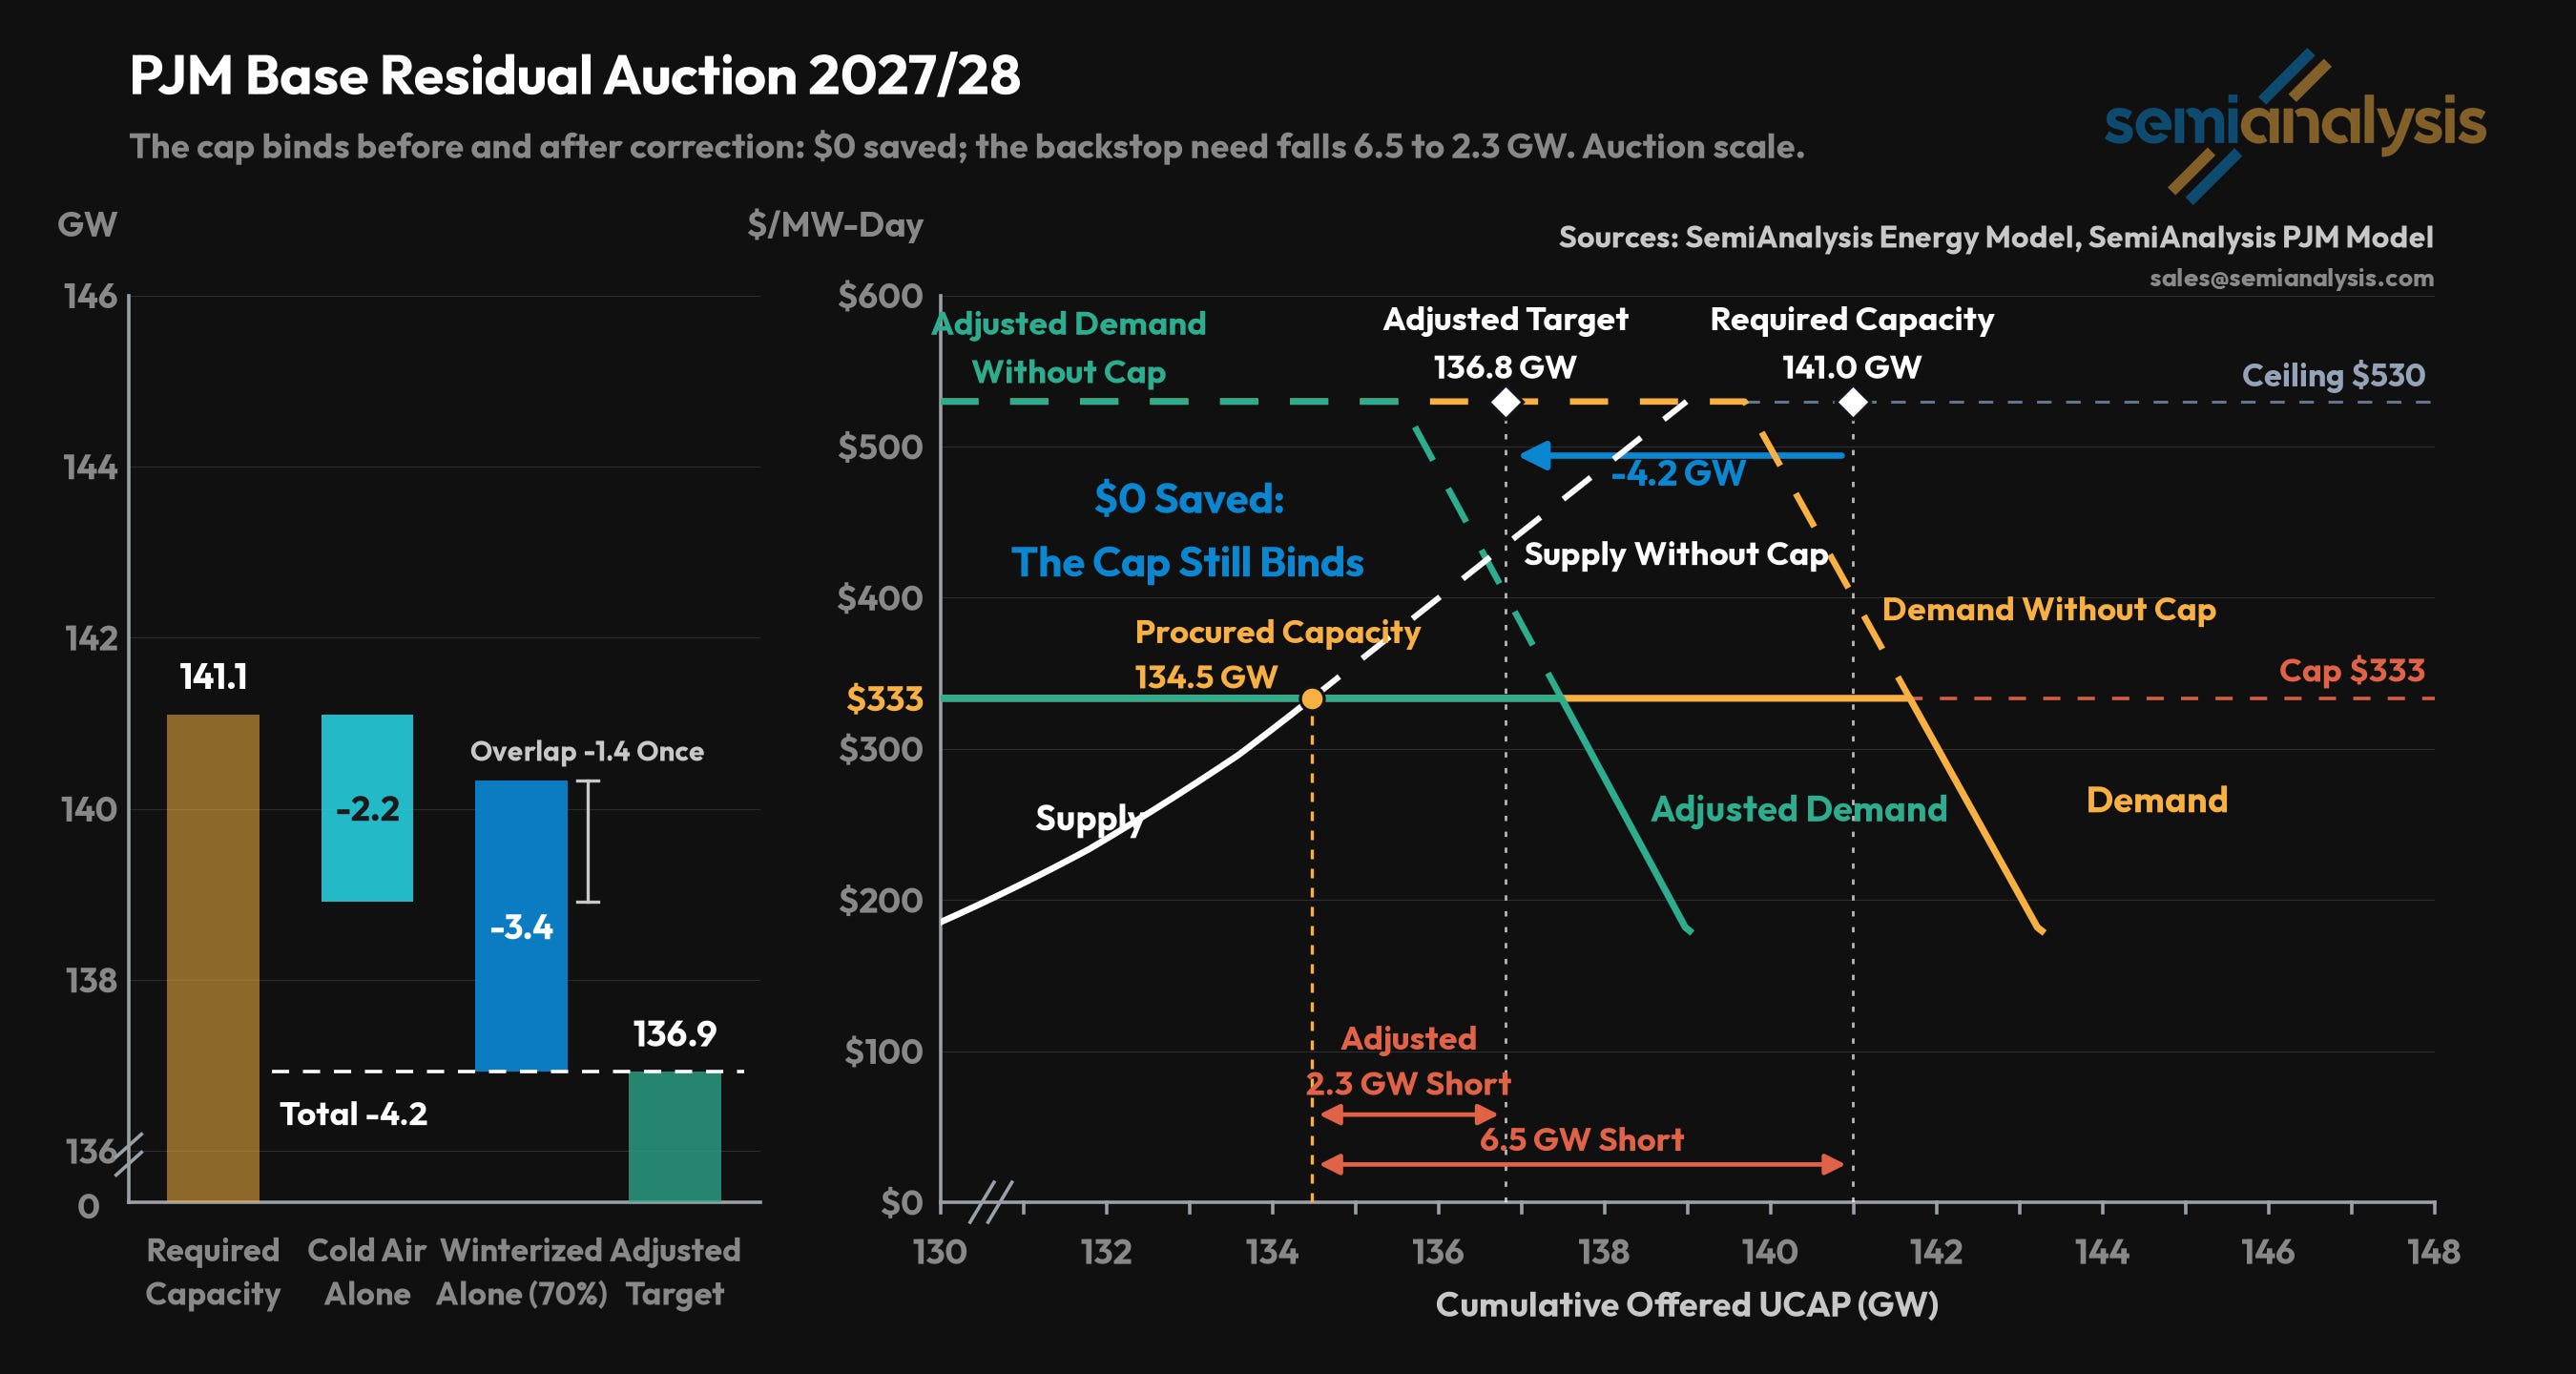
Price caps can have many unintended consequences. In this instance one result has been an emergency auction for 11-15 year contracts at elevated prices. Any generators that chose to withhold incremental capacity may well have benefited from doing so.
Constrained Supply
2025/26 and 2026/27 are the two auctions in which we found PJM had wasted ratepayers’ money. The next two auctions would not have had price or volume impacts from improved modeling because supply was so constrained that even 4.5GW and 3.8GW of movement respectively would not get the demand curve to cross with the supply curve below the auctions’ political price caps.
The 2027/28 auction held in December 2025, cleared at $333.44, at the price cap and 6.5GW short. So a 4.5GW leftwards shift in the demand curve is not sufficient to make a difference.
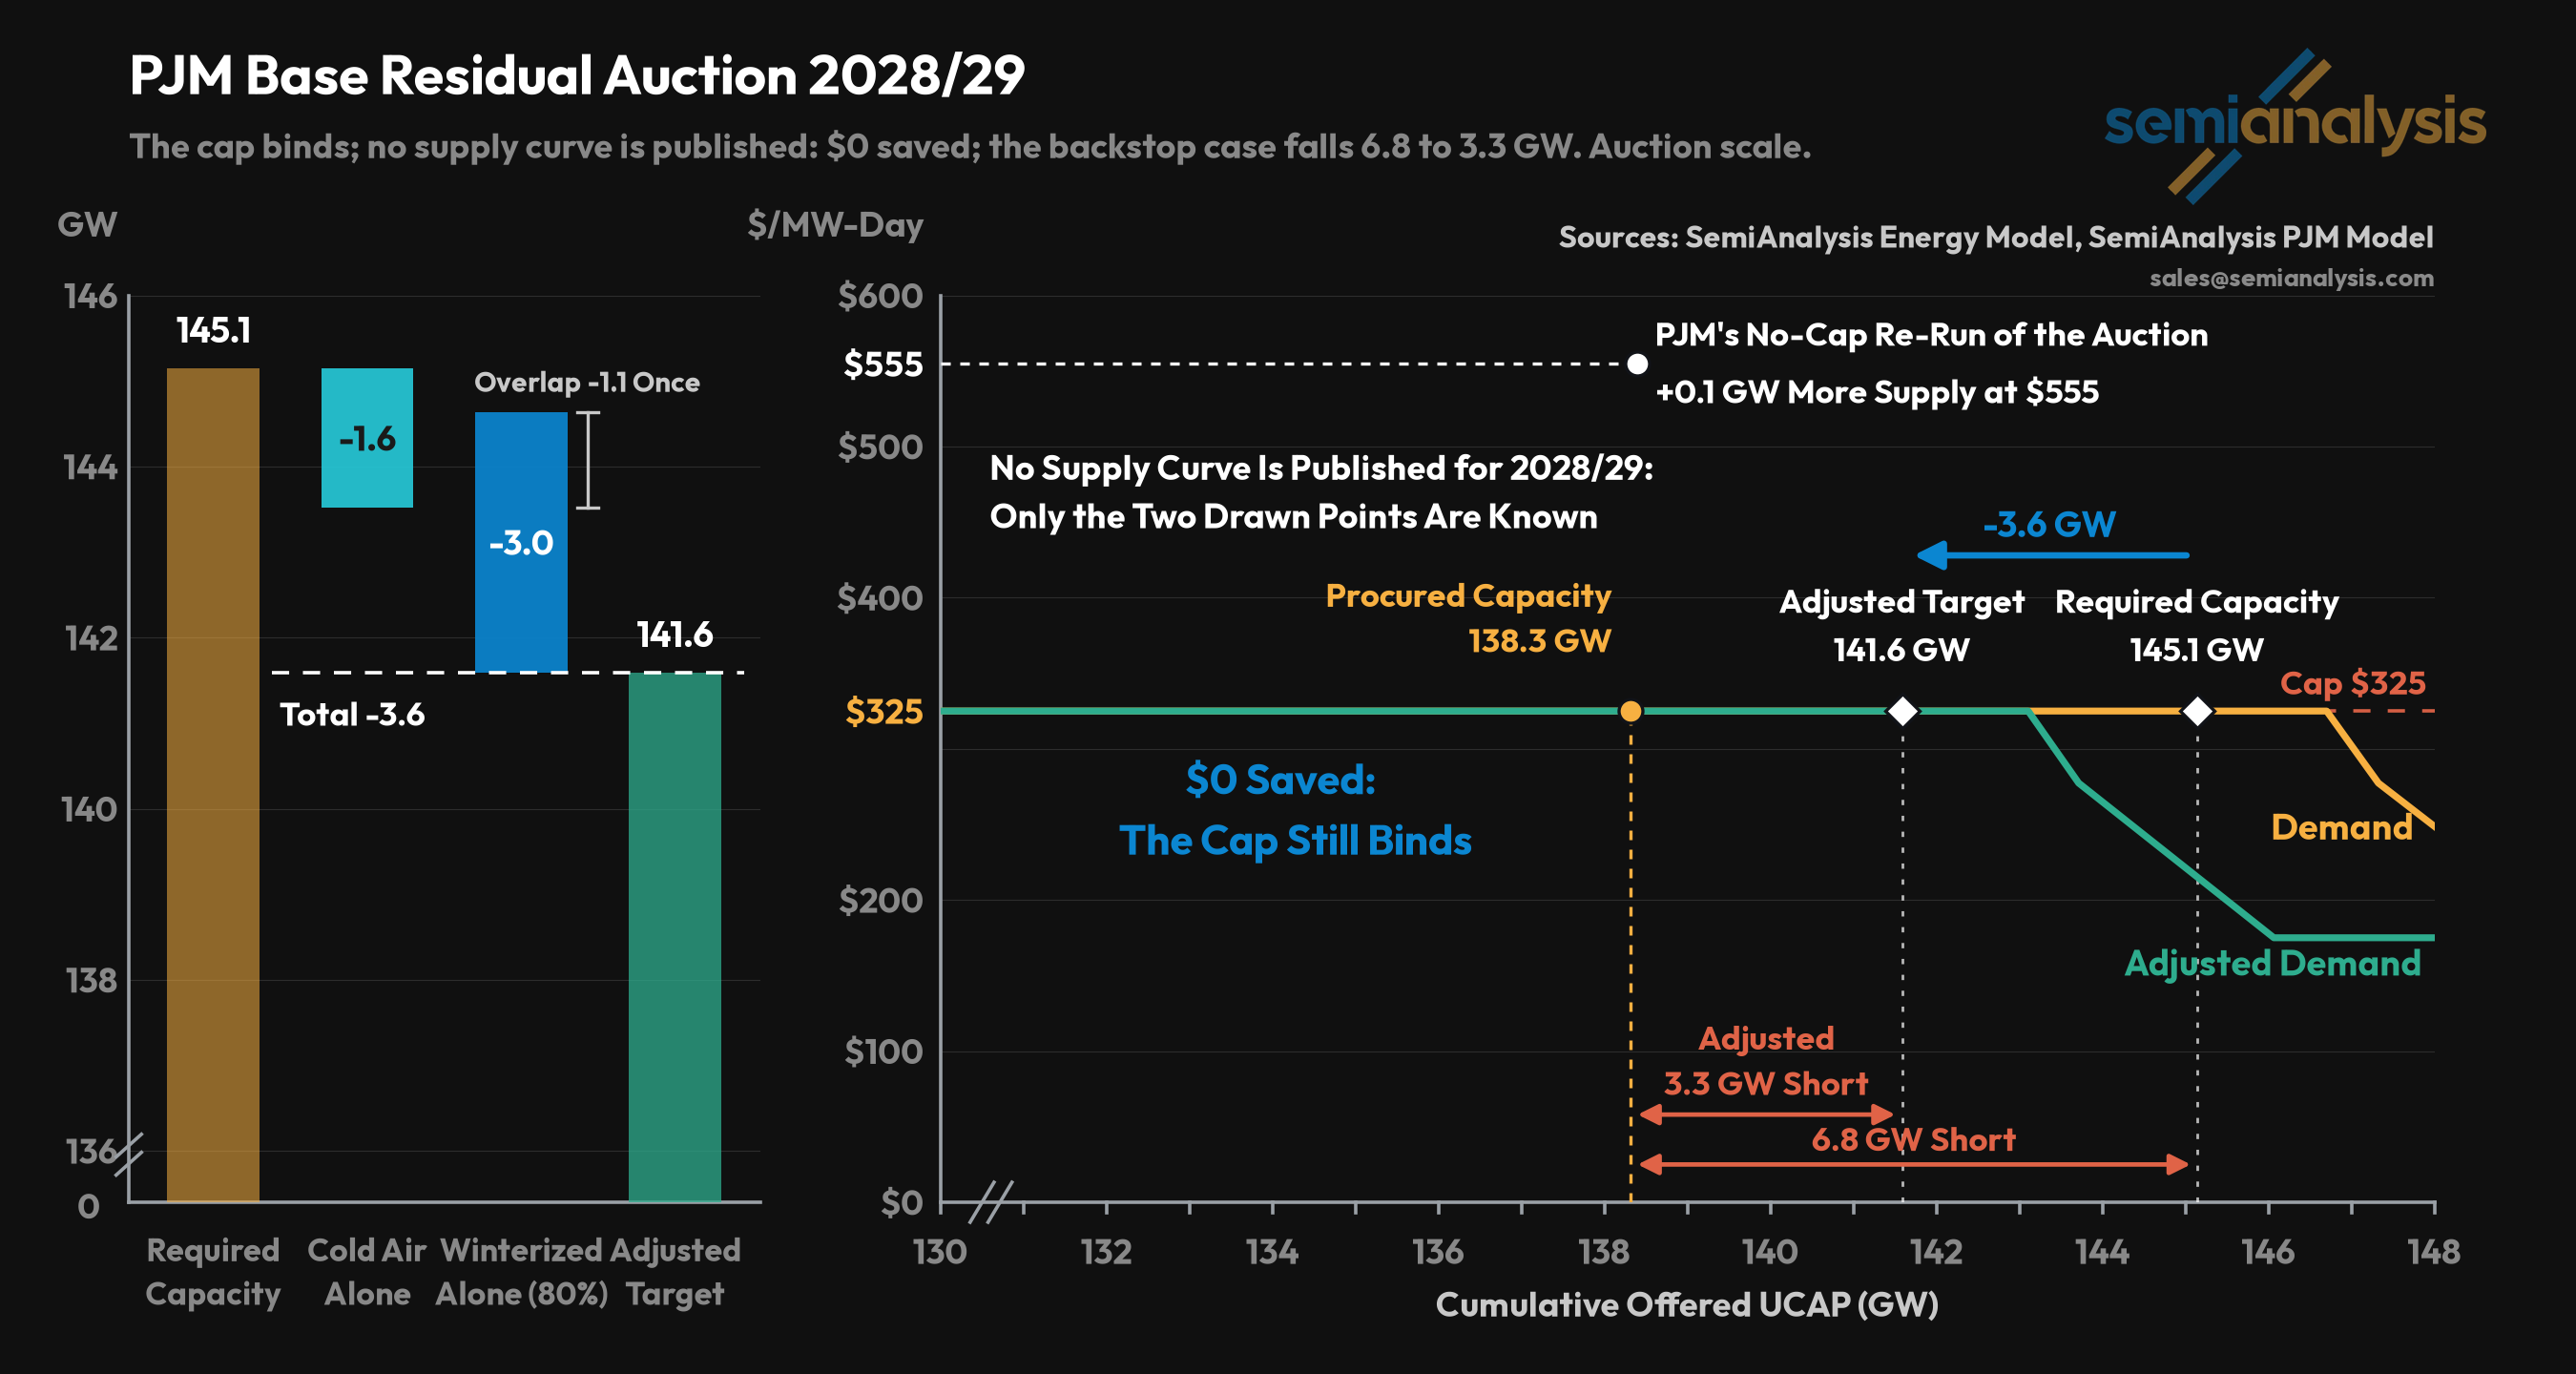
The 2028/29 auction held in July 2026, cleared at $325.00, at the cap and 6.8GW short. The 6.8GW target falls to about 3GW with improved modeling.
That 6.8GW vs 3GW is now the billions-of-dollars question for PJM’s fast-approaching emergency auction.
3. PJM is putting ratepayers at risk by trying to buy too much in its upcoming emergency auction.
Who Pays?
Buying too much is bad in any auction, but this backstop auction has no defined counter-party. PJM plans to pay for power plants to get built on the expectation that energy demand arrives later. But if that demand does not arrive then PJM will still have to pay.
In theory new large loads are supposed to pay for this emergency auction. But the forcasted large loads are hypothetical and won’t be signing on the dotted line. The plan is for PJM to sign the contracts and for the States to each pass their own cost-allocation policy to allocate costs onto participating new large loads. PJM’s filing clarifies that “Because PJM does not have jurisdiction to allocate retail costs directly to individual data centers, state action will be essential.” This creates a lot of uncertainty for large loads as cost pass-on will be bespoke state-by-state.
Only new resources in service by June 2032 may bid. Contracts all end in 2043, so a power plant online in 2032 gets about eleven years. The costs are then assigned to transmission zones in proportion to forecast load growth between 2026/27 and 2028/29. Those shares are frozen for the full fifteen years. Inside each zone, a state will use bespoke policy design to direct the costs onward to specific large loads or distribution companies. If a state does nothing, the filing’s default applies and the costs fall on every load-serving entity in the zone by peak-load share.
There is no true-up, the zone shares are set by forecast growth and never revisited. The supply contracts are structured as guaranteed top-ups. Each winner is made whole to its bid against whatever the capacity market later pays out to 2043. Load-serving entities assigned backstop costs must post credit support of $1.5 million per megawatt of obligation, within ninety days of each delivery year. At the ceiling average of $555/MW-day the maximum liability for 6.8GW is roughly $21 billion.
There is no sweetener to encourage large loads to participate such as accelerated interconnection. There is not even assurance on ‘unaccelerated’ interconnection timelines. Then on the supply side there is little penalty for under-delivering once a plant is running. PJM itself projects that even with the backstop the next auction “may clear short”.
Overruled
Through PJM’s fast-track stakeholder process this spring, the members developed and endorsed a backstop design built around a voluntary subscription model. This was championed by a coalition of the electric distribution companies and the Data Center Coalition. The idea was for large new loads to subscribe first, committing to pay for the new capacity before it’s procured. Unbelievably for PJM that design won more than two-thirds sector-weighted support.
Then the Board overrode its own members. In its decisional letter of 27th July 2026, the Board rejected the subscription framework on the stated ground that it “would not provide sufficient assurance that capacity equal to the identified near-term shortfall would actually be procured”.
That is why improving this system modeling is crucial. The Board decided this high-risk emergency auction was necessary because of modeling which overstates the near-term shortfall. The near-term shortfall is currently 6.8GW, recomputed it would be 3.0GW, an amount a subscription model could plausibly have covered. The total requirement of 156GW is built from the 2028/29 load forecast, which already embeds the anticipated datacenter growth.
PJM has filed the Board’s proposal at FERC on 31st July 2026. The Board’s design uses a $555 average-cap and they added back a badly designed curtailment scheme (IRAS) that the members had rightly voted down. Both of these measures seem designed to dissuade new large loads from joining this scheme.
An average-price cap with pay-as-bid supply contracts means that participating demand loads do not know what price they will sign. The $555 cap constrains the portfolio average and not any individual contract. PJM’s own worked example shows a $600 offer clearing. The quantity being bought is also unknown, because the window for reporting bilateral offsets runs concurrently with the offer window. The load’s own share is unknown, because it depends on state allocation mechanisms that do not yet exist and on how many other loads participate. The average is applied at selection. If contracts are voided later, the remaining portfolio is never re-tested against $555. This risk is asymmetric on the upside as lower priced contracts are more likely to be abandoned or fail. Pay-as-bid makes this worse. In a marginal-price auction a bidder’s best strategy is to bid its true cost. Under pay-as-bid the best strategy is to bid your forecast of the highest accepted price. PJM’s own witness says this in the filing: pay-as-bid sellers “are more likely to offer the expected clearing price,” and market-power mitigation in this setting is “difficult and ineffective.”
The Interim Resource Adequacy Service (IRAS) scheme applies to loads over 50MW after 2027/28 that are not covered by one of: the central procurement, self-supply, or a bilateral contract. These loads connect as non-firm and are curtailed first during capacity shortages, ahead of even the pre-emergency demand response programs. As an aside, non-firm connections are fair in extreme cases, but this is mad. Demand response participants are paid to curtail; it is a service they sell. The new large loads would be paying for this service in their electricity bills and still be turned off first. These demand loads will be in the hundreds of megawatts and are not designed for this kind of fast response or high-fidelity manipulation. It could even be dangerous to the system. PJM’s own staff had dropped mandatory curtailment days before the final stakeholder meeting, citing doubts about PJM’s jurisdiction to curtail retail load at all, and the generators’ own trade group warned that reviving it invited protracted litigation.
For any load that can manage it, self-supply strictly dominates the auction. This will drive defection and greatly increase the risk of yet more over-procurement by PJM to the detriment of its rate-paying households and businesses. For the rest, greener pastures await in other power markets.
Governance
Comments to FERC close 21st August at 17:00 Eastern. The auction runs from 30th September to 21st October, with results by 2nd December. This is only one week before the next regular auction opens on 9th December. PJM posted the class ratings for the 2029/30 auction on 7th August. Once again they were computed for endless summer. PJM will post the remaining parameters on 31st August. Everything in this piece is about decisions being made in the next ninety days.
Other than our reverse-engineered model almost none of this is new. In 2023 PJM proposed a full two-season capacity market itself. But after the Independent Market Monitor and others objected that the design needed more development time, PJM withdrew it and filed an annual-only package; FERC approved that package in January 2024 and declined to require seasonality. In September 2024, the Independent Market Monitor concluded that crediting the winter capability of thermal plants would have cut that year’s capacity bill by $2.7 billion with the reserve margin held fixed, and up to $8.0 billion otherwise. Its standing recommendation read: “There is no reason that excess winter CIRs cannot be assigned to these resources immediately.” In May 2025 PJM’s sensitivity analysis found the fleet’s winter capability runs 8,561 megawatts above its summer ratings. That same month, members voted 3.699 (of 5 sector-weighted votes) to defer adjacent transmission work “until such time that stakeholders undertake work on a seasonal capacity construct.” In July 2025 PJM’s own task force endorsed the fix in Package C. This included winter ratings and passed 178 votes to 54, 77%. Twenty-six days later, on 20th August 2025, the senior committee killed it with 30.7% of the weighted vote. Generation owners argued a higher winter rating raises the benchmark a plant is penalized against when it underperforms in summer. The consumer sectors voted PJM’s package down while backing two blunter alternatives, and the generators killed those in turn. In December 2025 E3 recommended seasonal or daily ratings, Consideration 4 of 14. No vote has been held since.
Conclusion
PJM’s centralized capacity market has fully failed at its core role of solving capacity shortfalls. Faced with the first instance of modest growth in its modern history, the capacity market was unable to procure capacity. Instead PJM’s design misallocated those dollars as windfall profits to existing generators while constraining supply with short lead times and long interconnection queues. PJM is making progress at creating a third energy market in the form of this emergency auction specifically for the new generation. But in doing so it is converting long-standing errors into long-standing liabilities with basic resource modeling accuracy still in the air.
These specific modeling points have been debated before but without success in implementation. Our hope is that this effort to reverse-engineer and release PJM’s black box will move the debate through exposure to the size of impact this change in methodology could have. That is what we have attempted to do with the information that is publicly available. We must emphasize that there is key information which is not available which we have highlighted. This has the result that our modeling is at best a good approximation. If we are even half right, we need to change this modeling urgently to avoid further waste and create a clearer signal of what new capacity is required to enable PJM to grow once again.