

AI Value Capture - The Shift To Model Labs
Vera Rubin VR NVL72: V for Value - Rubin delivers a step jump in performance per TCO. ROI accruing to users, Neoclouds, Hyperscalers, AI Labs, Memory Vendors or GPU Manufacturers?
A day in AI now feels like a year in any other industry. Model releases, software breakthroughs, and hardware improvements are compressing multi-year cycles for any other industry into weeks. Over just the past few months, agentic AI has crossed a real inflection point, driving a step-change in the value of tokens while software and hardware improvements have sharply reduced the cost of generating them.
This flood of demand is driven by end users enjoying a huge return on investment (ROI) from consuming tokens, and this demand growth is arguably only in its early innings. This year Anthropic’s ARR has exploded from $9B to over $44B today, their gross margins on their inference infrastructure have increased from 38% to over 70% over the same period.
This rapid pace of AI adoption has created value across the stack, but the unique phenomenon is that the AI labs are capturing all the value now, from almost none last year.
End users are enjoying a productivity bonanza - tasks that used to take tens of person-hours costing thousands of dollars can now be accomplished in minutes with a just a few dollars’ worth of tokens. This huge surge in revenue and margins is because the value of tokens being created is dramatically improving businesses. For example, SemiAnalysis has reached as high as $10.95 million dollar annual spend rate on Anthropic Claude tokens, but the value we derive allows us to outcompete all our competitors and gain market share.
New chips such as Blackwells can generate 30x more tokens per second while running frontier workloads today vs Hoppers a year ago, and ASICs such as TPUv7 and Trainium 3 show similar improvements. Inference providers such as Fireworks, Baseten, Fal, margins are widening while their revenue trends are in hyper growth.
Even parts of the hardware stacks have repriced, with memory prices having gone up 6x in the past year. Neocloud GPU rental pricing is surging as well, up with 1-year H100 rental contract prices up 40% from the bottom in October 2025.
There are two firms in the industry with incredible pricing power that haven’t moved much though. TSMC and Nvidia have not reacted to the recent boom in value generation of AI models.
In this article, we will explore where value from AI is accruing - from end users to inference providers, Neoclouds as well as hardware providers. We will unveil how TSMC and Nvidia are now venting vast value into every vertical of the ecosystem.
Finally - we introduce a new framework: the “One Chart to Rule Them All” that explores GPU Rental Economics and analyzes whom among the end users, the Neoclouds/Hyperscalers and the AI System suppliers are capturing the most value in the AI ecosystem.
AI Value Profit Pools
From 2023-2025, all the value in AI was captured by the infrastructure layer. Nvidia had their first blockbuster earnings call in May 2023 and jumped 25% after hours, officially marking the start of the AI trade. In 2024, Vistra and GE Vernova were two of the top performing stocks in the S&P 500 (+265% and +146% respectively) as everyone realized power was becoming the key bottleneck. In 2025, memory stole the show, with SanDisk, Western Digital, Seagate, and Micron all posting 200%+ gains on the year. These are all sweeping generalizations of course and many other infra names have significantly outperformed thanks to increased AI capex. Those interested in all the granular details should subscribe to our institutional products.
During this same period, gross margins for all the model creators and inference providers were famously bad. For most, the actual utility of AI still only amounted to slightly better Google search locked behind a chat interface and Studio Ghibli style selfies. Skeptics loudly proclaimed that there was simply no way AI could ever deliver on the trillions of planned capex.
Agentic AI Has Changed the Game
The world changed in December 2025, when Agentic AI began to really work. SemiAnalysis has written and talked extensively about our Claude Code usage, but it is important to emphasize that agentic AI is no longer limited to just coding. Our analysts are using agents every day to convert excel models into dashboards, create charts for all our notes, build financial models and analyze company earnings, and much more. These are all tasks that either 1) we simply wouldn’t have been able to do before or 2) would’ve previously taken our junior analysts many hours, taking them away from far more value added tasks.
The table below shows a handful of real examples from our own workflows, comparing token spend against what the equivalent human labor would have cost:
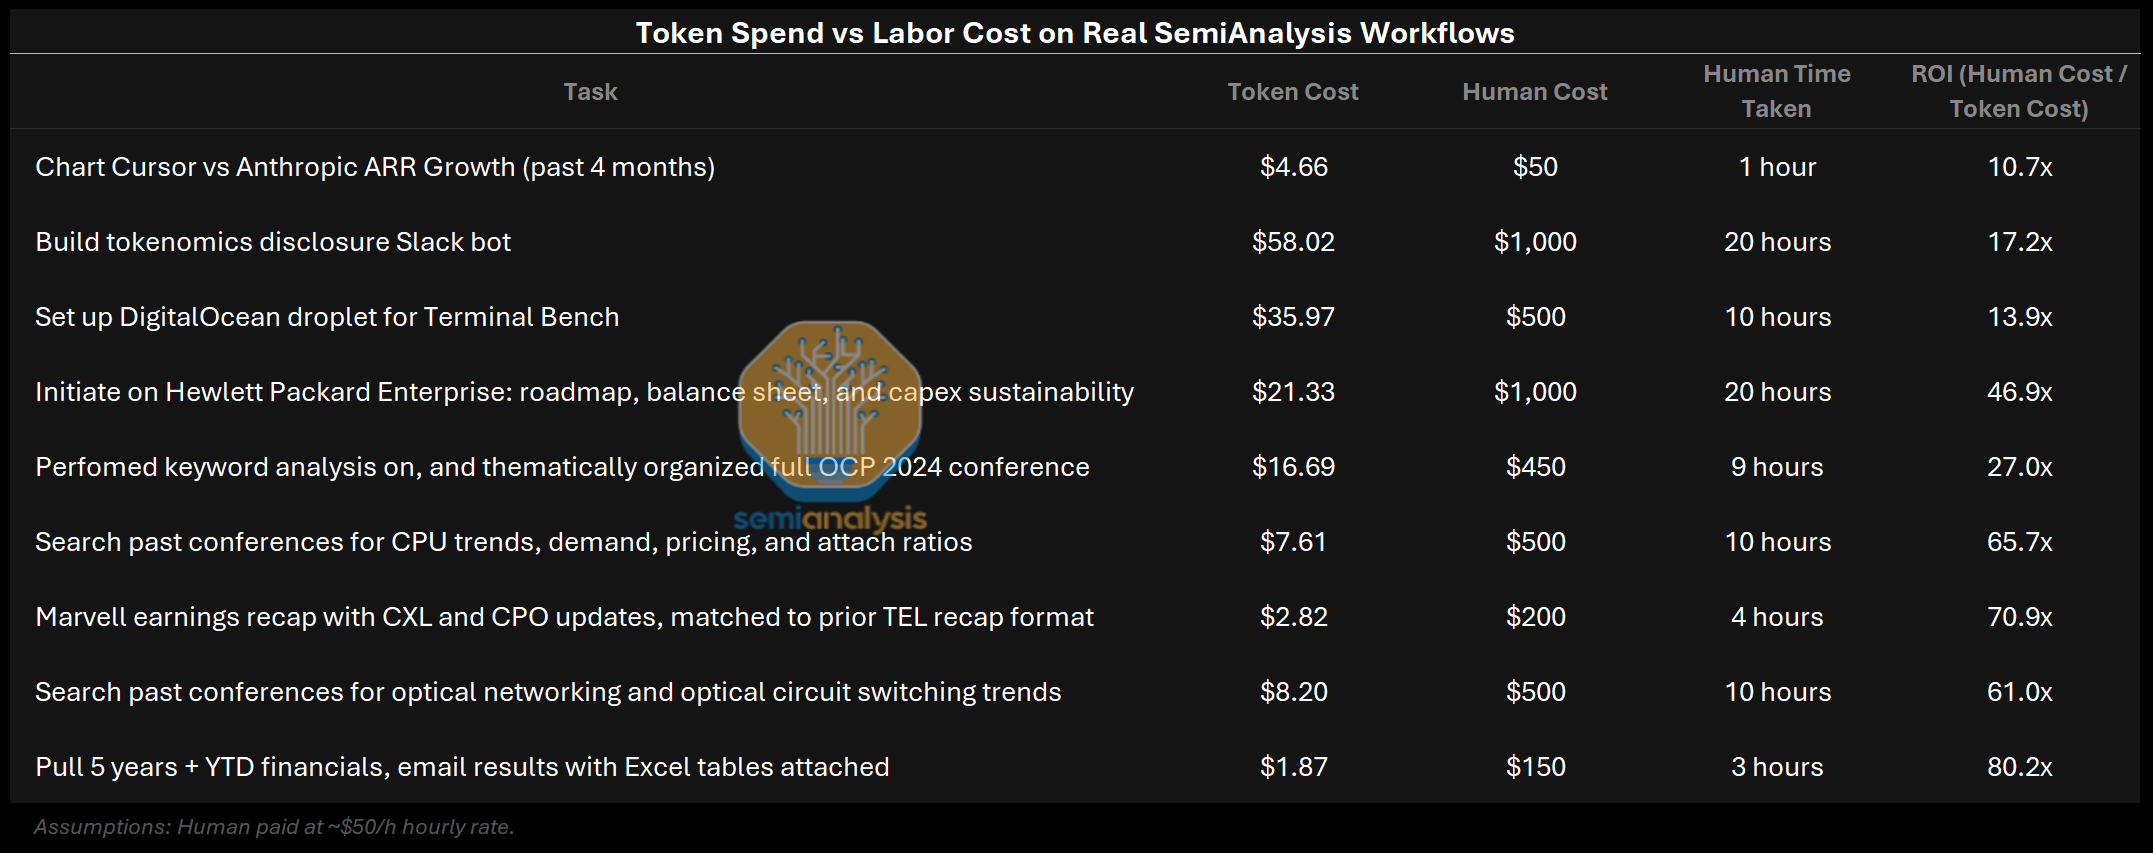
Annualized token spend at SemiAnalysis is already ~30% of employee compensation and we’re consuming just under 5B tokens per month per employee (over 5x more than Meta!). This is power law distributed though, so there are team members running over 100B tokens a month. It’s obvious that this is still just the beginning, and that all white-collar enterprises will soon embrace agentic AI.
Within the past few months, the value of each token has clearly increased. We estimate that the true blended price per million tokens for running Opus 4.7 on agentic tasks at $0.99 despite the sticker price being $5/$25 per MTok. Agentic workloads have extremely high input-to-output ratios (our Claude Code usage has a ratio of about 300:1) and high cache hit rates (90%+). Because cached input tokens only cost $0.50/MTok, most of the tokens end up in the cheapest tier. We walk through the full methodology here.
When framed this way, it’s no wonder why Anthropic ARR has exploded from $9B to potentially $44B+ YTD.
Tokens Are Getting Cheaper to Produce
At the same time, the cost of producing each token has plummeted. This is the largest driver of value accretion to inference providers, and it is a key reason for the sharp increase in margins at large AI Labs.
Cost of production for token has fallen sharply because increases in accelerator pricing generation-over-generation have been more than offset by much higher throughput (tokens/sec/gpu). Average blended price per million tokens has fallen dramatically over the past few months, agentic workloads are inherently multi-turn with longer input/output ratios and higher cache hit rates, but inference margins have gone up from < 40% to > 70% in the same time frame. For in-depth estimates on true blended price per million tokens, token production volumes, and gross margins for all the major models from OpenAI, Anthropic, and more, see our Tokenomics model.
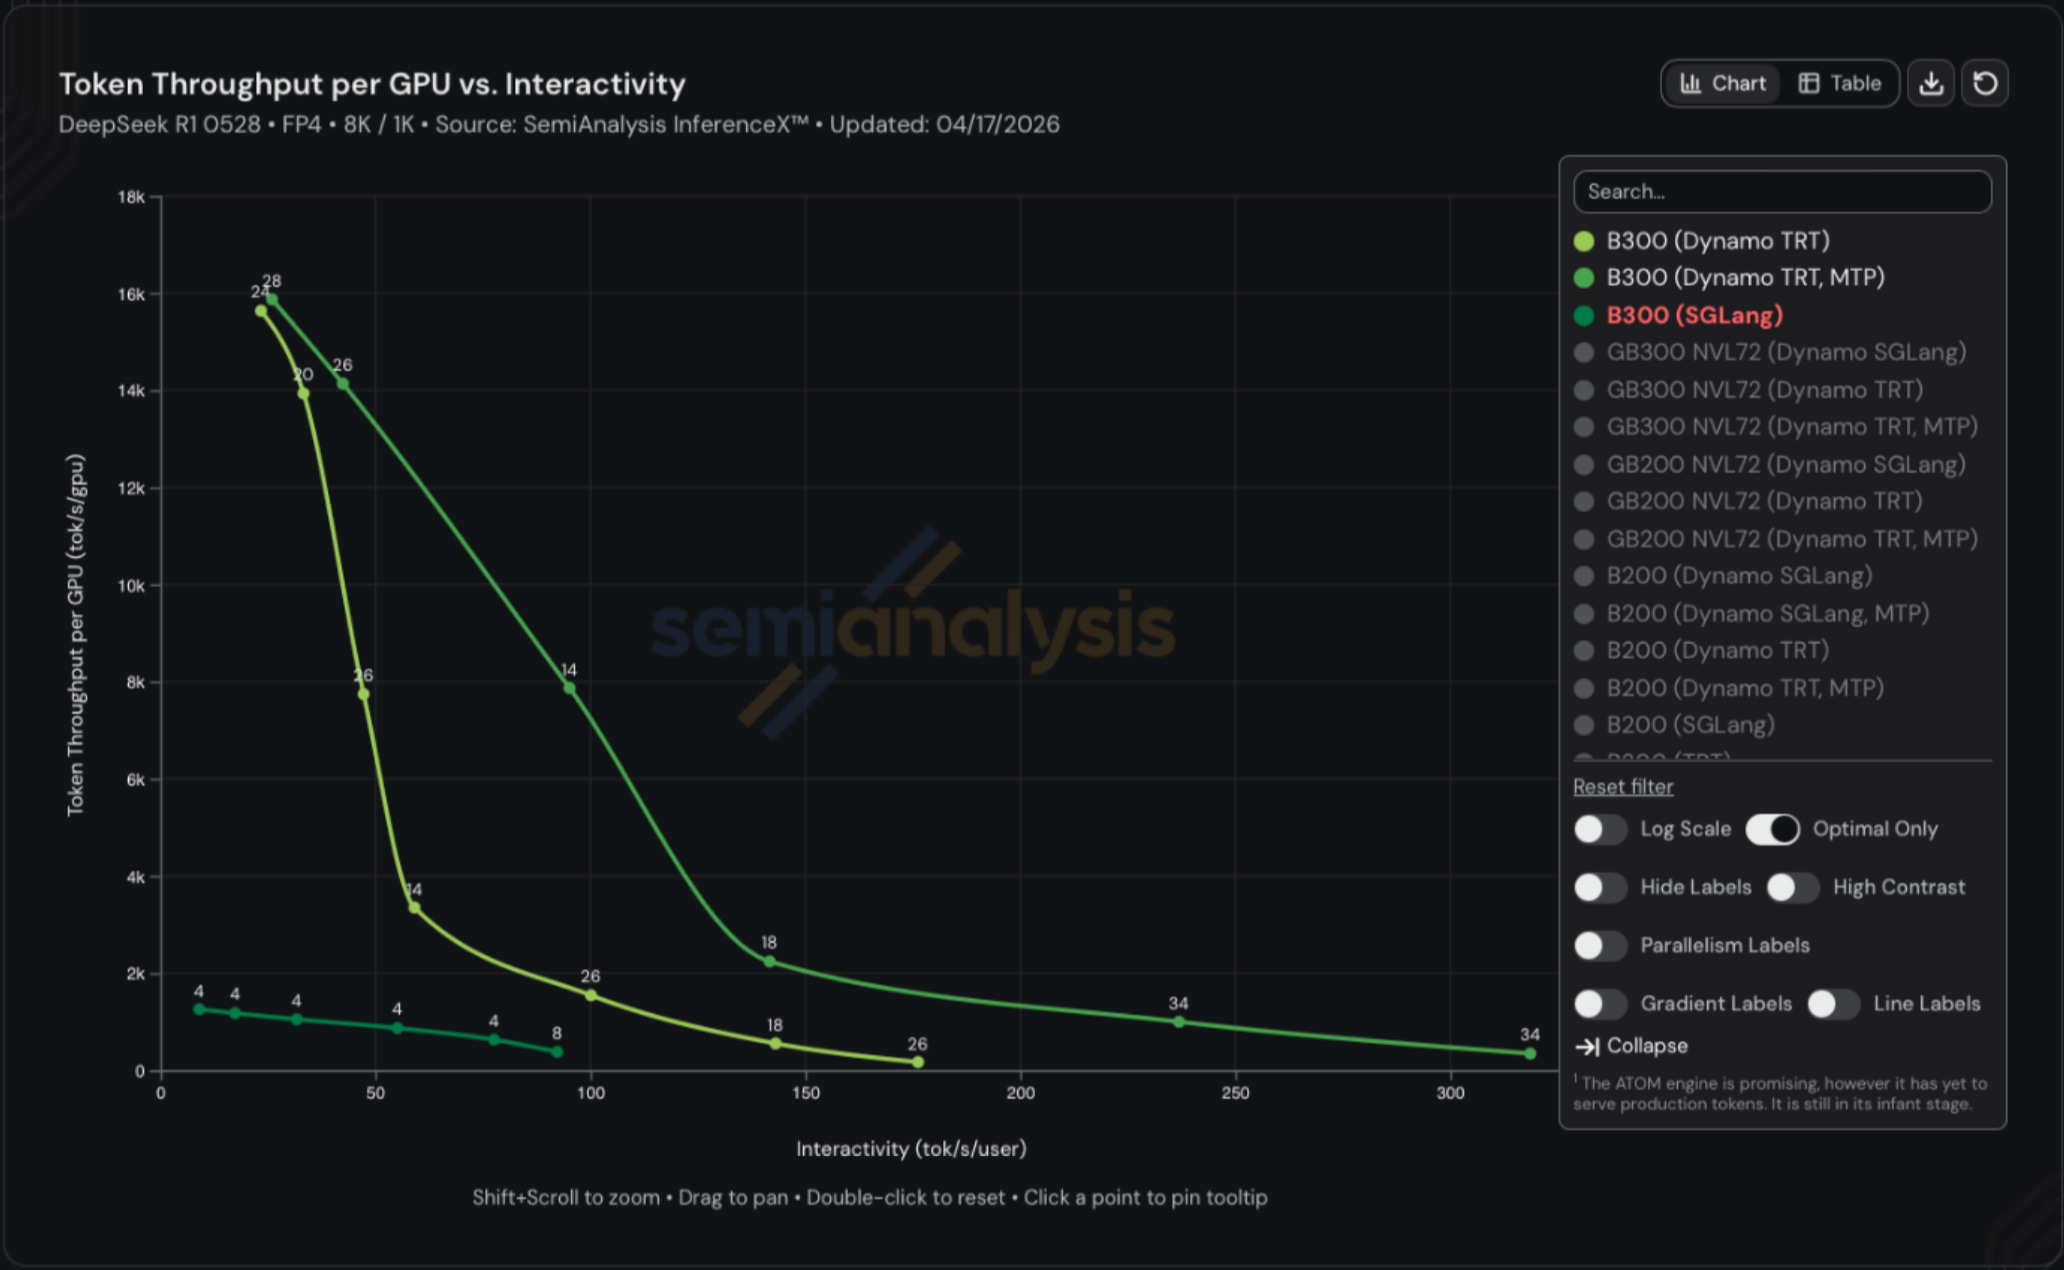
InferenceX remains the best benchmark for tracking real-world inference performance over time for open source models given both hardware and software improvements.
The following chart shows throughput vs interactivity for B300s running DeepSeek R1 on 8k input tokens to generate 1k output tokens. The top line reflects token throughput with wideEP + disagg + MTP, the middle reflects wideEP + disagg and he lowest line is without any of the three software optimizations. The gap is startling with the same B300 able to yield~1k, ~8k, and ~14k tokens/sec/gpu on the same hardware. One can 14x throughput with software improvements alone.
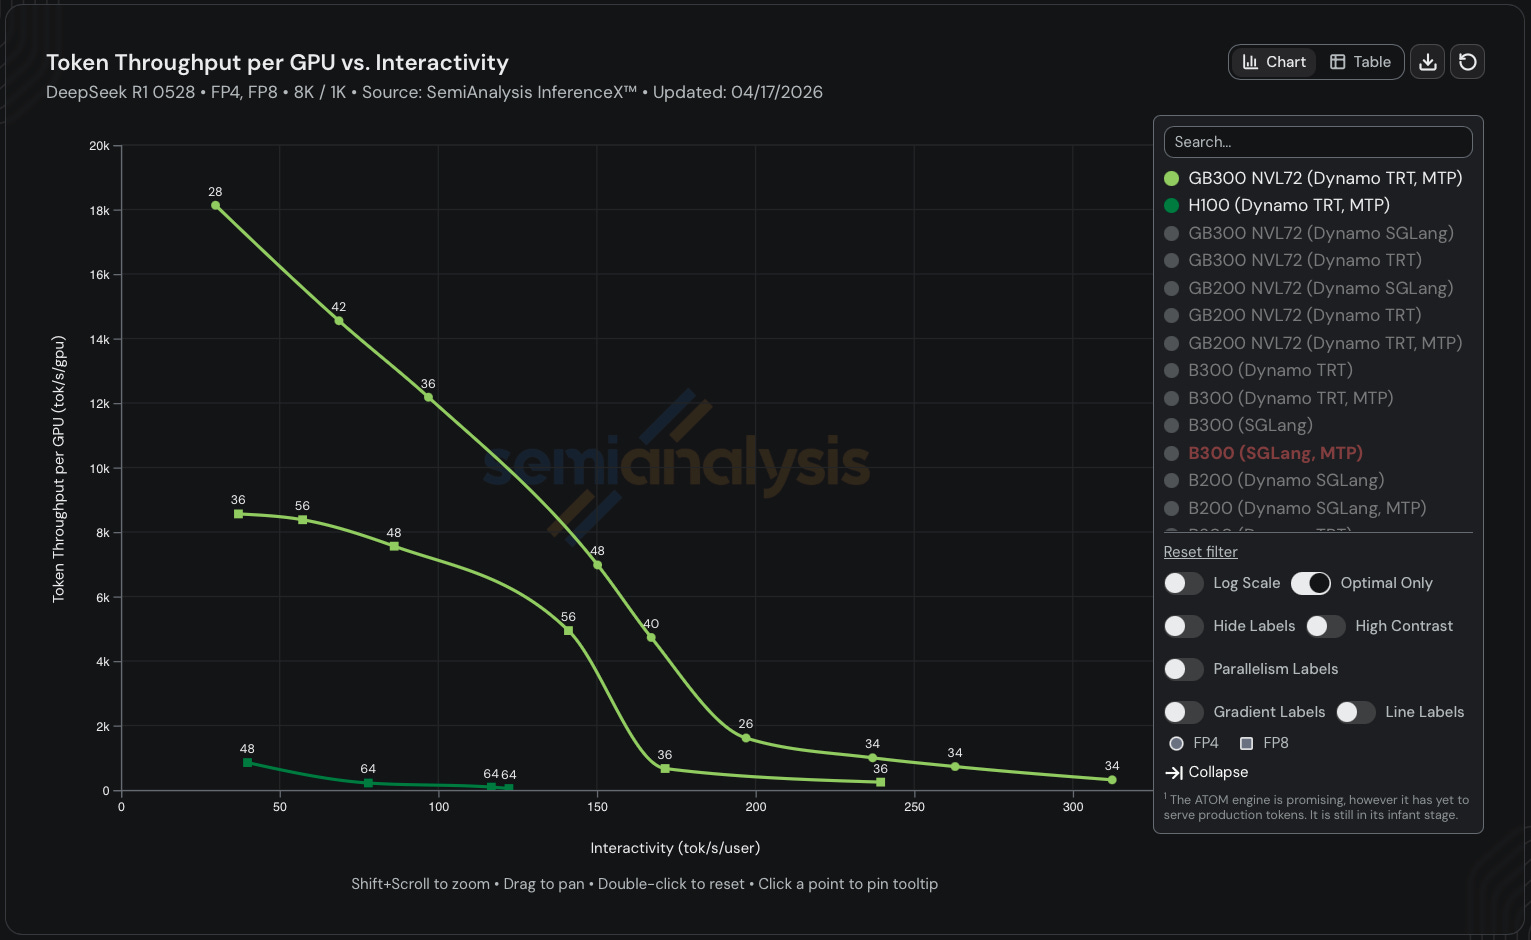
If you factor in hardware improvements as well, then the difference is even more pronounced. The most optimized GB300 NVL72 configuration achieves ~17x higher throughput than the most optimized H100 configuration in FP8. If we switch to FP4, which Hopper doesn’t natively support, the difference jumps to 32x. Remember that the total cost of ownership per GPU is only ~70% higher for GB300 vs H100.
Model Provider Margins Will Continue to Increase
Many were surprised when Anthropic released Opus 4.5 at a price of $5 per million input tokens and $25 per million output tokens in late November 2025. Previous Opus models such as 4 and 4.1 (released May 2025 and August 2025 respectively) were priced 3x higher at $15/$75.
However, we think Anthropic’s margins have actually increased on Opus tokens despite the lower ASP thanks to software improvements across Trainium and Nvidia GPUs as well as replacing Hoppers with Blackwells.
Anthropic’s margin expansion so far has come from cost reductions; they can generate the same tokens for cheaper. Despite the Opus price cut, their ASP/token has also actually gone up because most of the volume shifted from Sonnet to Opus.
Even if XPU providers start dramatically raising prices to better capture their share of the throughput improvements, Anthropic still has another lever to pull to further expand margins: they can continue shifting volume to more expensive SKUs.
As mentioned earlier, the gap between the price of a frontier-level token vs the economic value of the work that can be produced by said token is the largest it’s ever been. Anthropic can either re-up the price of the base Opus family or introduce new products. We already saw the latter with Opus fast being priced 6x higher than regular Opus, and Mythos being announced at $25/$125 (5x regular Opus pricing). Both these SKUs are higher margin than regular Opus, yet the most AI-pilled businesses are still more than happy to pay the increased prices because the productivity gains outweigh the cost. If Anthropic let us pay $150/$750 for Mythos fast, we would.
The age of low gross margins for frontier model providers is over. Real agentic AI has permanently increased the market-clearing price per token, and there’s no going back.
Why Model Provider Profits Won’t Get Competed Away
The most obvious argument for why the labs won’t be able to capture higher margins despite increased utility per token is competition. However, we don’t think this is how things will play out for two reasons.
First, it’s become clear that the frontier model maintains pricing power. Regardless of what the benchmarks may say, open-source models are still noticeably worse than their closed source counterparts for real knowledge work, and there’s no reason to believe the gap will close any time soon. Kimi K2.6 ($0.95/$4) exerts very little downward pressure on Opus pricing.
Second, compute constraints means that no single frontier lab will be able to serve the entire market. Anthropic is already beginning to alienate large swathes of the market today by locking Claude Code behind a $100+/month subscription and blocking third party harnesses like OpenClaw. Token demand will far outstrip supply for the foreseeable future, which means any lab capable of providing true frontier quality will be able to charge based on the economic value delivered by the token rather than competing away each other’s margins.
Agentic AI Hits the Market, but TSMC and Nvidia Haven’t Flinched
Despite the repeated emphasis on agentic AI during Jensen’s most recent GTC keynote, Nvidia and TSMC still have not fully internalized how transformative the past few months have been for token economics. We already saw Nvidia underestimate Blackwell’s performance-per-dollar improvements based on Jensen’s reaction to InferenceX, and it now appears they have also underestimated how quickly frontier tokens would appreciate in value.
Nvidia is still operating within a framework shaped by prior assumptions, where the willingness to pay per unit of compute declines over time. That assumption no longer holds. The market has shifted materially, driven by the explosion of agentic workloads and a sharp increase in token consumption per workflow. Demand is no longer linear. It is compounding.
Demand, however, continues to accelerate. Anthropic’s ARR has reportedly reached $44B+, up from $30B in our last update, while open-weight models such as GLM and Kimi are expanding the addressable compute base. Capital raises across AI labs and Neoclouds are translating directly into incremental GPU deployments.
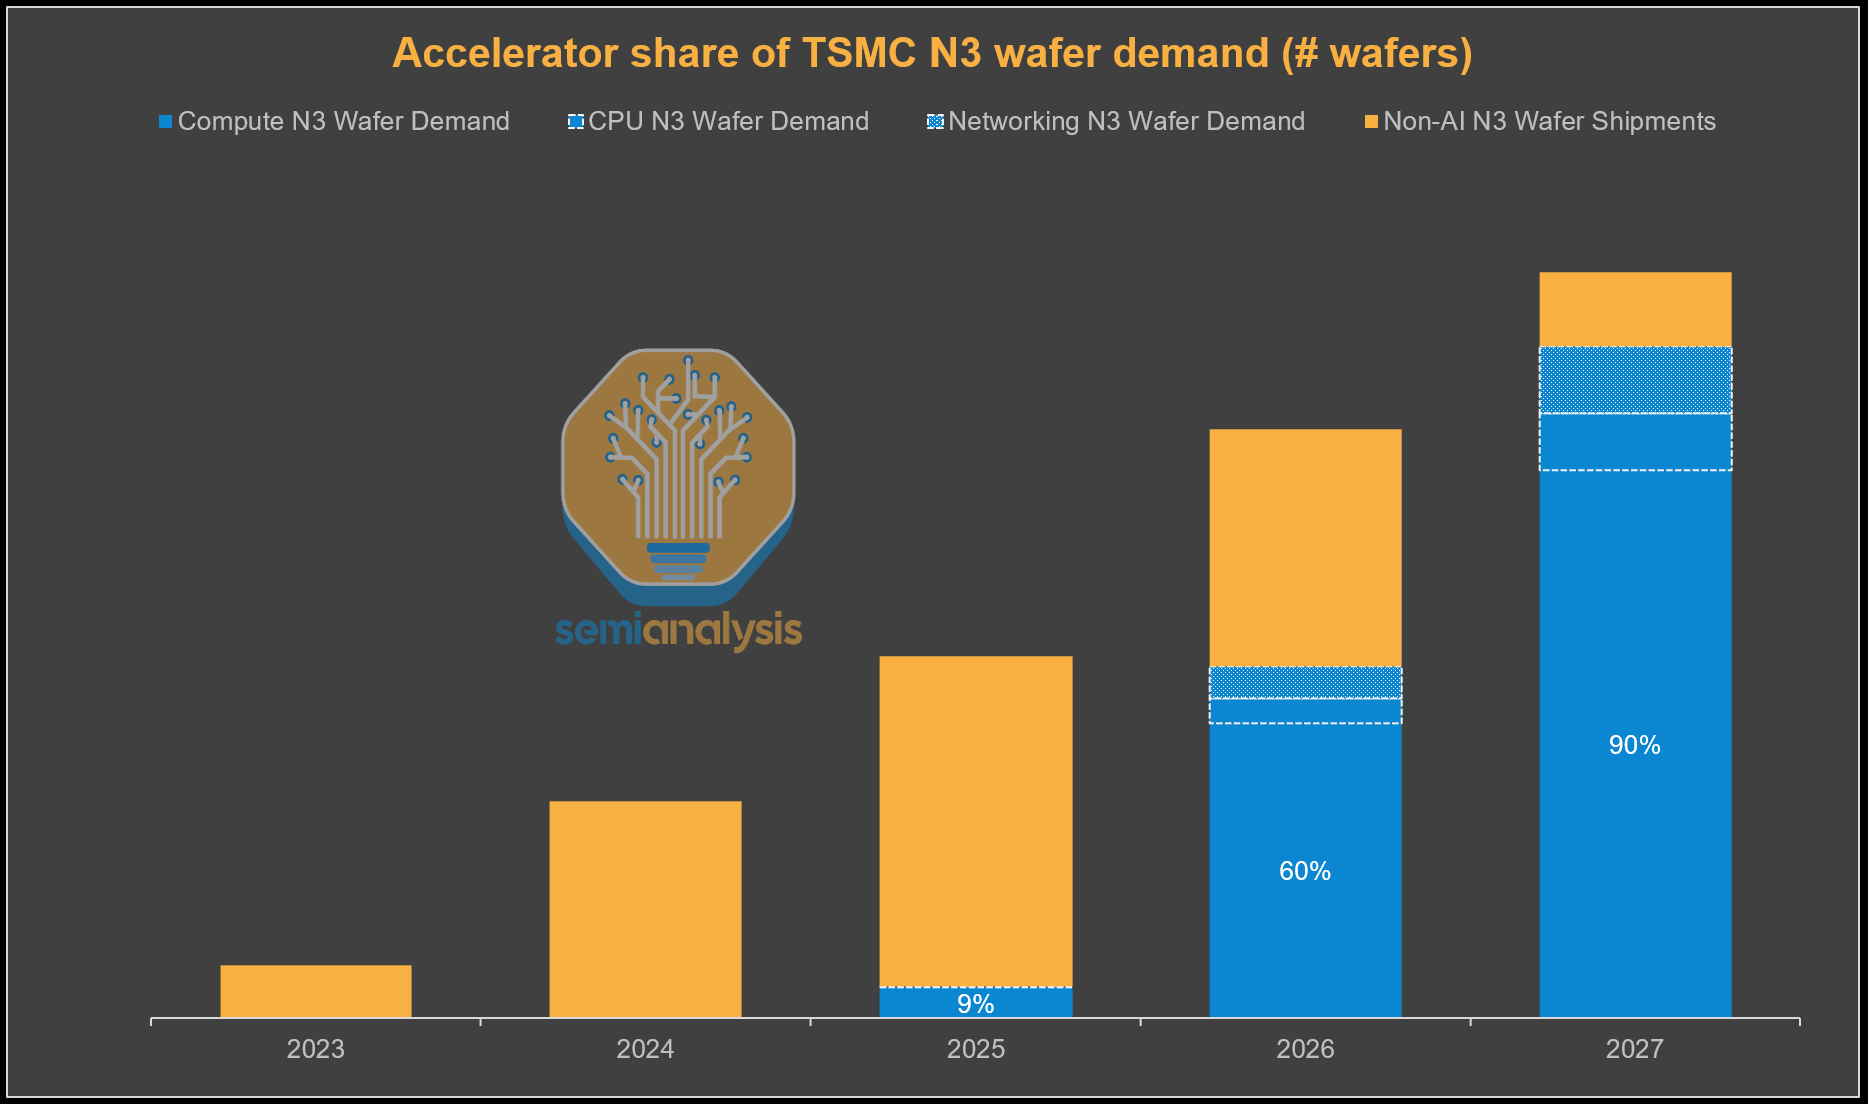
At the same time, compute supply remains structurally constrained. Upstream bottlenecks in memory and leading-edge wafers continue to limit availability, with N3 utilization expected to exceed 100% in the second half of 2026 and DRAM fabs already running above 90% utilization. There is no meaningful relief in sight.
TSMC could raise prices materially, but they haven’t. This is a strategic error on their part. If not increasing prices, they could at least demand larger prepayments.
The current dynamics within the compute market suggest that if current trends continue, the value generated by the overwhelming token end demand will continue accruing to AI Labs, Hyperscalers, Inference Providers, Neoclouds and Memory Vendors.
AI labs are capturing a disproportionate share of the value being created, driven by strong end demand, rising token monetization, and increasingly favorable unit economics. At the same time, Nvidia’s pricing framework has not fully adjusted to reflect this shift, even as its hardware remains the critical bottleneck enabling that value creation. Despite rising token monetization and increasingly favorable unit economics, Nvidia compute is still the bedrock for enabling that value creation.
Demand for Nvidia systems remains extremely strong across all tiers, with buyers willing to lock in long-term contracts and accept higher pricing to secure capacity. Even with alternative hardware options, Nvidia retains a clear advantage in ecosystem maturity, software stack, and deployment reliability. For many workloads, especially at the frontier, substitutes are not yet fully interchangeable.
Rubin, set to launch in 2H26, sits at the center of these dynamics. It delivers a step-function improvement in performance but also embeds a much larger memory subsystem at a time when memory is the tightest constraint in the supply chain. DRAM pricing has already moved sharply higher and is likely to remain elevated, making memory the primary driver of system cost.
In this context, Nvidia has room to increase pricing, particularly for systems like Rubin that deliver step-function performance gains. The incremental value created at the system level far exceeds the incremental cost, especially when viewed through $/FLOP or end workload economics.
This creates a clear disconnect. The market has structurally shifted, with demand scaling faster and more persistently than supply can respond. Yet Nvidia’s pricing framework remains anchored to prior assumptions, rather than adjusting to reflect the increased value its systems now deliver.
Put simply, even if Nvidia raises server pricing and infrastructure providers increase compute pricing, demand would remain intact. Buyers are optimizing for access to compute, end users are optimizing for access to as much tokens as possible, and both are securing capacity at all costs - marginal cost optimization is not their primary concern today.
SOCAMM Pricing: Nvidia’s Next Margin Lever
The next question after whether Nvidia can raise prices is where within the system it is most effective to do so.
At the system level, memory is the most natural point of control. Rubin-class systems embed significantly more memory into an already constrained supply chain, and unlike compute, memory can be more cleanly segmented and continuously repriced.
This is because memory on VR NVL72 is a socketed LPDDR-based memory solution called SOCAMM (System-On-Chip Attached Memory Module). SOCAMM is designed for Nvidia’s rack-scale systems, enabling higher capacity, modularity, power efficiency, and independent pricing of memory alongside compute.
This makes SOCAMM one of the most important variables in understanding Nvidia’s pricing strategy. Two factors ultimately determine system-level pricing outcomes: the cost Nvidia secures for SOCAMM, and the markup applied when reselling that memory to customers. Developing a precise view of Nvidia’s pricing and BoM for its rack-scale systems is not an easy task, given the complexity of its “extreme co-design” approach and intricate supply chain dynamics.
This is why SemiAnalysis provides an industry-leading breakdown through our VR NVL72 BoM and Power Budget Model. Furthermore, there are two swing factor at play when determining memory pricing to end customers:
The price Nvidia secured for SOCAMM2, and
The markup Nvidia applies to SOCAMM when selling to customers,
Both are key factors impacting the final pricing quote to the customers.
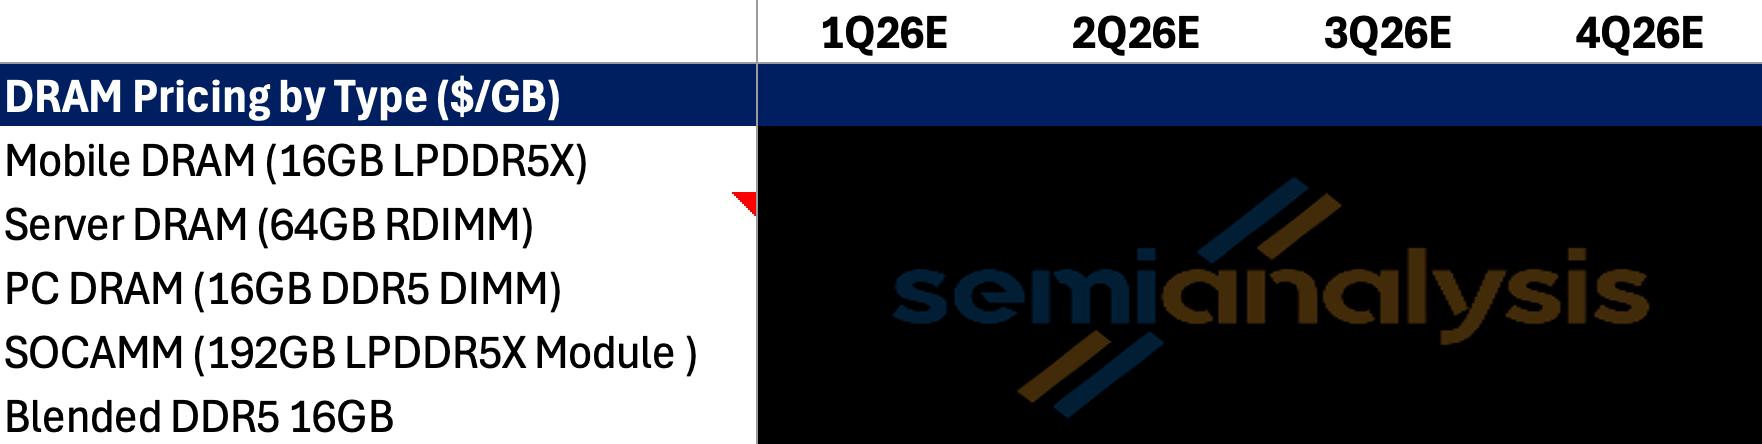
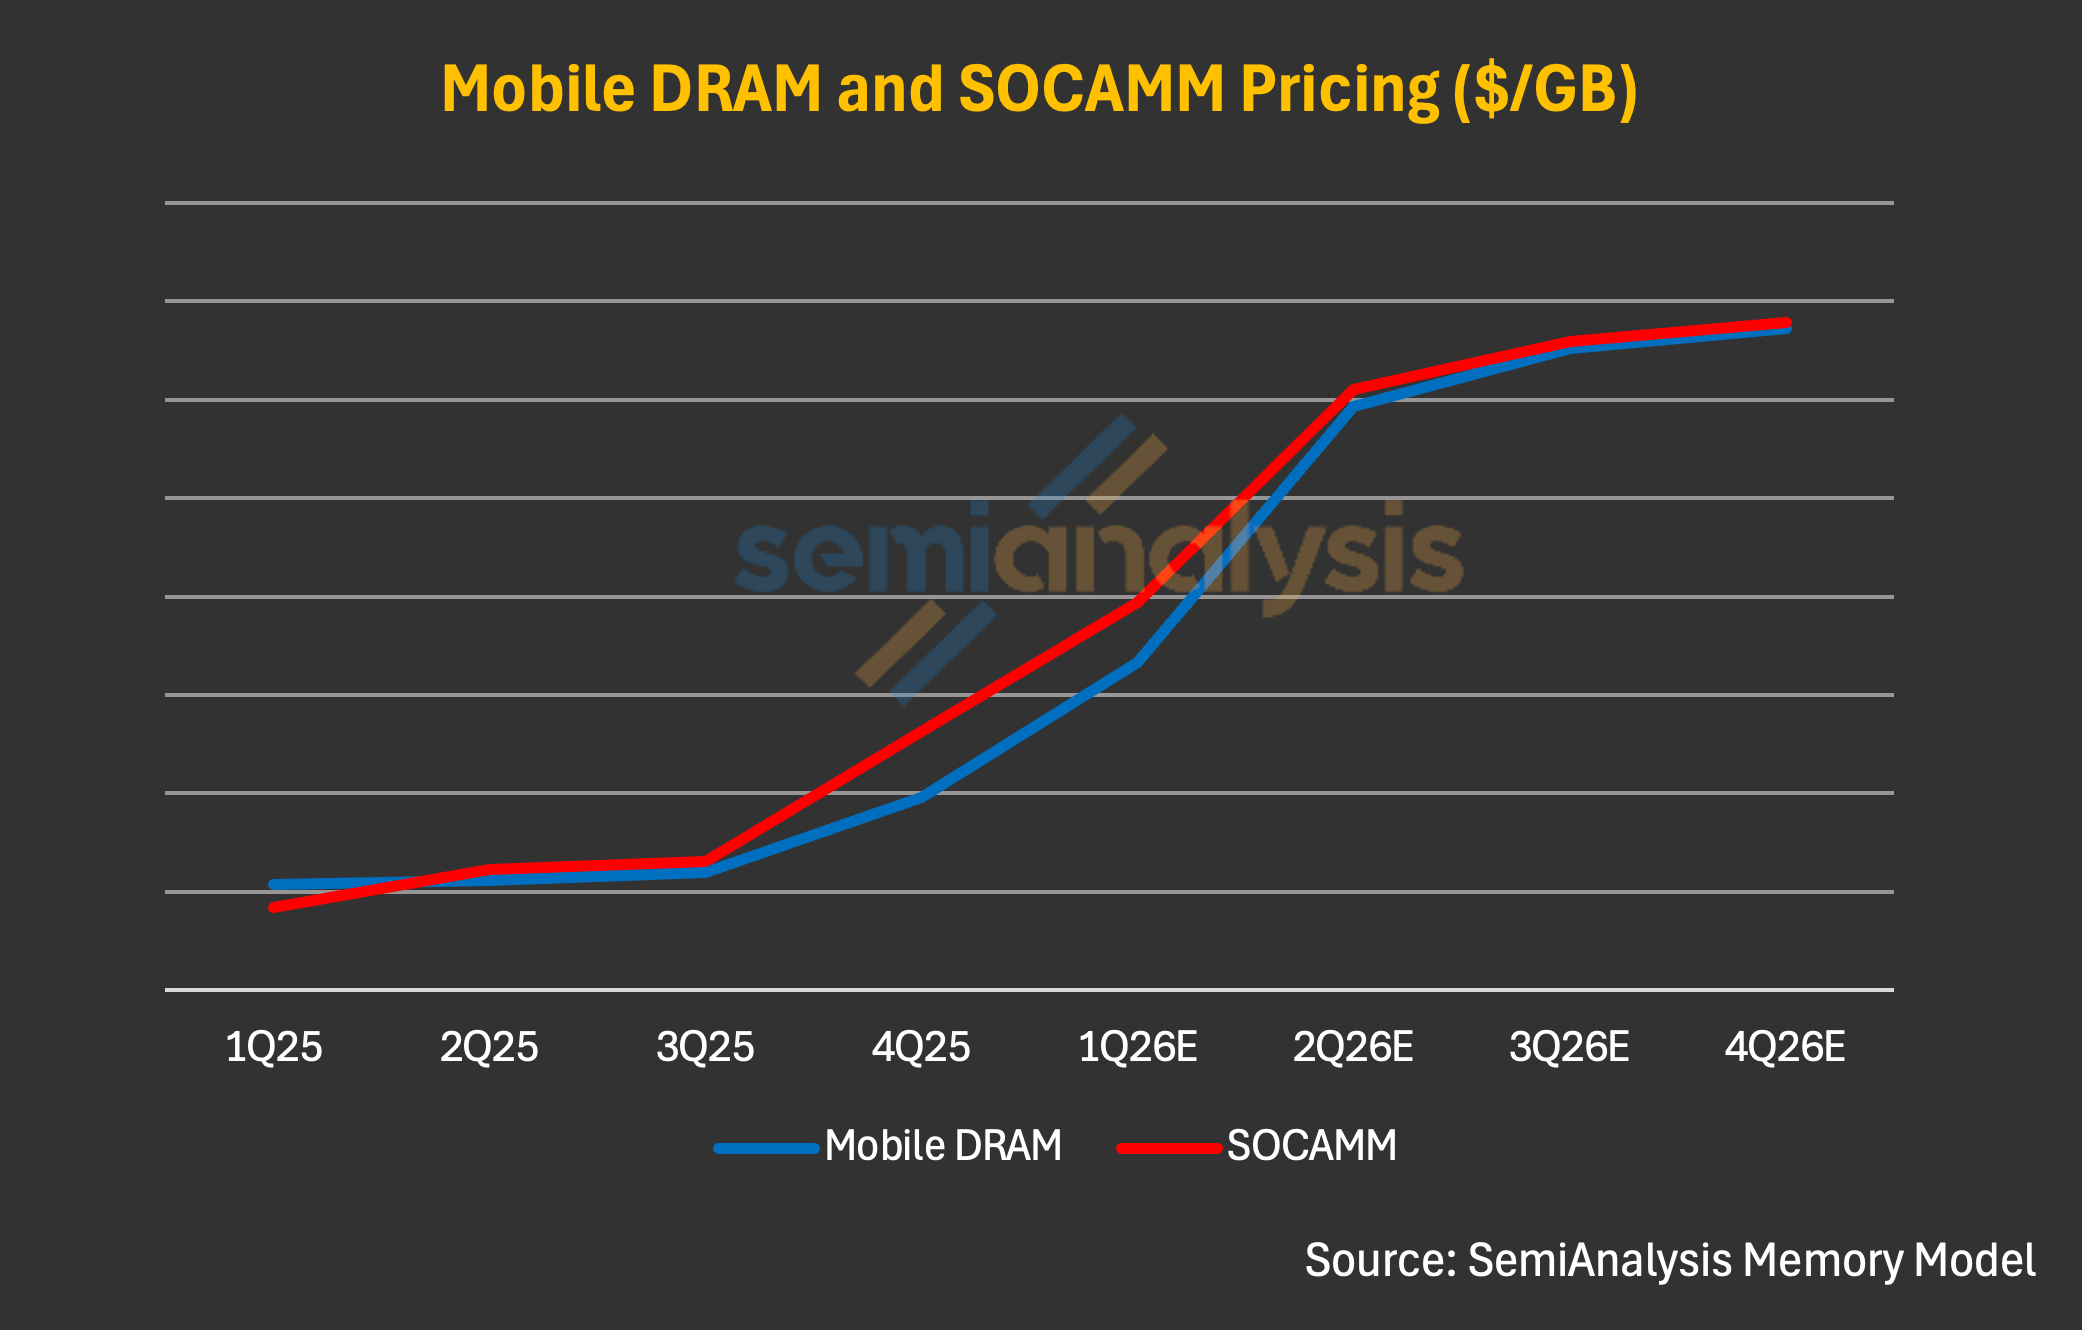
As of today, our Memory Model implies SOCAMM contract pricing paid by Nvidia at ~$8/GB in 1Q26, a sharp step-up from 4Q25 to 1Q26. This jump was driven by the broader LPDDR5X pricing surge in 1Q and overall memory supply tightness. We anchor this estimate based on two points:
SOCAMM should price at a premium to mobile LPDDR5X (~$6–7/GB in 1Q26) given higher development complexity and longer cycle times.
The step-up in mobile LPDDR5X pricing should transmit to SOCAMM in the same periods, as constrained LPDDR5X and broader commodity DRAM supply is shared between consumer and server demand.
Industry chatter suggests that Nvidia has secured substantial SOCAMM volume for both its GB300 NVL 72 and VR NVL72 systems, under a long-term agreement (LTA) format, which we outlined in our institutional note for Memory Model earlier. As the only scaled SOCAMM customer today, and arguably the most critical buyer in memory, Nvidia likely benefits from preferential access and pricing, and we believe Nvidia’s past track record speaks for itself when it comes to its ability to leverage the supply chain.
That said, broader DRAM pricing dynamics should still inevitably flow through. Further price hike in mobile LPDDR5X pricing in coming quarters should still be a critical pricing reference for SOCAMM, and SOCAMM should reprice accordingly given limited LPDDR5 allocation volume. We believe exit ’26 pricing for SOCAMM could exceed $13/GB, which is roughly in line with mobile DRAM pricing expected by the end of this year; accordingly, we view ~$10/GB as a reasonable assumption for Nvidia’s SOCAMM cost.
One key question some may raise is: On what basis should customers accept further price increases and margin expansion from Nvidia, and what rationale can Nvidia credibly use to justify such a position? We think it is reasonable for Nvidia to charge 60% margin on SOCAMM for three reasons:
First, the current environment plays in Nvidia’s hand. Memory supply is constrained everywhere, and Nvidia has secured the most volume (of SOCAMM at least) versus its customers and peer competitors, which should allow the company to leverage this supply chain edge.
Second, VR NVL72 is still by far the best platform coming to market with regards to performance per TCO, and production of the system backed by a complicated but mature supply chain. To maximize the investment in compute, customers might have little choice but to accept Nvidia’s new pricing method.
Lastly, since Nvidia, as the procurer of SOCAMM2, is facing a material price hike in the first place, we think it is not unreasonable to assume that customers will accept Nvidia’s gross margin taken on top of SOCAMM2 cost for VR NVL72.
Capex Per Watt Trends from GB300 to VR NVL72
For GB300, DRAM was bundled into the board and marked up at ~75% gross margin, making the margin charged on the memory on the board consistent with what is implicitly priced for the Blackwell systems.
For Rubin, we initially assumed the same dynamic, with the understanding that Nvidia would target an overall system Gross Margin in the mid-70s. As such, our initial Bill of Material (BoM) modeling applied a consistent margin throughout the entire Strata board leaving SOCAMM margin at the same mid 70s margin.
However, because SOCAMM2 is a socketed module in Rubin whereas GB300 uses an ordinary LPDDR5X module that is soldered onto the board, memory can be disaggregated and quoted separately from the base system. This allows Nvidia to explicitly price memory as its own line item, rather than embedding it within board-level pricing. Importantly, this also introduces an additional value for Nvidia to adjust margin on the SOCAMM2 while keeping margin on the board the same. Even if Nvidia initially absorbs some of the memory cost inflation, it retains the ability to offset this by charging higher system-level margins to customers.
Hence, we would have expected overall capex per watt to rise as we transition from GB300 to VR NVL72. Yet to the contrary – current pricing only works out to a slight creep up in capex per watt from $37.4/W for GB300 to $38.1/W for VRNVL72. This is despite chip TDP almost doubling from GB300 to VR NVL72 (1400W to 2300W), and a material increase in FLOPs.
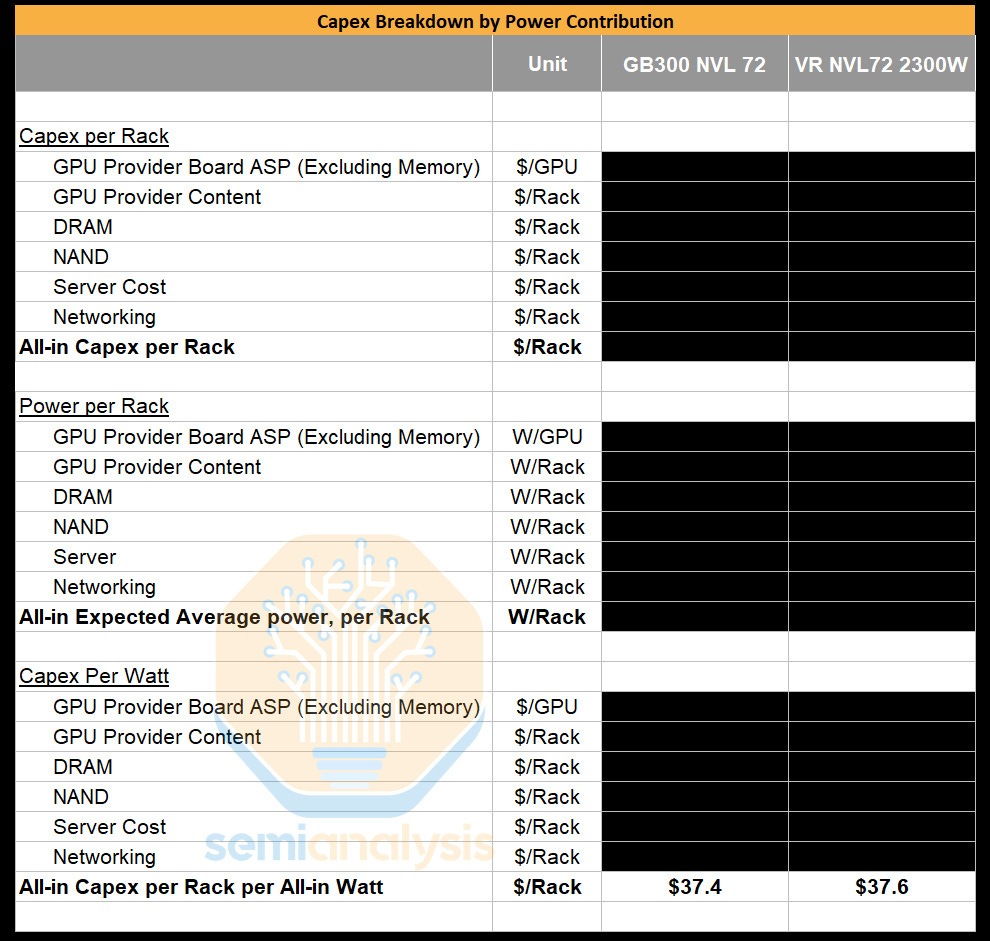
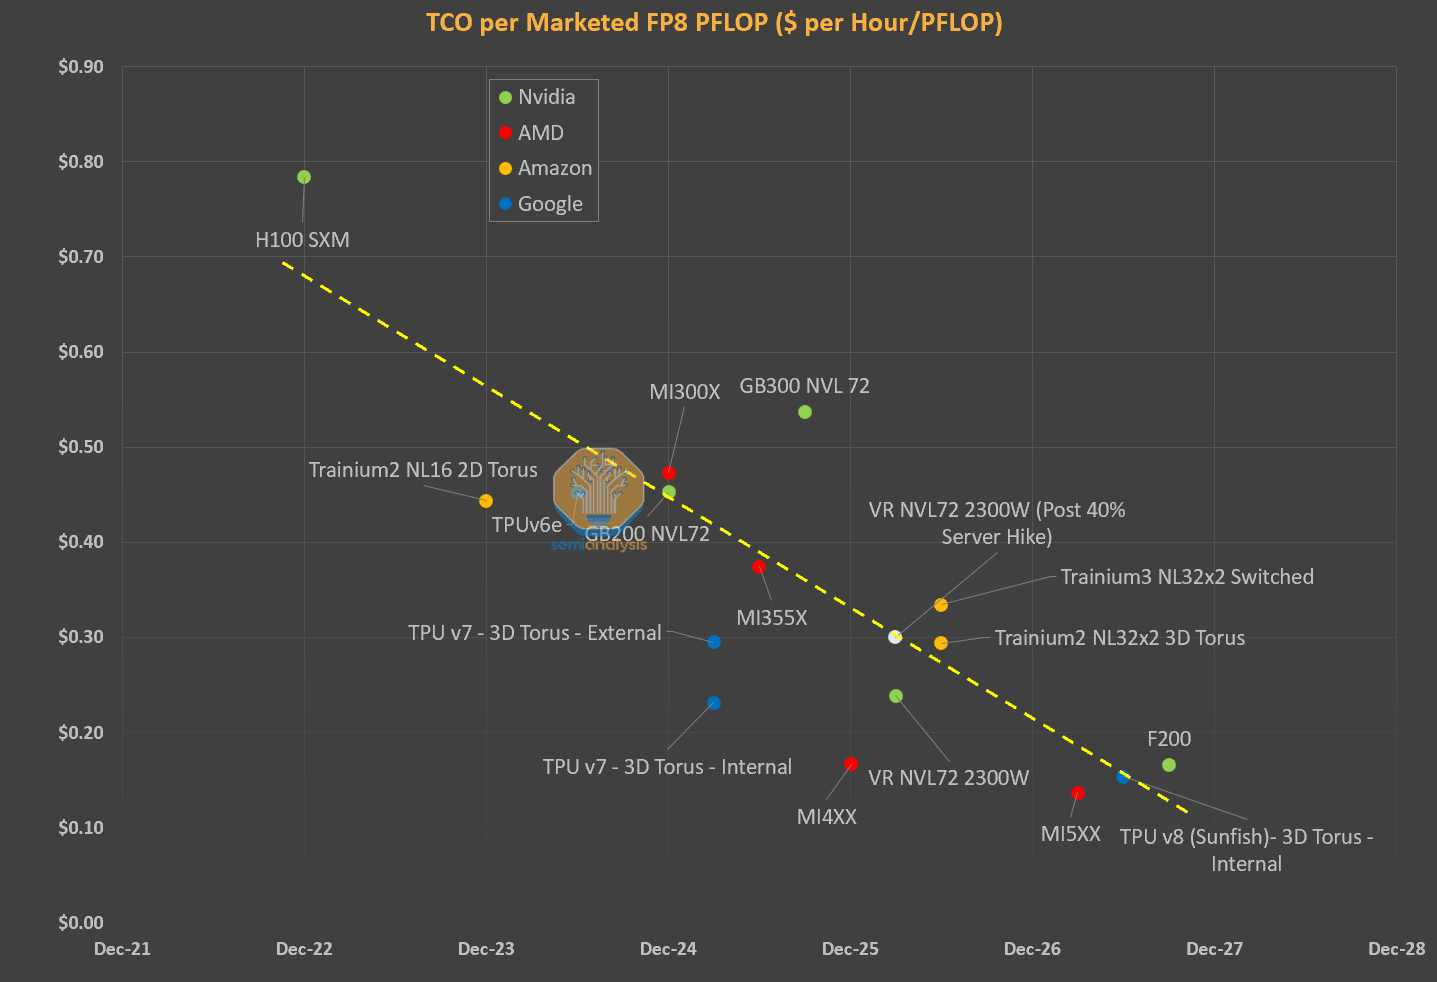
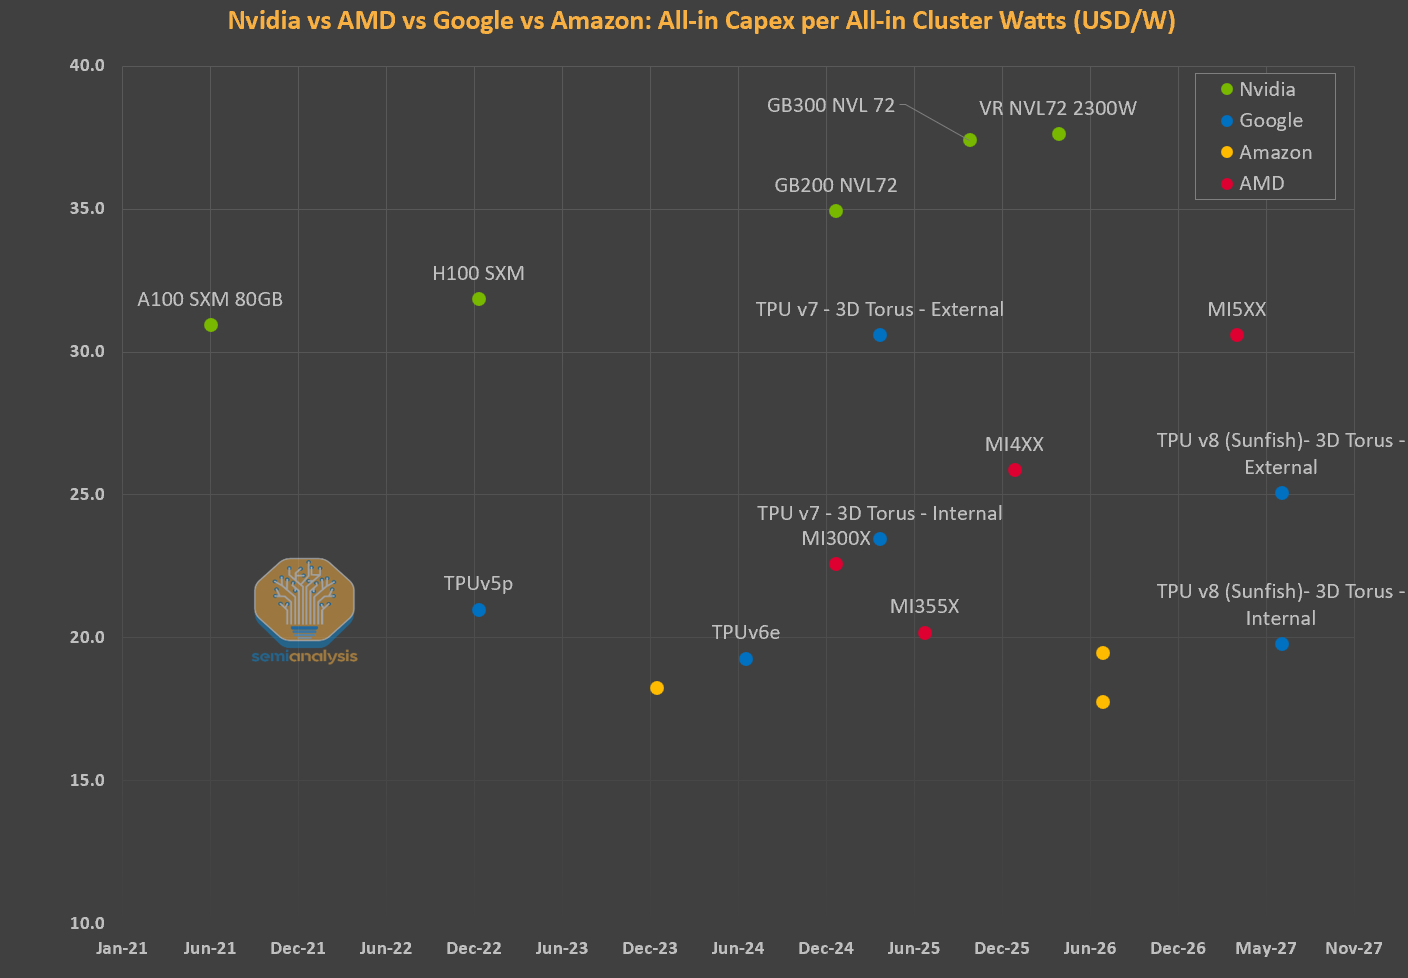
This is unusual relative to broader trends in server capex per watt. Across AMD, Nvidia, and custom ASICs, capex per watt typically increases generation over generation as improvements in performance per watt allow vendors to capture more value at the system level. Thus, it is puzzling to us that $/GW appears to remain largely stagnant from GB300 to VR NVL72. This is even more unusual given the step up in performance/W from GB300 to VR NVL72 is more than double.
Nvidia also has the opportunity to price discriminate on memory more than they do on the GPU because memory isn’t an anti-trust concern whereas the GPU is.
Networking as a Vector for Price Discrimination
Today, Nvidia does not heavily differentiate on GPU pricing across customers within a given strata. Core components are generally sold at similar prices across the ecosystem, be it to Hyperscalers, Neoclouds, Emerging Neoclouds, sovereigns or enterprises. This creates a relatively uniform pricing structure for the core GPU and memory components, even in a market where willingness to pay varies significantly.
While GPU pricing is relatively uniform, Nvidia traditionally price discriminates on networking equipment, offering Neoclouds and other marginal cloud players a price point that is at significant premium to hyperscalers. We conducted our own survey with GPU cloud providers and found that, for instance, the SN5610 could be priced 2x more for a Neocloud as opposed to for hyperscalers. Hyperscalers clearly have stronger bargaining power but this is not because they are buying more switches and transceivers from Nvidia.
Neoclouds lack the scale and networking expertise to customize and cost-optimize their networking clusters and so they ultimately prefer Nvidia’s turnkey solutions. Hyperscalers work directly with OEMs and ODMs and have the networking engineering bench to deploy more cost effective solutions that may not be turnkey deployments and thus are a heavier lift to deploy properly.
The disparity in networking costs between a Neocloud and hyperscaler becomes less significant, however, on a total cluster capital cost basis. For two comparable clusters, a 94% increase in networking cost for a Neocloud versus a hyperscaler translates to only to a 10% increase in all-in capital cost for a full rack-scale server. This excludes other variables such as power, utilities and operations, which will further erode cost differences attributable to networking equipment pricing disparity.
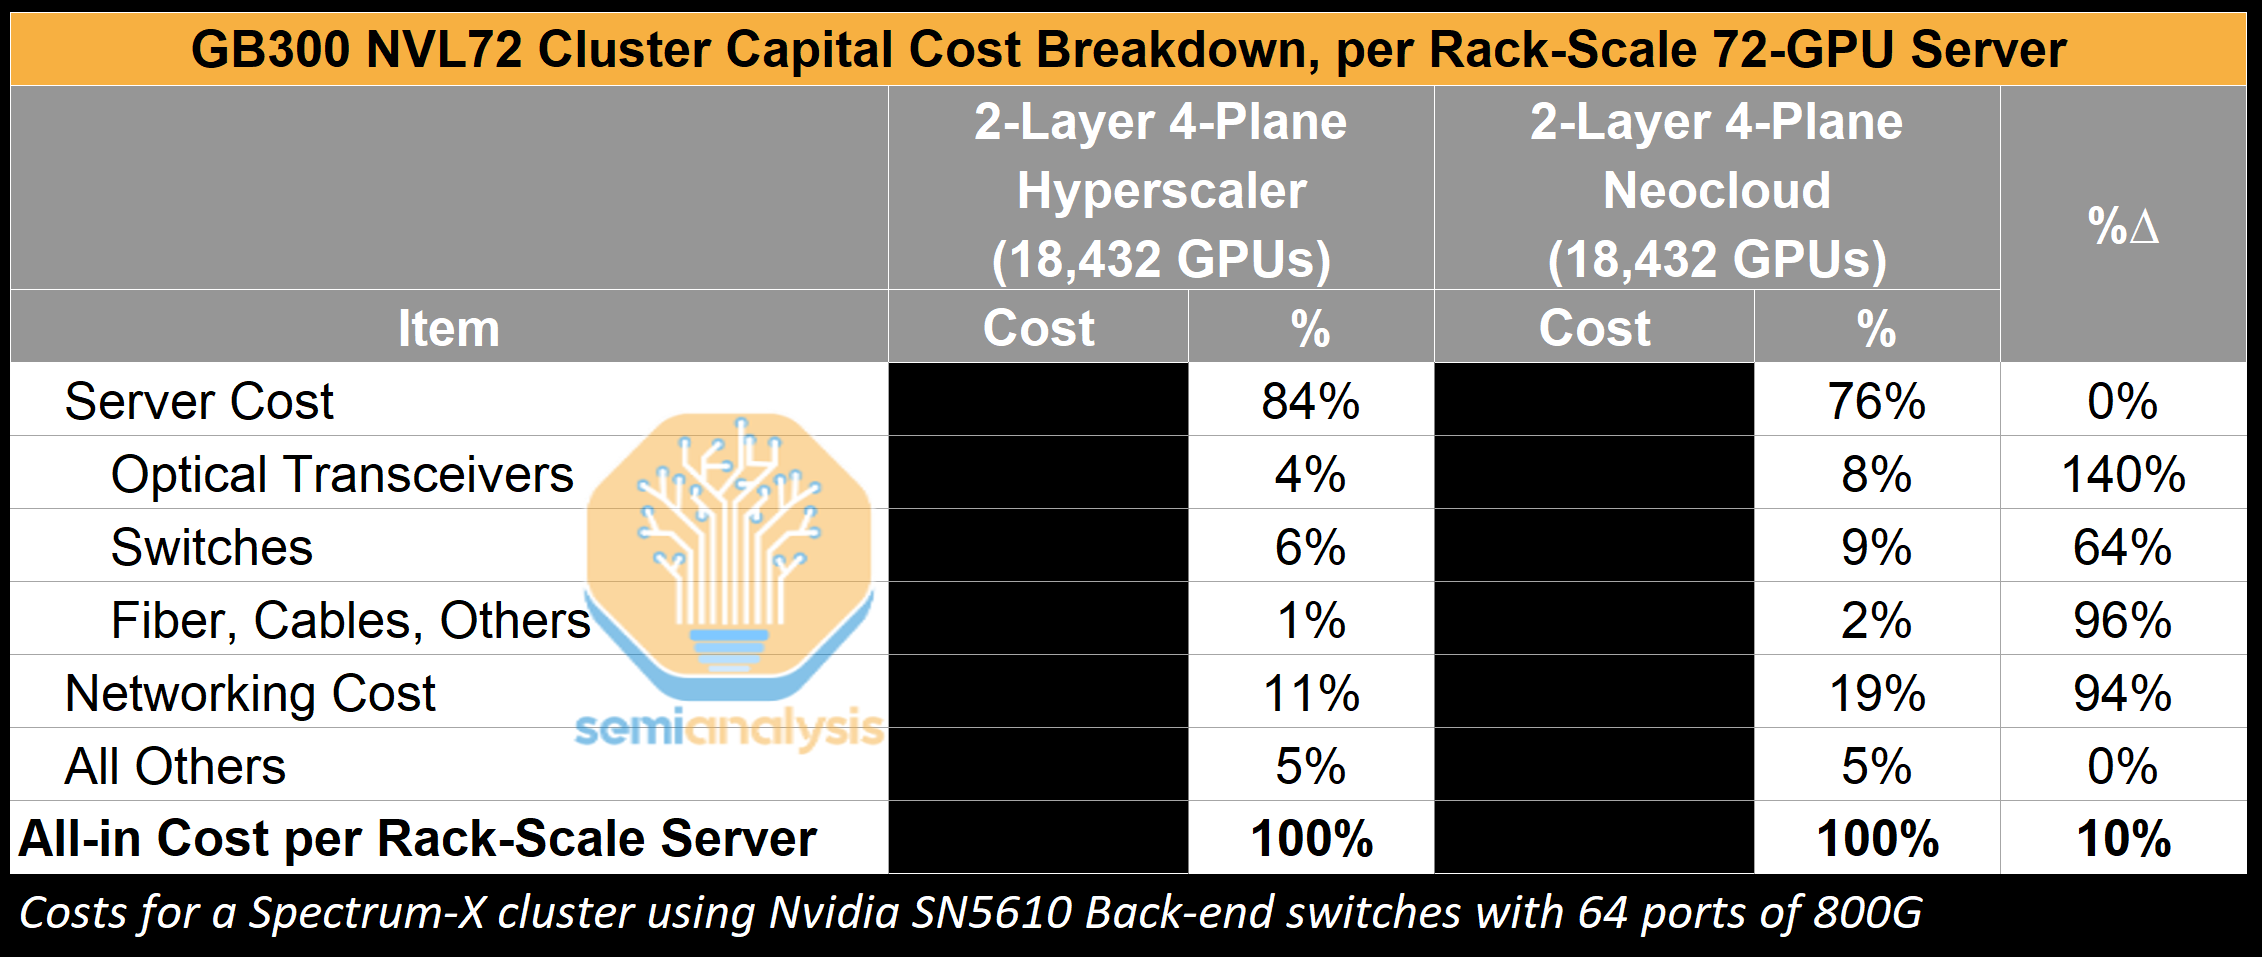
Though this is a great case study demonstrating how Nvidia is pricing its solutions to value, the current price gap between Neoclouds and Hyperscalers is meaningful, leaving limited room for Nvidia to pull this lever further.
Nvidia as the Central Bank of AI
One explanation behind Nvidia restraint’s in pricing thus far might be a combination of regulatory and strategic reticence.
Nvidia’s position in the AI compute stack is already under increasing antitrust scrutiny, given its dominance across GPUs, interconnect, and software. In this environment, aggressively repricing systems to fully capture the value delivered risks drawing further attention, particularly if it results in outsized margin expansion while downstream AI labs are also generating significant profits. Holding pricing closer to prior frameworks can help avoid signaling excessive pricing power in a supply-constrained market.
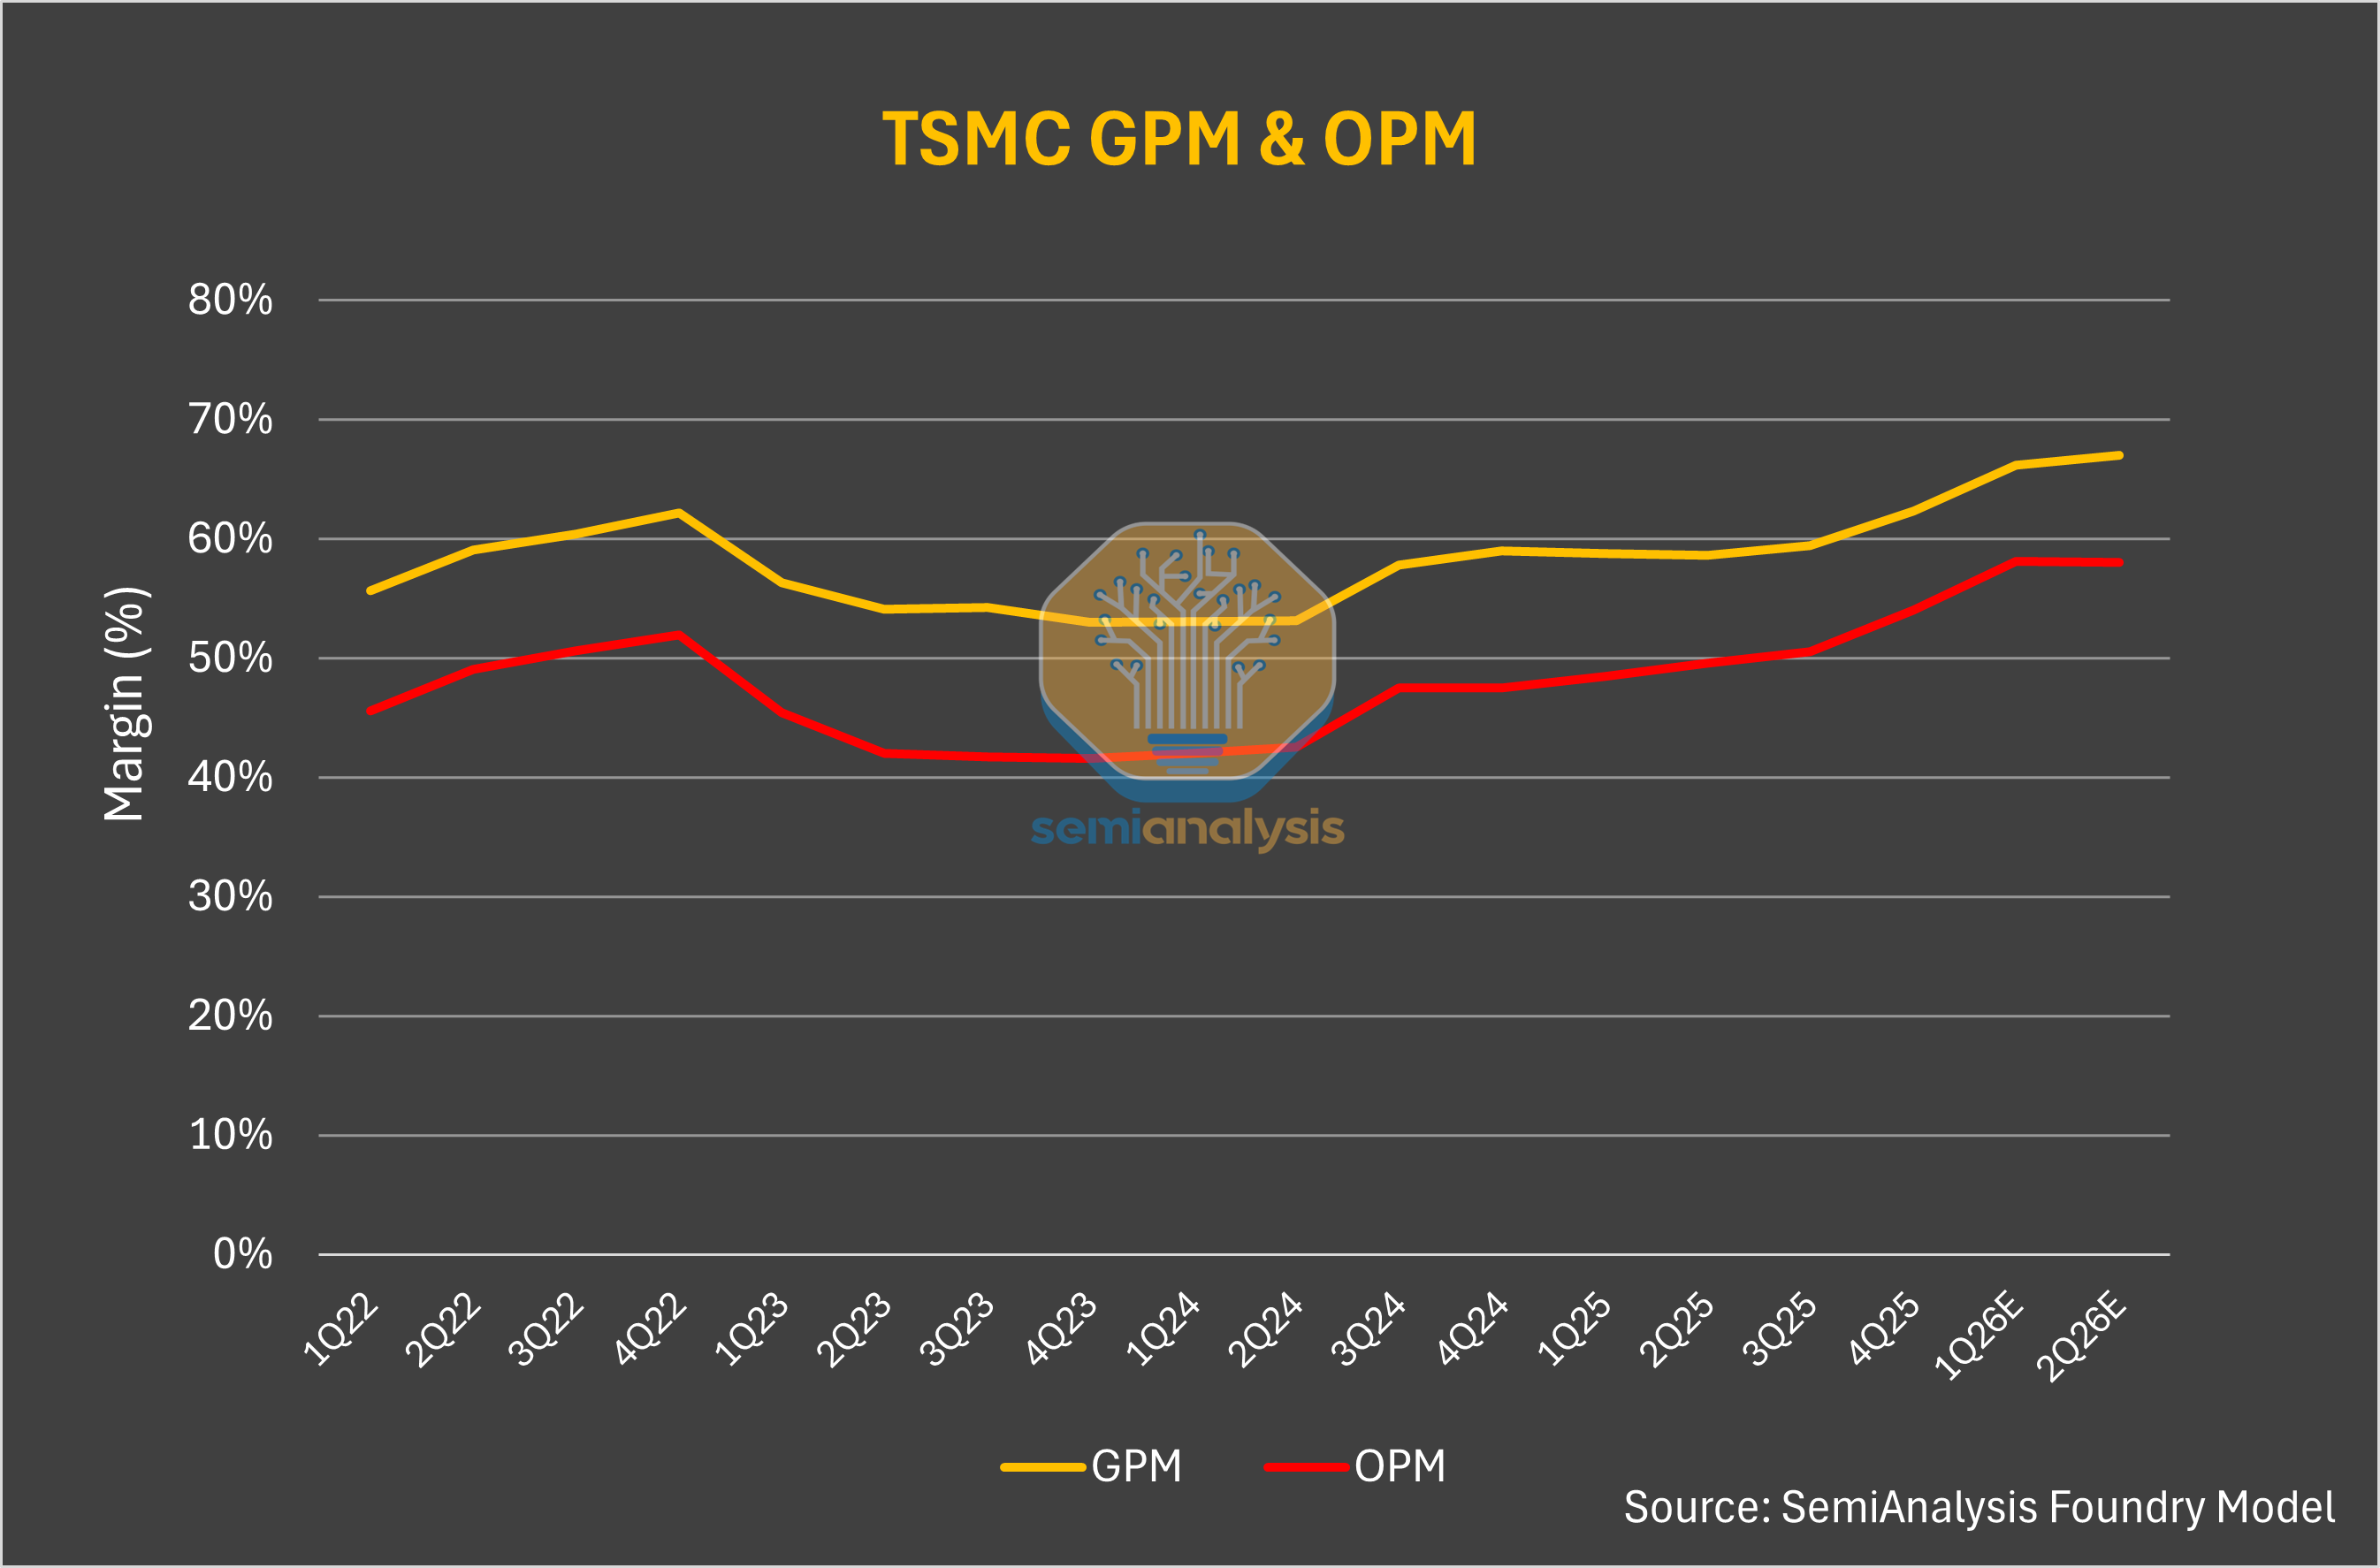
This behavior is not without precedent. TSMC has historically taken a similar approach. Even while operating at full utilization and acting as the bottleneck for advanced-node supply, TSMC has generally avoided fully pricing to scarcity. Instead, it has prioritized long-term relationships and ecosystem stability over extracting maximum short-term margins, in part to avoid regulatory and customer backlash.
Nvidia appears to be following a comparable path. Rather than fully repricing Rubin systems to reflect both the increase in performance and the structural shift in memory costs, it is maintaining a more measured pricing approach. This balances margin expansion against regulatory risk, ecosystem dynamics, and the need to avoid accelerating customer diversification toward alternative compute platforms.
We made a similar point in our Nvidia as the central bank note. Nvidia is actively supporting the development of the broader ecosystem, ensuring long-term demand expansion rather than maximizing near-term extraction. Today, frontier labs benefit from Nvidia’s software-driven efficiency gains, but these improvements are not fully monetized at the hardware level. As a result, incremental value continues to accrue downstream despite Nvidia being the primary enabler. By taking the oxygen out of the room – Nvidia aims to ensure it remains the main protagonist in the AI era for the foreseeable future.
Yet - with Compute demand well over compute supply, why should those in control of the scarce resources not capture higher pricing and enjoy greater profitability?
TSMC, The Fairest and Most Just Company In The World
We’ve said that TSMC’s N3 capacity is even tighter. All major accelerator roadmaps have now converged on the N3 process node for this year and next year. Nvidia, Broadcom, Annapurna, MeidaTek and AMD are all fighting for more N3 wafer allocation from TSMC so that they can ship more compute to their customers. While N3 capacity is arguably the tightest constraint in the system, pricing remains relatively stable.
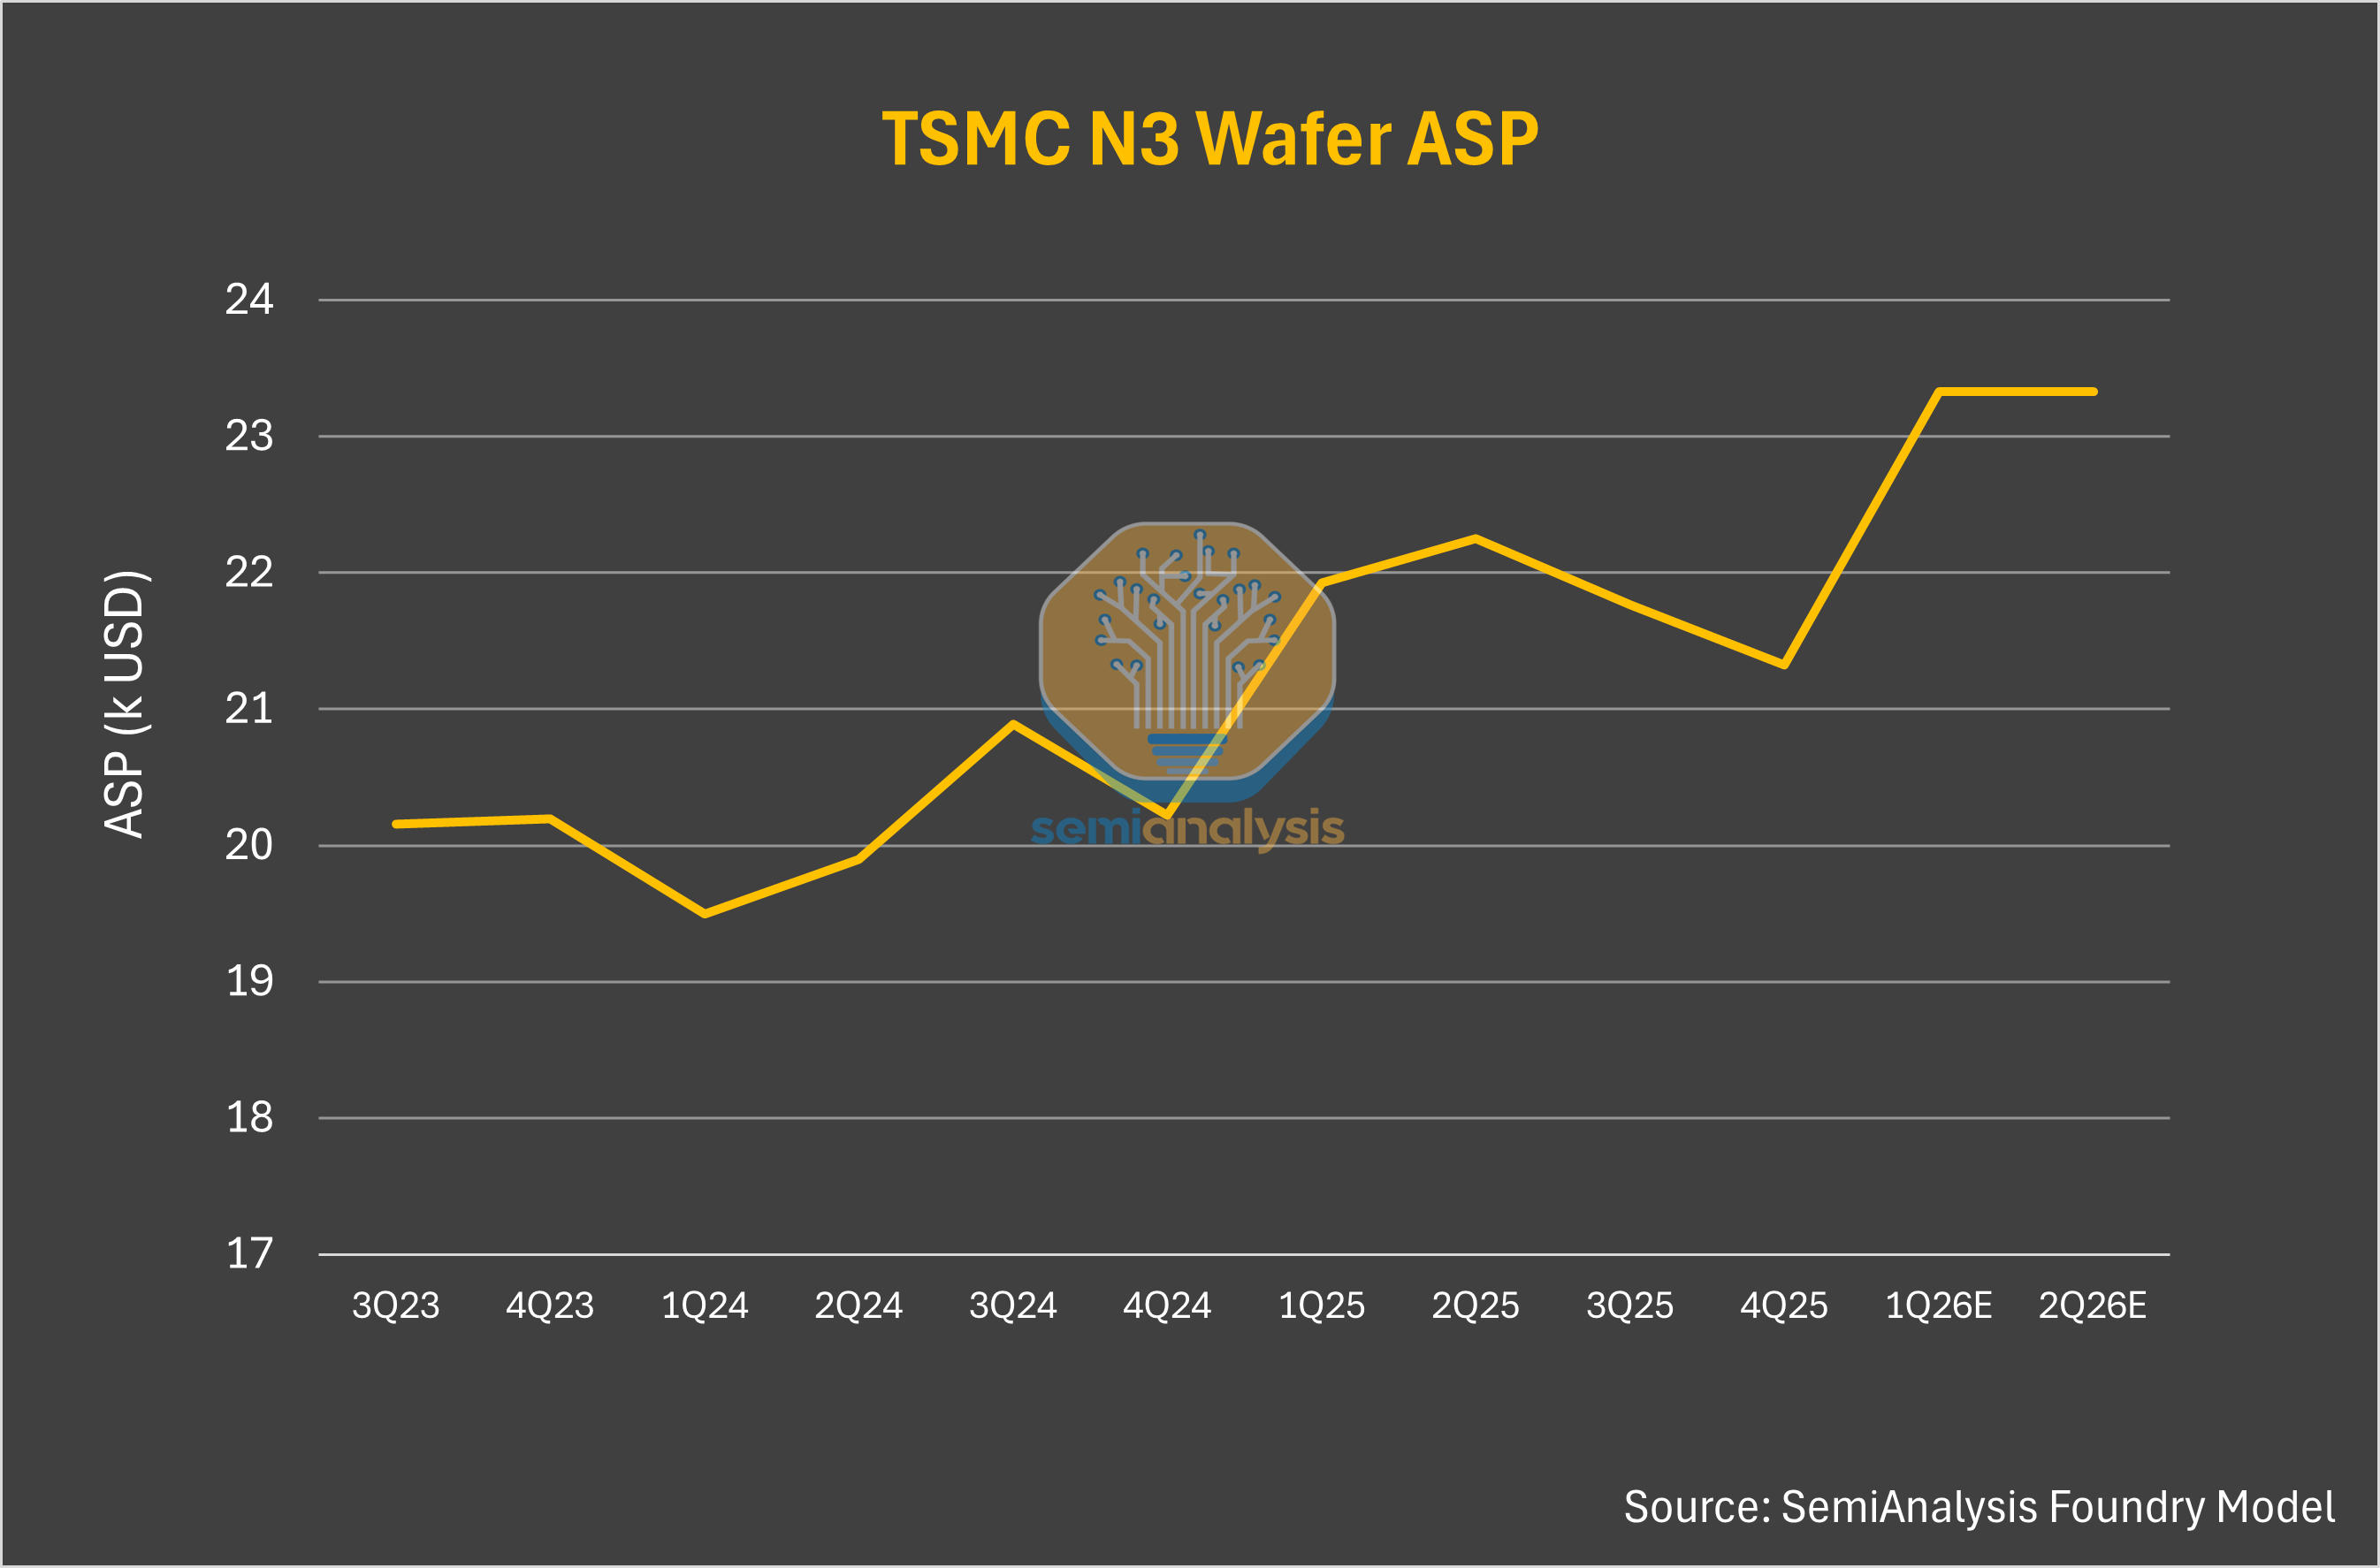
TSMC strategically looks to protect profitability through downcycles. The flipside is that this policy also blunts upside during upcycles. Regardless, TSMC is certainly leaving value on the table with all their major fabless customers enjoying very high gross margins that could be transferred over instead to TSMC.
However, TSMC could very much take a more aggressive posture on pricing, and customers would not only accept it but we would argue some would even welcome it. Nvidia would love to pay more for wafers if it means shutting out their competition who have less ability to pay up. After all, Jensen himself said in 2024 that TSMC should charge more for wafers and he meant it for this reason.
TSMC can also take a position of longer term agreements with guaranteed capacity commitments and prepayments in liu of major price increases. This is the more likely path.
We think Nvidia is starting to look a lot like TSMC.
Its greatest strength in this environment is procurement. Nvidia has secured disproportionate access to constrained upstream supply, particularly TSMC wafers, allowing it to serve demand that others cannot.
AI compute buyers such as Anthropic are therefore forced into Nvidia’s ecosystem, as alternative capacity from TPU and Trainium remains limited by the same upstream bottlenecks. Despite this structural advantage, Nvidia is not fully reflecting it in pricing.
For now, pricing for Nvidia remains anchored to cost-based frameworks. But this is unlikely to hold. As the return on investment for inference providers becomes clearer and more widely accepted, the focus will shift even more towards pricing to value. This reduces the scrutiny on pricing and gives GPU infrastructure providers room to move from cost-based to value-based pricing. Once that transition occurs, it creates space for Nvidia to move pricing higher and capture more of the value delivered at the system level – the manifestation of the pie growing.
Triangulating VR NVL72 Rental Pricing: Cost-Based vs Value-Based Approaches
There are two main approaches to pricing:
Cost-based Pricing and,
Value Based Pricing.
The Cost-based pricing approach starts with the premise that GPU deployments will only occur if these projects they meet a minimum return threshold for Neoclouds. If returns fall below this level, capacity will not be deployed until pricing adjusts to meet that hurdle.
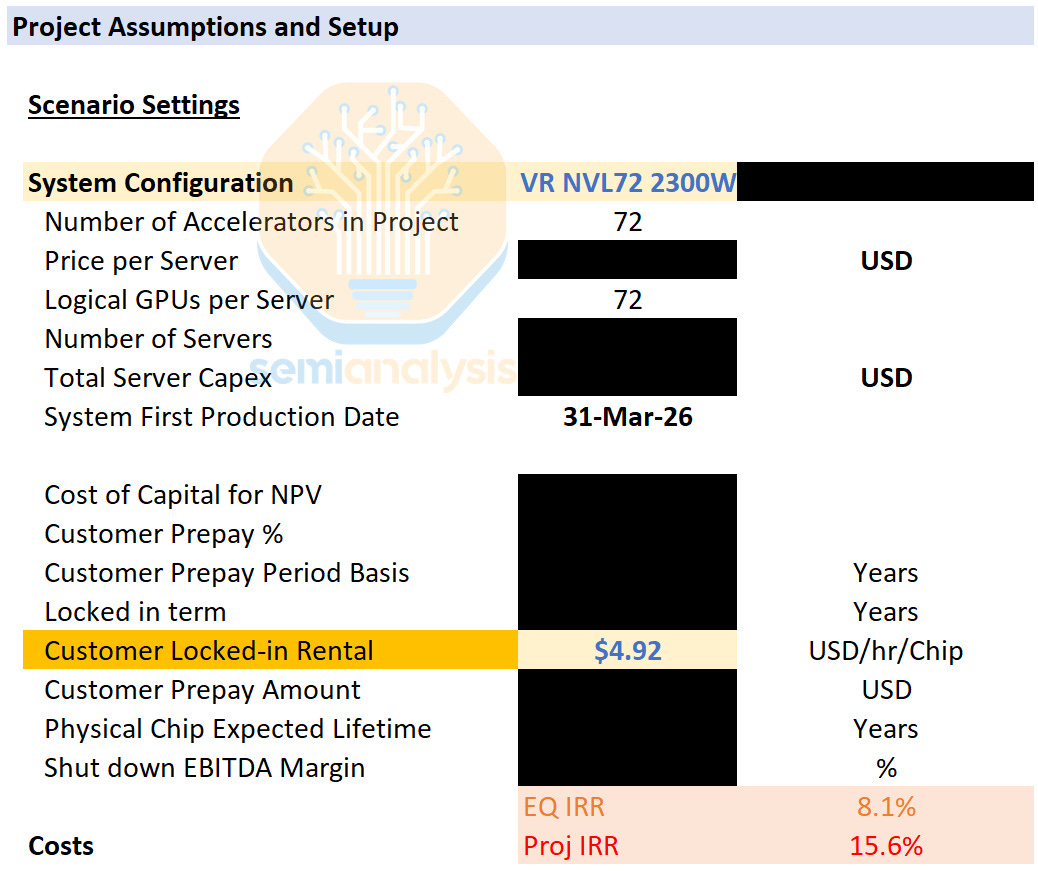
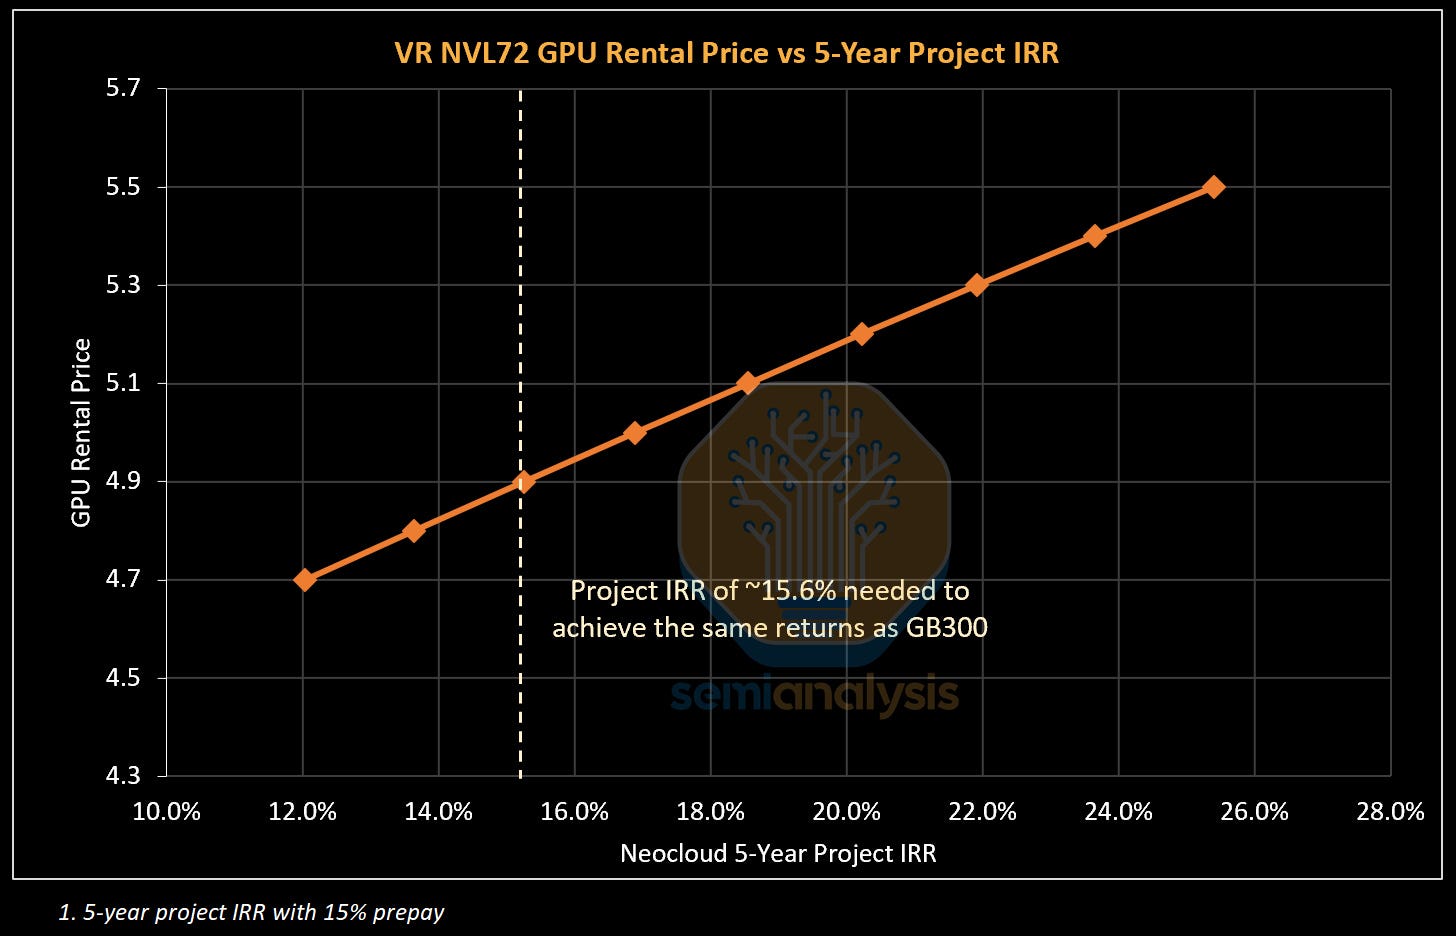
Therefore, the rental price charged under a cost-based framework is the price that earns the Neocloud a project IRR above the minimum hurdle rate for deployment. Most projects today tend to earn a return of mid-to high teens IRR. An illustrative GB300 deployment today will likely have a project IRR of 15.6% over a 5-year period with a 15% prepay.
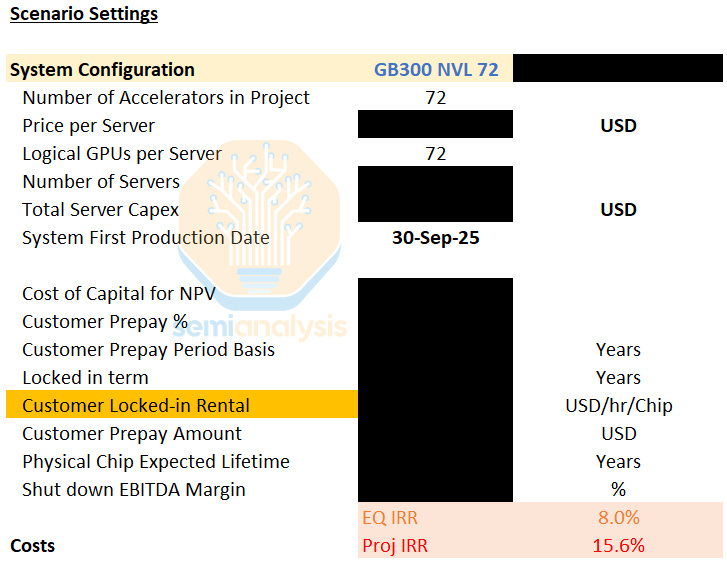
Neoclouds will aim for a similar IRR when deploying VR NVL72, which in turn determines what debut GPU rental prices for Vera Rubin might look like. With our all-in server cost for VR NVL72, a rental price of at least USD 4.92 per Hour per GPU rental price is required for a 5-year project with a 15% prepay to achieve the same project IRR hurdle of 15.6% that most GB300 projects use.
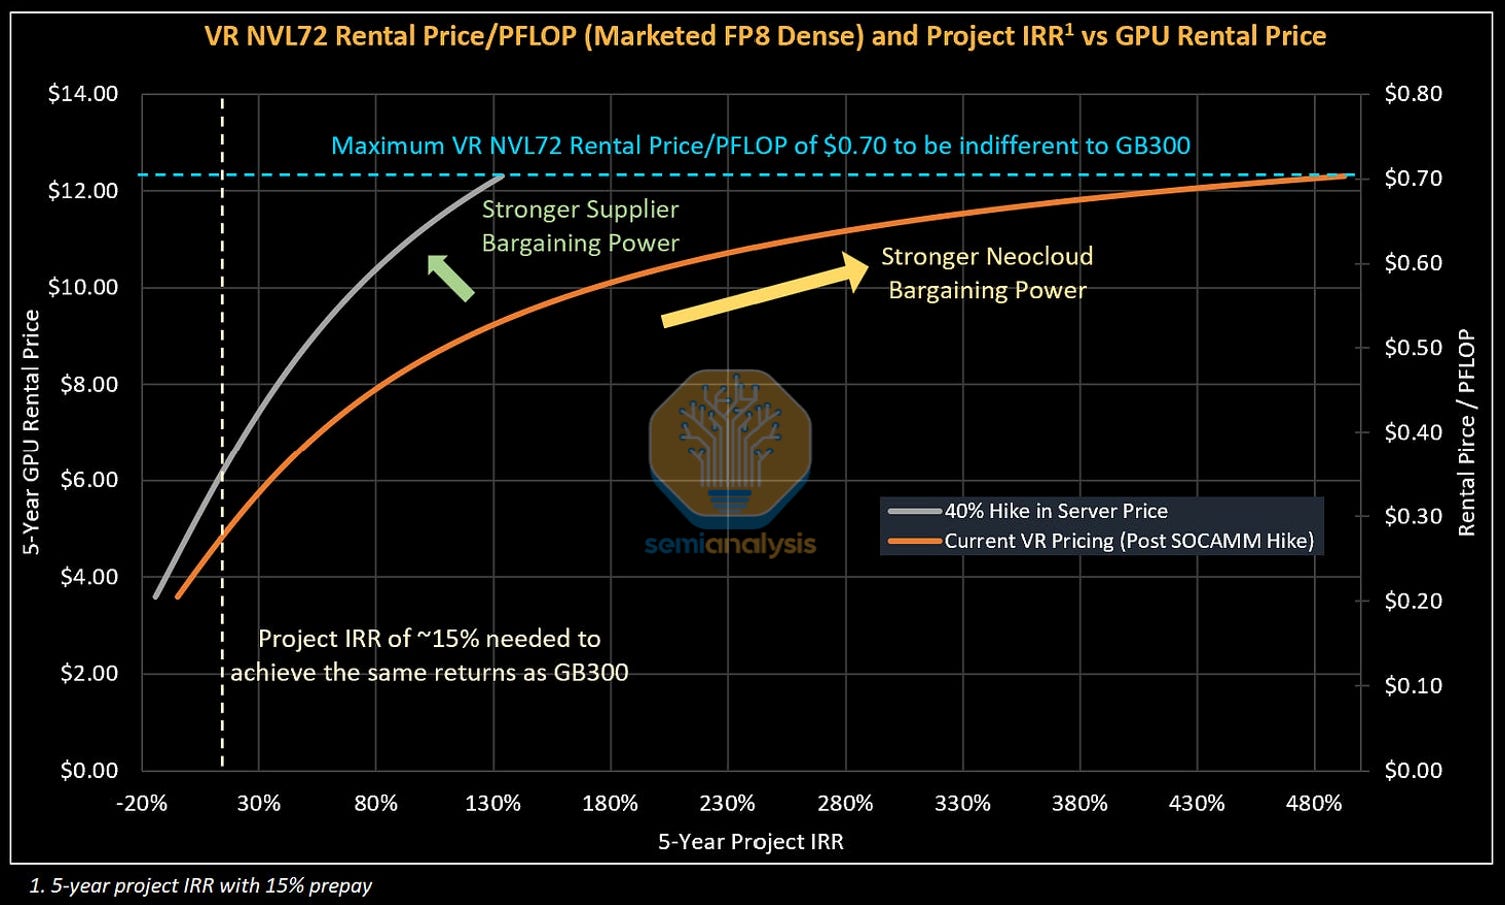
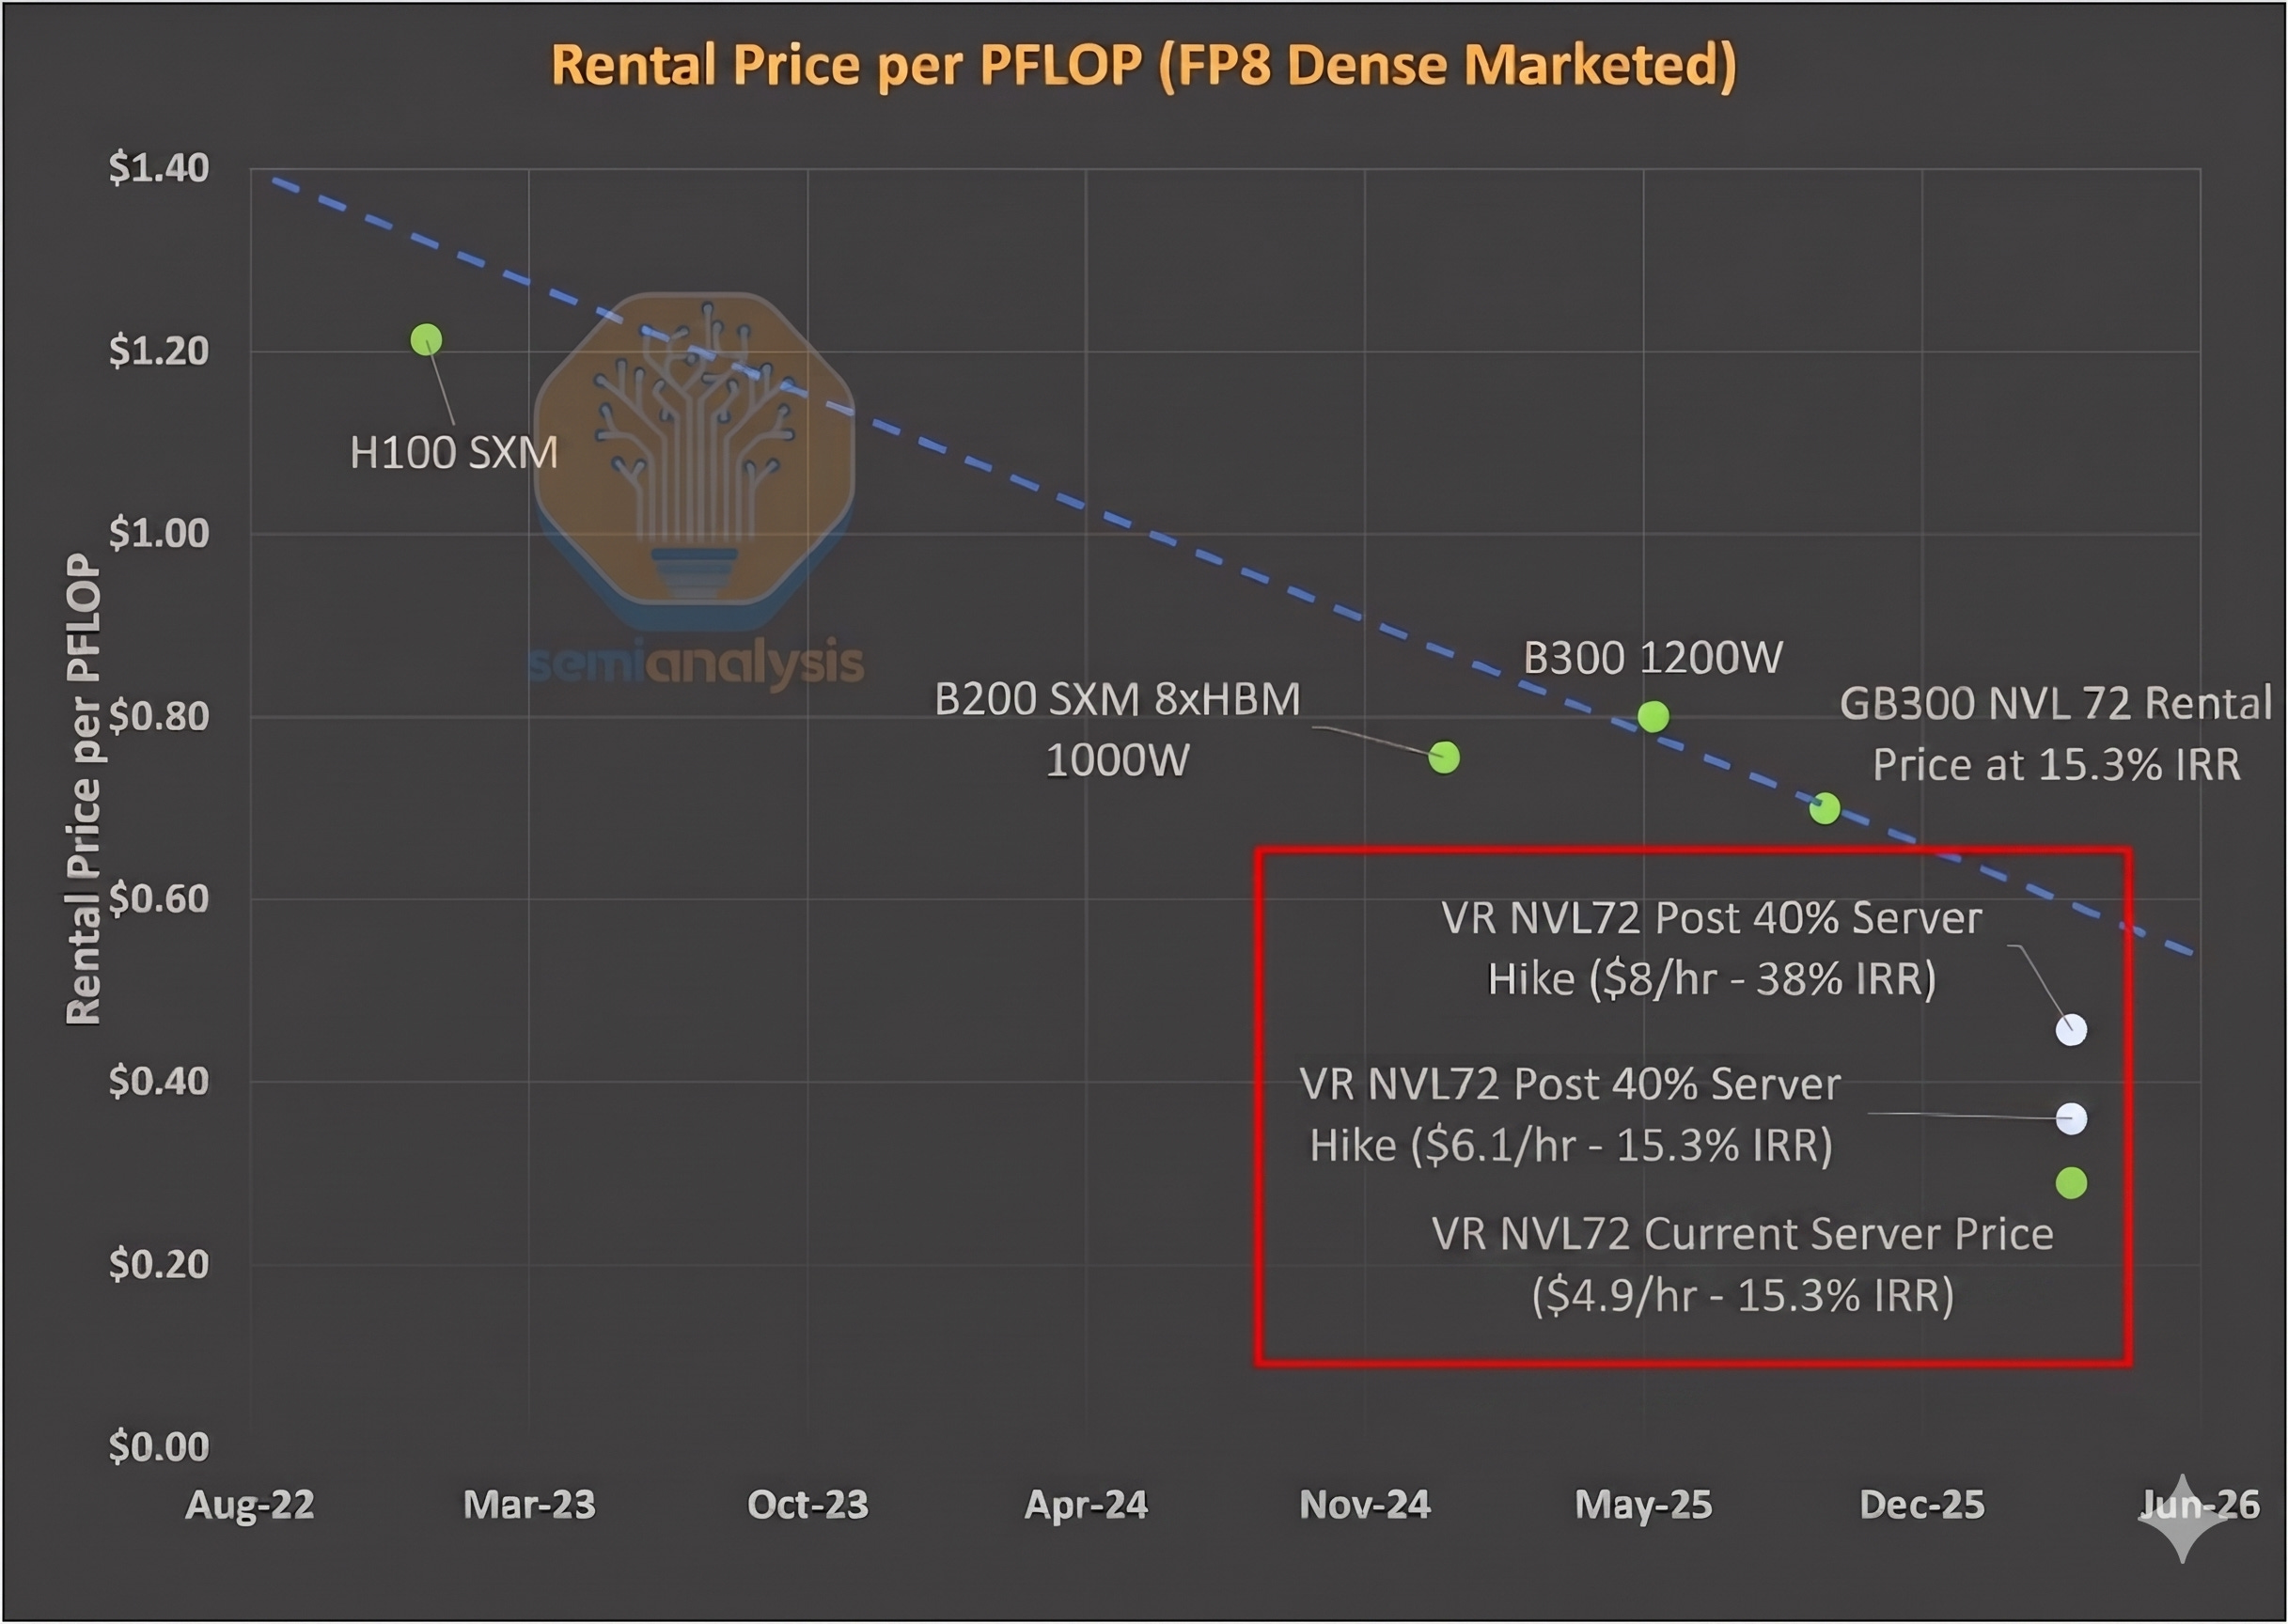
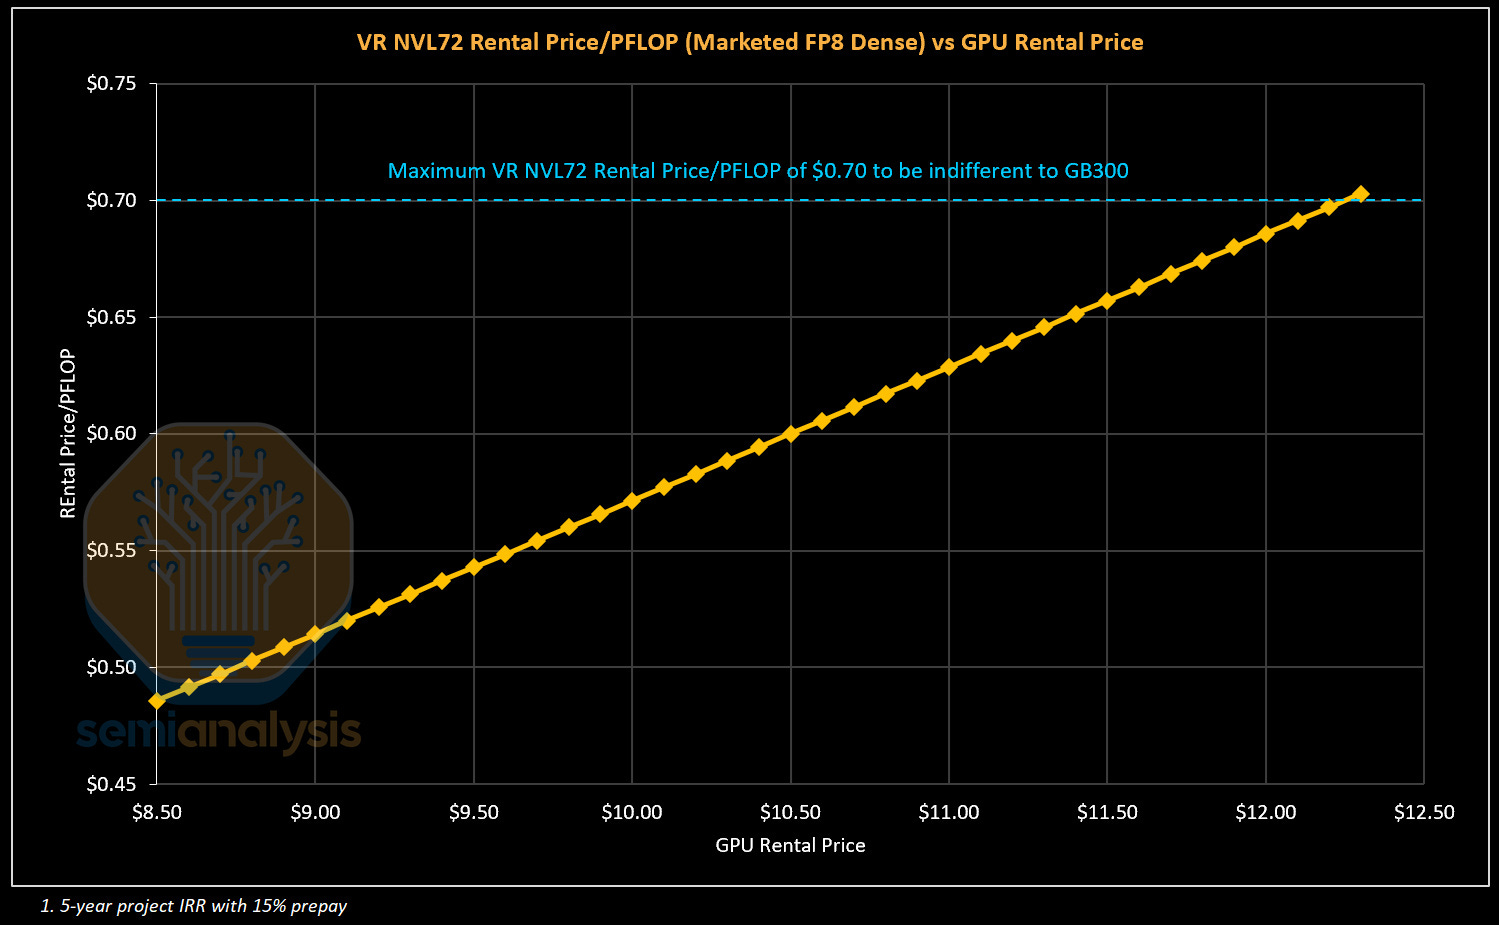
Our second framework looks at value-based pricing. We anchor to the $/FLOP implied by existing SKUs and ask what that would translate to for Rubin. This represents the theoretical maximum a renter of compute would be willing to pay to remain indifferent between Rubin and current generation GPUs - and therefore serves as the ceiling for GPU rental pricing. Here - we look to the trend in improvement of rental prices per PFLOP.

For training workloads, we anchor to GB300 pricing by comparing rental cost per PFLOP on a marketed FP8 dense basis. Using a current 5-year GB300 rental price of ~$0.70 per PFLOP, we derive a VR NVL72 ceiling price of approximately $12.25 per GPU hour at parity.
The VR NVL72 price per TCO stands out in that, unlike for the GB300 and prior cards, there is an extremely large gap in Value-based and Cost-based pricing. If we are conservative and select a point slightly below the trend line - for instance a rental price of $0.55 per PFLOP - this would corresponds to $9.63/hr/GPU, nearly double the minimum rental price of $4.92/hr/GPU needed to cross Neoclouds’ return hurdle.
One Chart to Rule Them All
The cost-based approach forms the floor for GPU rental pricing – below this rental price, Neoclouds will not greenlight new GPU projects. The value-based approach forms the theoretical ceiling for GPU rental pricing – no customer would pay higher on a $/FLOP basis to rent a newer generation GPU.
We combine both constraints as well as a pricing curve that illustrates the returns to the Neocloud for given GPU rental prices to create one pricing chart. This “One Chart To Rule Them All” also acts as a framework to understand competitive dynamics and pricing power.
At the start of the article – we posed the question: Who are the benefits of strong AI demand accruing to?
This question can be answered by plotting observed GPU Rental Prices charged by Neoclouds and the IRRs earned by these projects. Sliding up and to the right along the orange curve in the chart below represents stronger Neocloud bargaining power: The Neocloud is able to charge higher GPU Rentals and earn well above their IRR hurdle rate.
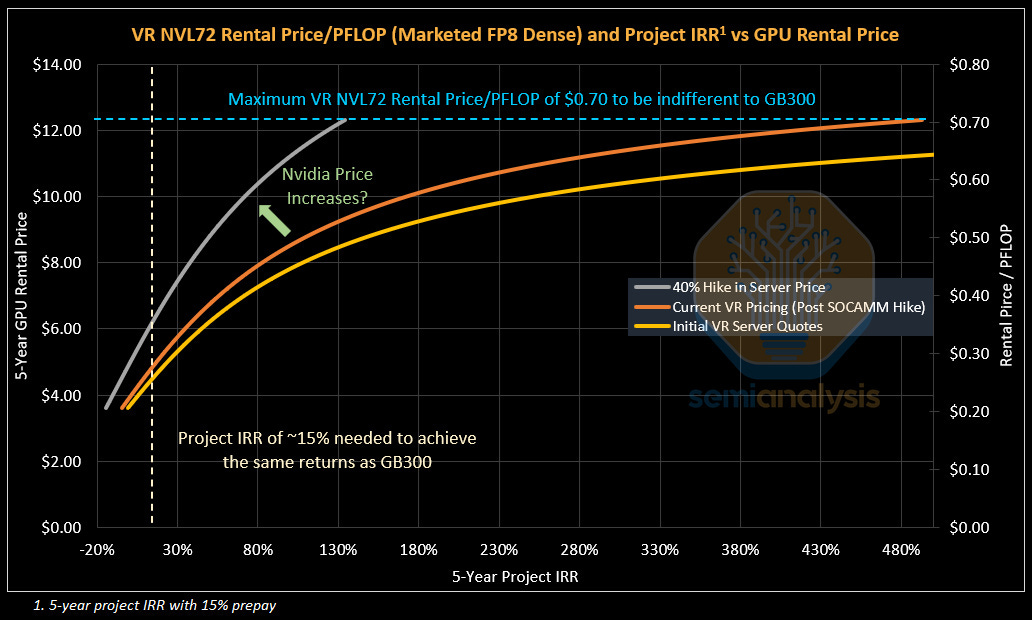
If Nvidia increases pricing for VR NVL72, the pricing curve shifts up and to the left. This is because a higher rental price is needed to offset this higher system cost while still earning the same IRR from the Neocloud perspective. This shift represents stronger bargaining power enjoyed by system suppliers like Nvidia.
The top left corner, where the blue maximum rental price/PFLOP and the beige Neocloud Project IRR minimum hurdle intersect, represents the maximum theoretical AI Cluster pricing. If the system is priced any higher, Neoclouds and end users would be better off just purchasing or renting GB300s. The larger the gap between the current pricing curve and the top left corner, the more room there is for AI Cluster providers like Nvidia to increase system pricing.
At today’s VR NVL72 system pricing, Neoclouds can charge $4.90/hr/GPU for a 5-year contract while still earning the same 15% IRR as they do on their GB300 projects. For customers – Rental Price per PFLOP works out to $0.28/PFLOP, a 60% drop in cost per PFLOP vs the GB300 NVL72, an improvement in cost that is well below trend.
This suggests that there is meaningful room for Nvidia to increase server prices. A ~40% increase in server pricing would deliver below trend cost improvements in price per FLOP, while still leaving Neoclouds enough room to lift prices even higher so they can earn higher IRRs. Even if Neoclouds adjust pricing higher to slide along the grey curve, for instance charging $8.00/hr/GPU and earning a 38% IRR, corresponding to a cost of $0.46/PFLOP, which is still an improvement that is below trend.
It is important to point out that this analysis has mainly focused on Rental Price/FLOP - but improvements in inference performance per TCO have been accelerating at an even brisker pace. Though we have yet to benchmark a VR NVL72 system at InferenceX, it is highly likely that there is an even sharper pace in cost decreases when it comes to dollars per token delivered by VR NVL72, meaning there could be even more headroom for Nvidia to capture more value from the overall ecosystem.
VR NVL72 vs GB300 Performance per TCO
 |
|