

InferenceMAX™: Open Source Inference Benchmarking
NVIDIA GB200 NVL72, AMD MI355X, Throughput Token per GPU, Latency Tok/s/user, Perf per Dollar, Cost per Million Tokens, Tokens per Provisioned Megawatt, DeepSeek R1 670B, GPTOSS 120B, Llama3 70B
LLM Inference performance is driven by two pillars, hardware and software. While hardware innovation drives step jumps in performance every year through the release of new GPUs/XPUs and new systems, software evolves every single day, delivering continuous performance gains on top of these step jumps.
AI software like SGLang, vLLM, TensorRT-LLM, CUDA, and ROCm achieve continuous improvement in performance through kernel-level optimizations, distributed inference strategies, and scheduling innovations that increase the Pareto frontier of performance in incremental releases that can be just days apart.
This pace of software advancement creates a challenge: benchmarks conducted at a fixed point in time quickly go stale and do not represent the performance that can be achieved with the latest software packages.
InferenceMAX™, an open-source automated benchmark designed to move at the same rapid speed as the software ecosystem itself, is built to address this challenge.
InferenceMAX™ runs our suite of benchmarks every night on hundreds of chips, continually re-benchmarking the world’s most popular open-source inference frameworks and models to track real performance in real-time. As these software stacks improve, InferenceMAX™ captures that progress in near real-time, providing a live indicator of inference performance progress. A live dashboard is available for free publicly at https://inferencemax.ai/.
AMD and Nvidia GPUs can both deliver competitive performance for different sets of workloads, with AMD performing best for some types of workloads and Nvidia excelling at others. Indeed, both ecosystems are advancing rapidly!
There are many nuances and considerations when analyzing the results from InferenceMAX™, and this is in no small part because it is designed to be a neutral benchmark, not cherry-picked to promote any specific vendor or solution. As such, there are models and interactivity (tok/s/user) levels where AMD currently does better against Nvidia GPUs of the same generation, and there are also interactivity levels where Nvidia currently does better. The goal of InferenceMAX™ is simple but ambitious — to provide benchmarks that both emulate real world applications as much as possible and reflect the continuous pace of software innovation.
For the initial InferenceMAX™ v1 release, we are benchmarking the GB200 NVL72, B200, MI355X, H200, MI325X, H100 and MI300X. Over the next two months, we’re expanding InferenceMAX™ to include Google TPU and AWS Trainium backends, making it the first truly multi-vendor open benchmark across AMD, NVIDIA, and custom accelerators.
InferenceMAX™ v1 is far from perfect, but we believe that it is a good first step in the right direction. There will be room in future releases to refine workloads, extend model coverage, and better reflect real-world workloads.
Acknowledgements
Thank you to Lisa Su and Anush Elangovan for providing the MI355X and CDNA3 GPUs for this free and open-source project. We want to recognize Anush, Quentin Colombet, and dozens of additional AMD contributors for their responsiveness and help debugging, optimizing, and validating performance across AMD GPUs. Whenever we encounter ROCm issues (we note these issues are occurring at a far lower frequency than at the end of 2024!), they have immediately jumped in to help find temporary fixes that unblock us, following up with permanent patches into ROCm to ensure long-term stability. Quentin and his team embody the AMD 2.0 sense of urgency that many customers such as xAI are very appreciative of.
We’re also grateful to Jensen Huang and Ian Buck for supporting this open-source effort by providing access to a GB200 NVL72 rack (through OCI) and B200 GPUs. Thank you to Kedar Pandurang Potdar, Sridhar Ramaswamy, Kyle Kranen, ptrblck, the NVIDIA inference team, NVIDIA Dynamo team, NCCL team, as well as the Nvidia firmware/driver team for helping validate and optimize Blackwell and Hopper configurations and for fixing bugs with a fast time to resolution.
We also want to recognize the SGLang, vLLM, and TensorRT-LLM maintainers for building a world-class software stack and open sourcing it to the entire world. Furthermore, we want to thank Simon Mo, Kaichao You, Michael Goin, and Robert Shaw whose help was invaluable for resolving a few critical Blackwell bugs.
Finally, we’re grateful to Crusoe, CoreWeave, Nebius, TensorWave, Oracle and TogetherAI for supporting open-source innovation through compute resources, enabling this project and we are thankful to the broader community for pushing inference benchmarking forward.
We are Hiring
We are looking for an engineer to join our special projects team. This is a unique opportunity to work on high-visibility special projects such as InferenceMAX™ with support from many industry leaders and CEOs. If you’re passionate about performance engineering, system reliability, and want to work at the intersection of hardware and software, this is a rare chance to make industry wide impact.
What you’ll work on:
Building and running large-scale benchmarks across multiple vendors (AMD, NVIDIA, TPU, Trainium, etc.
Designing reproducible CI/CD pipelines to automate benchmarking workflows
Ensuring reliability and scalability of systems used by industry partners
What we’re looking for:
Strong skills in Python
Background in Site Reliability Engineering (SRE) or systems-level problem solving
Experience with CI/CD pipelines and modern DevOps practices
Curiosity about GPUs, TPUs, Trainium, multi-cloud, and performance benchmarking
Link to apply: https://app.dover.com/apply/SemiAnalysis/2a9c8da5-6d59-4ac8-8302-3877345dbce1
InferenceMAX™ Initiative Supporters
InferenceMAX™ initiative is supported by many major buyers of compute and prominent members of the ML community including those from OpenAI, Microsoft, PyTorch Foundation, etc.:
“As we build systems at unprecedented scale, it’s critical for the ML community to have open, transparent benchmarks that reflect how inference really performs across hardware and software. InferenceMAX™’s head-to-head benchmarks cut through the noise and provide a living picture of token throughput, performance per dollar, and tokens per Megawatt. This kind of open source effort strengthens the entire ecosystem and helps everyone, from researchers to operators of frontier datacenters, make smarter decisions.”
– Peter Hoeschele, VP of Infrastructure and Industrial Compute, OpenAI Stargate
“Open collaboration is driving the next era of AI innovation. The open-source InferenceMAX benchmark gives the community transparent, nightly results that inspire trust and accelerate progress. It highlights the competitive TCO performance of our AMD Instinct MI300, MI325X, and MI355X GPUs across diverse workloads, underscoring the strength of our platform and our commitment to giving developers real-time visibility into our software progress.”
– Dr. Lisa Su, Chair and CEO, AMD
“Inference demand is growing exponentially, driven by long-context reasoning. NVIDIA Grace Blackwell NVL72 was invented for this new era of thinking AI. NVIDIA is meeting that demand through constant hardware and software innovation to enable what’s next in AI. By benchmarking frequently, InferenceMAX™ gives the industry a transparent view of LLM inference performance on real-world workloads. The results are clear: Grace Blackwell NVL72 with TRT-LLM and Dynamo delivers unmatched performance per dollar and per megawatt—powering the most productive and cost-effective AI factories in the world.”
– Jensen Huang, Founder & CEO, NVIDIA
“Speed is the moat. InferenceMAX™’s nightly benchmarks match the speed of improvement of the AMD software stack. It’s fantastic to see AMD’s MI300, MI325, and MI355 GPUs performing so well across diverse workloads and interactivity levels.”
– Anush Elangovan, VP GPU Software, AMD
“InferenceMAX™ highlights workloads that the ML community cares about. At NVIDIA, we welcome these comparisons because they underscore the advantage of our full-stack approach—from GPUs hardware to NVLink networking to NVL72 Rack Scale to Dynamo disaggregated serving that consistently delivers industry-leading inference performance and ROI at scale.”
– Ian Buck, VP & GM, Hyperscale, NVIDIA & Inventor of CUDA
“ InferenceMAX™’s nightly results highlight the rapid pace of progress in the AMD software stack. It’s exciting to witness the birth of an open project that provides a tied feedback loop between what the software team works on here at AMD and how it affects specific ML use cases across our MI300, MI325, and MI355 GPUs. I’m looking forward to see what’s next for InferenceMAX and to showcase what the AMD platform can do. AMD GPUs will continue to get faster every week.”
– Quentin Colombet, Senior Director, AMD, Ex-Brium CEO
“Our mission at Azure is to give customers the most performant, efficient, and cost-effective cloud for AI. SemiAnalysis InferenceMAX™ supports that mission by providing transparent, reproducible benchmarks that track inference performance across GPUs and software stacks under realistic workloads. This continuous data on throughput, efficiency, and cost per watt strengthens our ability to tune Azure’s inference platform for scale, helping customers build with confidence on Microsoft Cloud.”
– Scott Guthrie, Executive Vice President, Microsoft Cloud & AI
“At Microsoft, delivering the best inference performance and economics for our customers at scale requires a deep understanding of how AI models interact with real-world hardware and software. Open-source, reproducible benchmarks, like InferenceMAX™, are essential for generating transparent insights into throughput, efficiency, and cost under realistic workloads. These continuous signals help guide our platform strategy, enabling us to optimize the entire stack from silicon, to systems, to software, so that every layer works together to unlock the full potential of our infrastructure.”
– Saurabh Dighe, Corporate Vice President, Azure Strategic Planning & Architecture
“The gap between theoretical peak and real-world inference throughput is often determined by systems software: inference engine, distributed strategies, and low-level kernels. InferenceMAX™ is valuable because it benchmarks the latest software showing how optimizations like FP4, MTP, speculative decode, and wide-EP actually play out across various hardware. Open, reproducible results like these help the whole community move faster.”
– Tri Dao, Chief Scientist of Together AI & Inventor of Flash Attention
“The industry needs many public, reproducible benchmarks of inference performance. We’re excited to collaborate with InferenceMAX™ from the vLLM team. More diverse workloads and scenarios that everyone can trust and reference will help the ecosystem move forward. Fair, transparent measurements drive progress across every layer of the stack, from model architectures to inference engines to hardware.”
– Simon Mo, vLLM Project Co-Lead
“The benchmark is good sir”
– Michael Goin, vLLM maintainer
“InferenceMAX™ benchmark is pogchamp & W in chat”
– Kaichao You, vLLM Project Co-lead
“InferenceMAX™ demonstrates how an open ecosystem can operate in practice. Many leading inference stacks such as vLLM, SGLang, and TensorRT-LLM are built on PyTorch, and benchmarks like this show how innovations across kernels, runtimes, and frameworks translate into measurable performance on a range of hardware platforms, including NVIDIA and AMD GPUs. By being open source and running nightly, InferenceMAX™ offers a transparent, community-driven approach to tracking progress and providing PyTorch users with data-driven insights.”
– Matt White, Executive Director, PyTorch Foundation
“Oracle Cloud Infrastructure is built to give frontier labs & enterprises flexibility and choice, with many GPU SKUs available for AI at scale. InferenceMAX strengthens that mission by delivering open source, reproducible benchmarks that reflect real-world performance, efficiency, and cost on the latest hardware and software. With this transparency, customers can confidently select the platforms that best align with their AI strategies.”
– Jay Jackson, Vice President, Oracle Cloud Infrastructure
“InferenceMAX™ raises the bar by delivering open, transparent benchmarks that track how inference really performs across the latest GPUs and software stacks. For customers, having reproducible data that measures real world tokens per dollar & tokens per watt, turns abstract marketing numbers into actionable insight. At CoreWeave, we support this effort because it brings clarity to a fast-moving space and helps the entire ecosystem build with confidence.”
– Peter Salanki, CTO, CoreWeave
“InferenceMAX™ sets a new standard by providing open, transparent benchmarks that reveal how inference performs across today’s leading GPUs and software stacks. With reproducible data measuring real-world tokens per dollar and tokens per watt, customers can move beyond marketing claims to actionable insights. For us at Nebius, as a full-stack AI cloud provider, this initiative helps us build our inference platform with confidence and ensure we are aligned with the ecosystem.”
– Roman Chernin, co-founder and Chief Business Officer, Nebius
“At Crusoe, we believe being a great partner means empowering our customers with choice and clarity. That’s why we’re proud to support InferenceMAX™, which provides the entire AI community with open-source, reproducible benchmarks for the latest hardware. By delivering transparent, real-world data on throughput, efficiency, and cost, InferenceMAX™ cuts through the hype and helps our customers confidently select the very best platform for their unique workloads.”
– Chase Lochmiller, Co-Founder & CEO, Crusoe
“Supermicro is excited about the launch of InferenceMAX™, the SemiAnalysis benchmarking system that measures real-world throughput, performance per dollar, and energy efficiency. This open-source tool provides reproducible benchmarks running on the latest hardware and software enabling AI labs and enterprises to choose the best platforms at scale.”
– Charles Liang, Founder & CEO, Supermicro
“At TensorWave, we’re building a next-generation cloud on AMD GPUs because we believe innovation thrives when customers have strong alternatives. InferenceMAX™ reinforces that vision by providing open source, reproducible benchmarks that track throughput, efficiency, and cost across the latest hardware and software. By cutting through synthetic numbers and highlighting real-world inference performance, it helps customers see the full potential of AMD platforms for AI at scale.”
– Darrick Horton, CEO, TensorWave
“Vultr is committed to providing an open ecosystem that gives developers freedom in how they build and scale AI — whether on NVIDIA or AMD GPUs. With InferenceMAX™, customers gain open, reproducible benchmarks that deliver clear insights into throughput, efficiency, and cost across cutting-edge hardware and software. By showcasing real-world performance, we empower teams to confidently choose the right platform for their AI workloads.”
– Nathan Goulding, SVP of Engineering, Vultr
The Fundamental Trade-off between Throughput (tok/s/gpu) & Latency/ Interactivity (tok/s/user)
The fundamental trade-off that comes with serving LLMs at scale is that of throughput versus interactivity (measured in units of tokens per second per user). Throughput is the rate at which each GPU can process tokens (tok/s/gpu), whereas interactivity describes the rate at which tokens are generated for each individual user (tokens/sec/user). Put simply, you can serve individual users fast and efficiently, usually by serving fewer users at a time, but doing so will come with the cost of lower overall GPU throughput.
This trade-off exists because LLM inference relies on matrix multiplications that benefit from batching multiple requests together – that is, serving many more users at the same time. Large batches enable better GPU utilization and higher token throughput, but they split available resources across more requests, slowing down token processing per user. Conversely, small batches concentrate GPU resources on fewer requests – that is, fewer users, delivering high interactivity at the expense of overall throughput. In practice, most providers aim for a balance between these extremes. The optimal point on this trade-off depends on the use case: some applications prioritize responsiveness while others prioritize throughput. However, the target interactivity level translates directly to cost of inference. Higher interactivity means higher costs.
Owning or renting a GPU system for inference typically comes with a fixed $/hour cost. Thus, as interactivity increases and overall throughput decreases, fewer tokens are processed per hour, driving up the unit cost per token (measured in cost per million tokens). To maintain profitability, providers must set their price per token above their cost to serve. This means that higher interactivity use cases will need higher prices per token to support this higher cost, while high throughput applications can be served at a lower price.
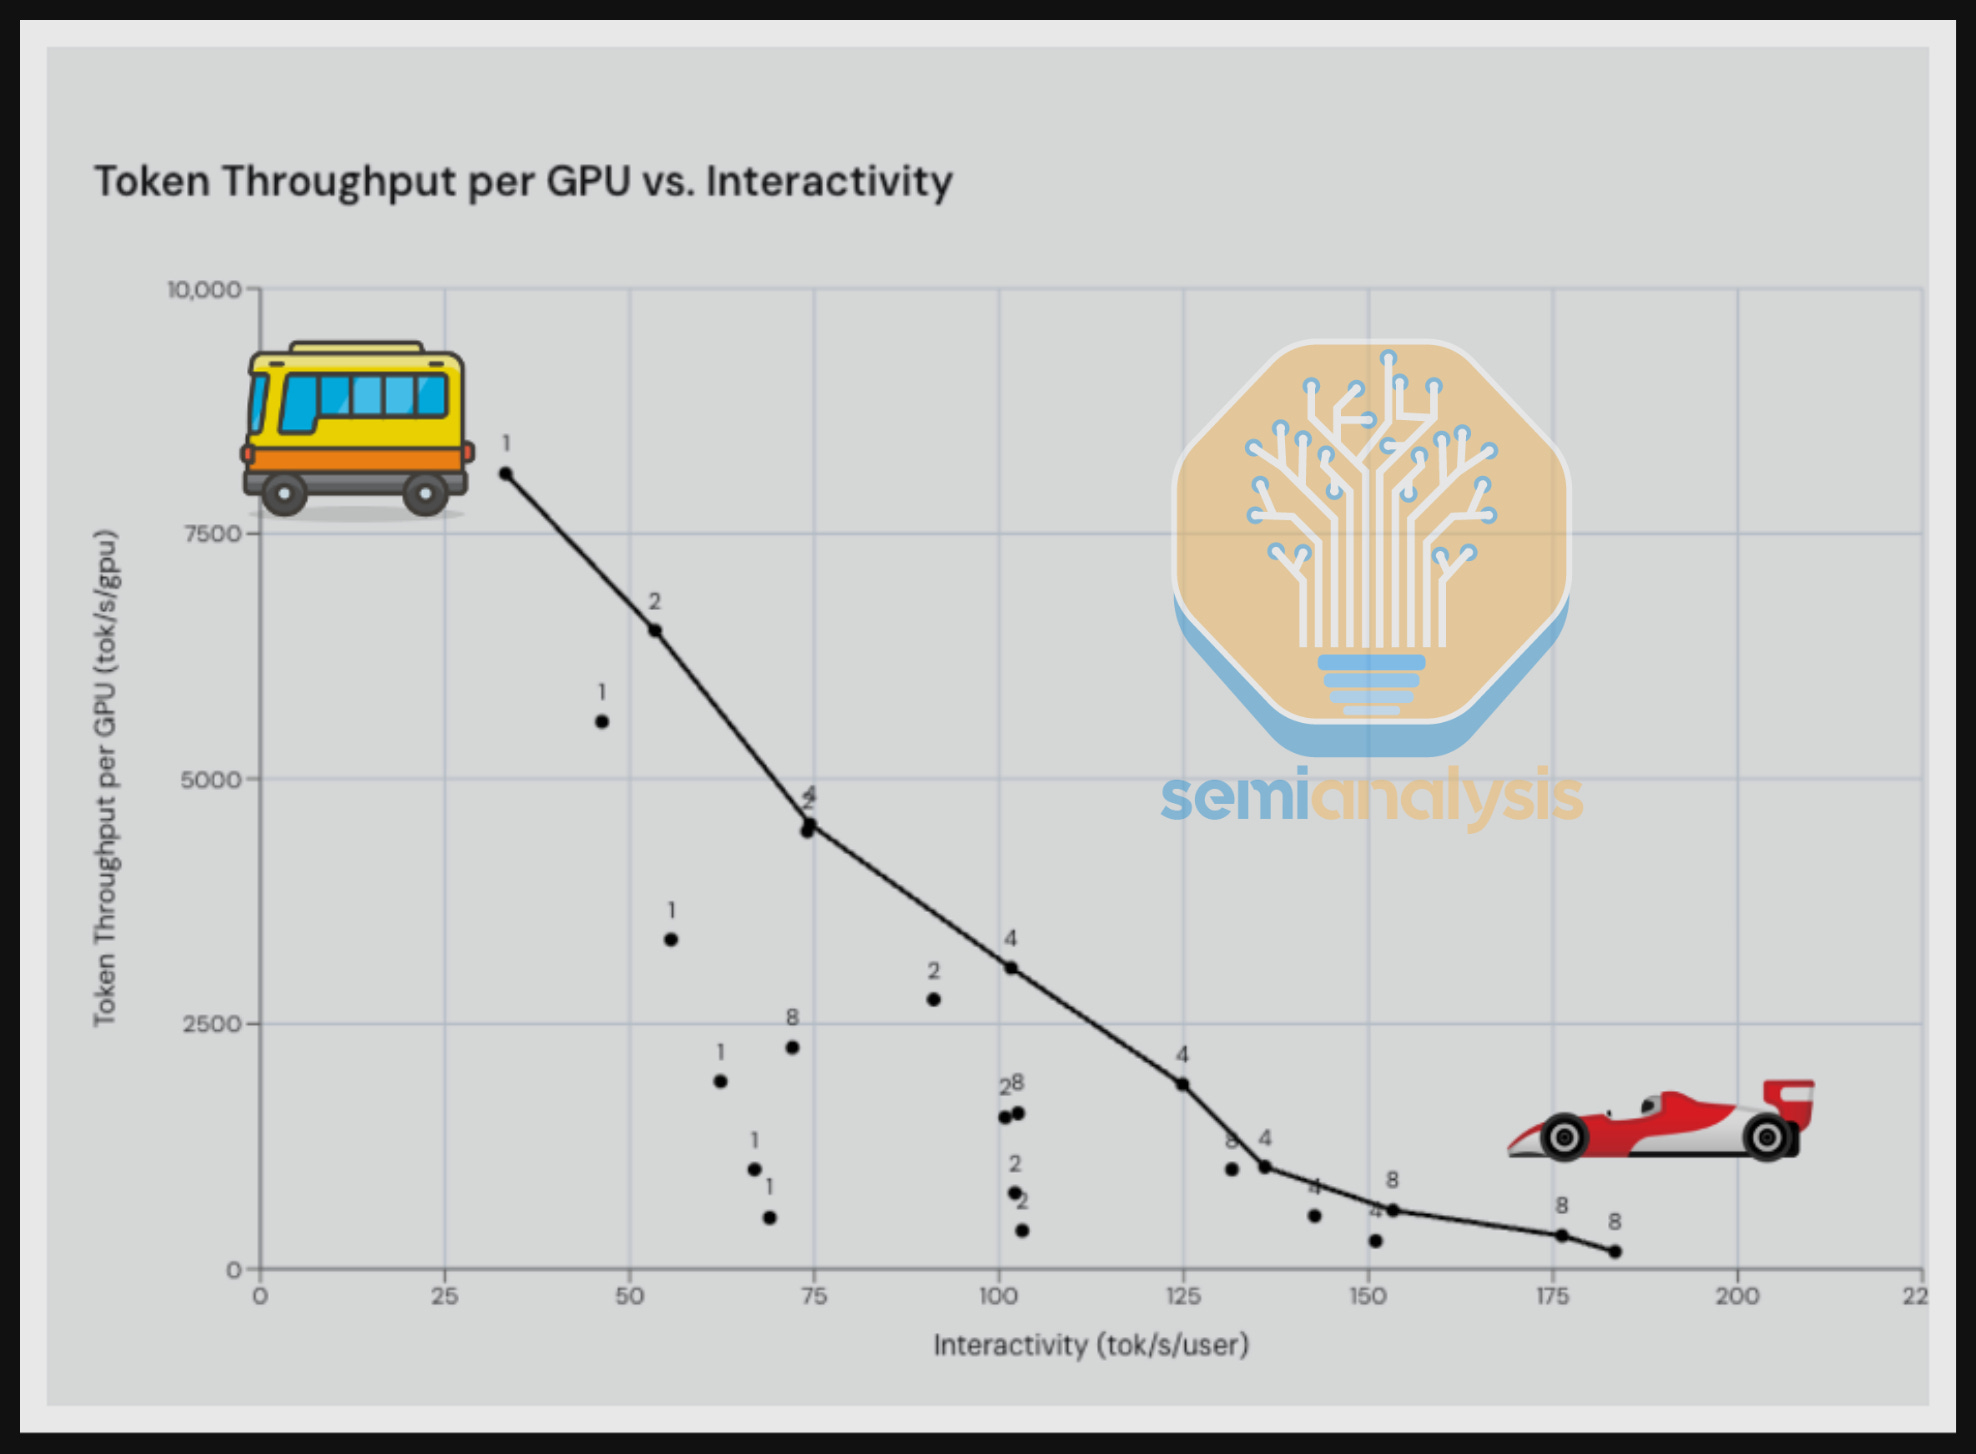
A simple analogy illustrates the entire trade-off. A metro bus and a Ferrari may have a very similar absolute dollar cost of ownership, but the bus amortizes that cost across dozens of passengers while the Ferrari serves only one or two. The Ferrari delivers superior responsiveness with immediate departure, direct routes, and a premium experience, but at a fundamentally higher cost per passenger. LLM serving operates under a similar constraint.
Pareto Frontier Curve
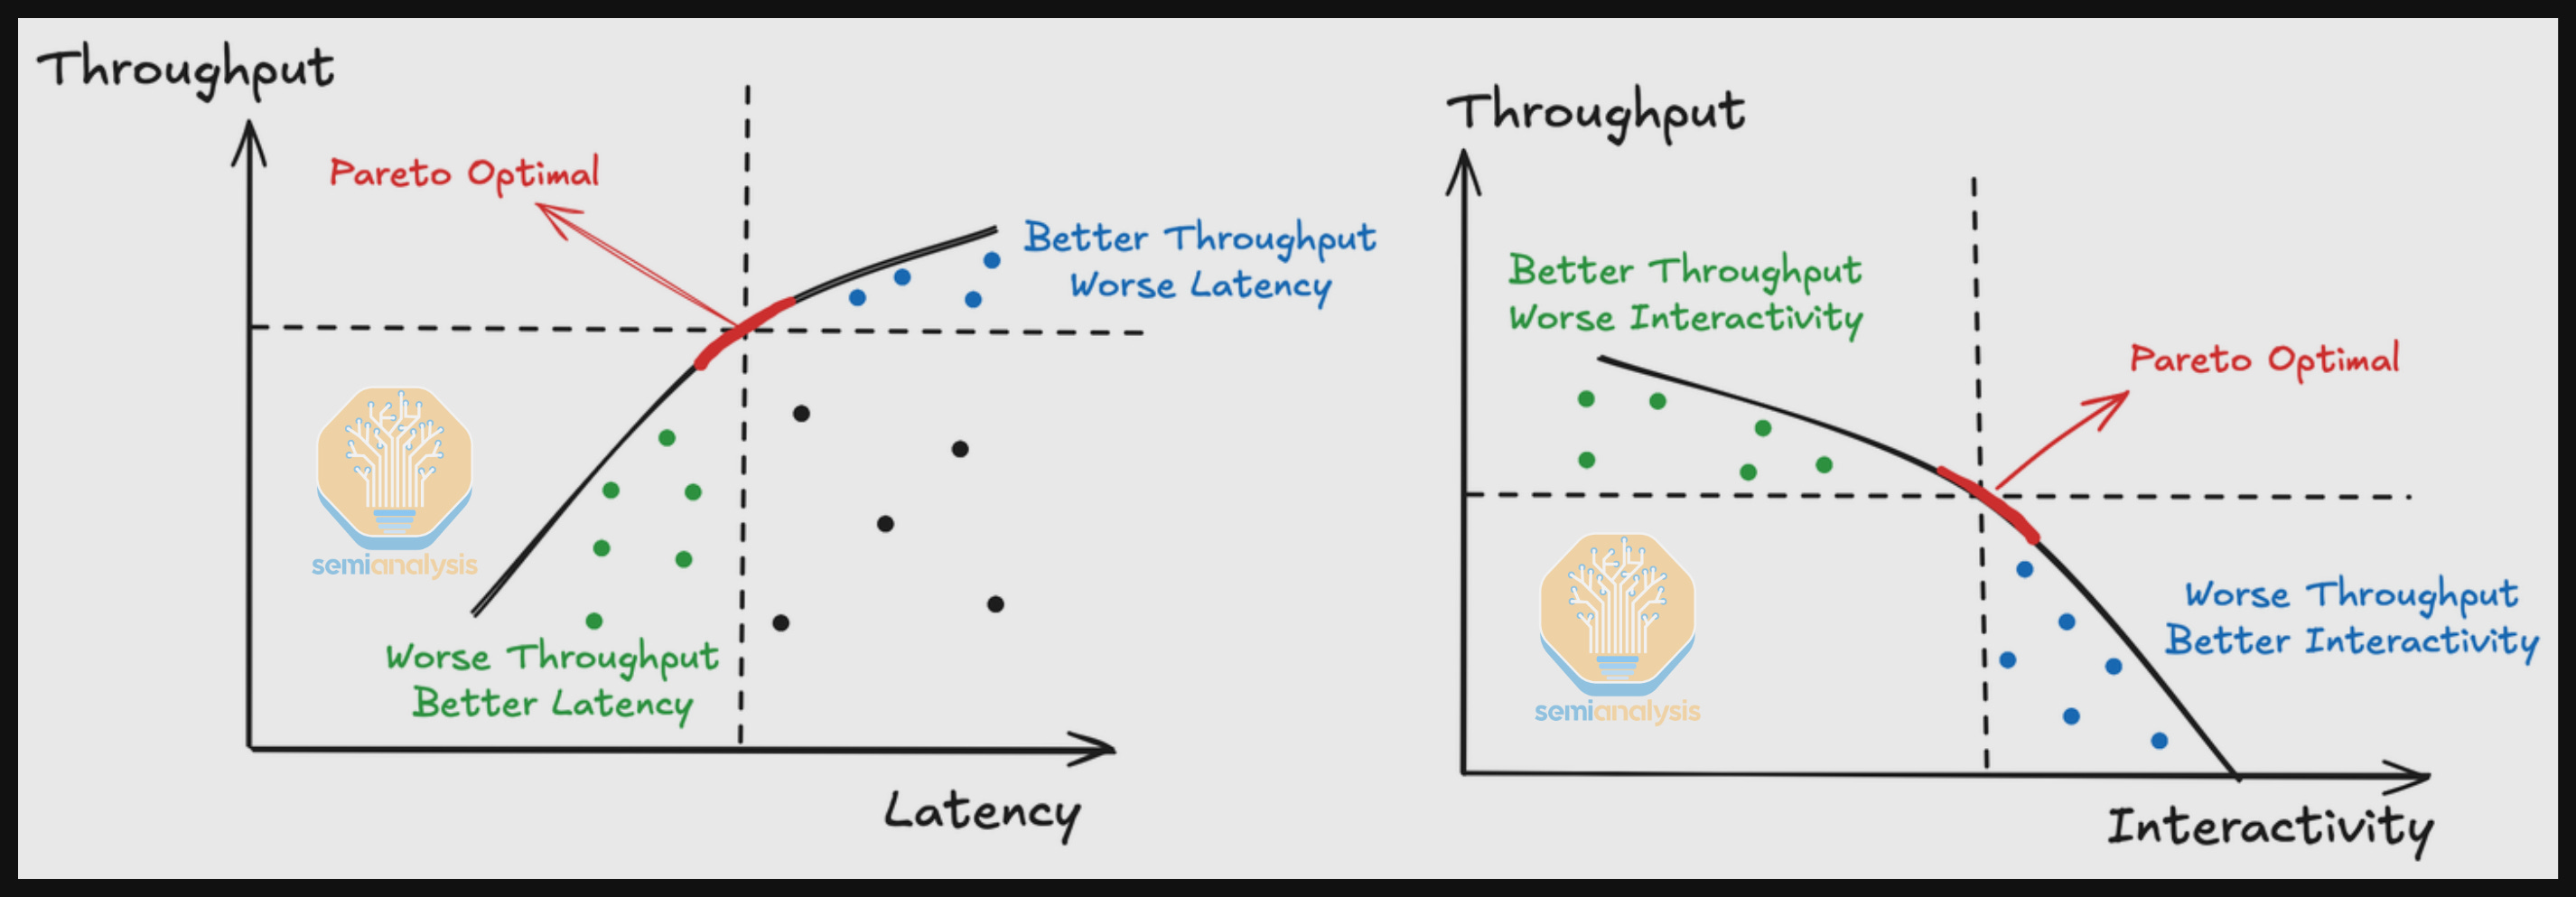
There is always a trade-off between throughput and latency. To identify the Pareto Frontier Curve, we try to find every data point P such that there is no point that is better than point P in both throughput and latency. This means data point P is Pareto optimal, i.e. no other point improves one axis without sacrificing the other. When we connect the pareto optimal dots, we get the Pareto Frontier Curve.
InferenceMAXv1 Benchmark Methodology
Providing benchmarks that reflect the full spectrum of possibilities across many levels of interactivity for different GPUs, inference engines and workloads is a core goal of InferenceMAX™. In this section we will describe how the benchmark methodology is designed to meet this goal.
For each benchmark run, we set up an inference server and a benchmark client. An inference server listens to requests and processes them. We use vLLM, SGLang, and TRT-LLM depending on the model. For benchmark clients, we use the vLLM benchmark serving script with vLLM dependencies removed. A benchmark client sends requests, records the runtime, and saves metrics related to the inference job.
We opted for benchmarking requests that are random sequences to avoid prefix caching due to the complexity of taking prefix caching into consideration for now. Prefix caching varies significantly by workload and requires a careful survey of request patterns in order to pick representative prefix ratios. In future iterations of InferenceMAX, we will be using datasets like shareGPT instead of random data. We set the request rate to infinite and set the max number of concurrent requests, so we capture the inference server behavior when processing a specific number of requests. We also set the total number of requests to be sufficiently large so that cold start instabilities, e.g. JIT compile time, are amortized.
For input / output sequence lengths, we converged on three sets: 1024 input tokens / 1024 output tokens representing chat workloads, 1024 input tokens / 8192 output tokens representing reasoning workloads, 8192 input tokens / 1024 output tokens representing summarization workloads. To mimic real world requests having different input sequence lengths, we randomly vary each request’s input length from 80% to 100% of the specified input sequence length.
The config options for a benchmark run are as follows:
· Model: LLaMA 70B, DeepSeek R1, gpt-oss 120B
· Precision: MXFP4 weights, FP8, FP4
· GPU: H100, H200, B200, GB200 NVL72, MI300X, MI325X, MI355X
· Open source Frameworks: vLLM, SGLang, TRT-LLM
· Parallelism: 1, 2, 4, 8, etc.
· Max concurrency: 4, 8, 16, 32, 64, etc.
Starting with models, we picked LLaMA3 70B to represent dense enterprise model deployments.
To benchmark sparse MoE models, we decided on DeepSeekV3 670B. In terms of arithmetic intensity, approximate active, total parameter count, and memory access patterns, DeepSeekV3’s model architecture is the model that best matches frontier closed models such as OpenAI’s 4o/5 model architecture. Thus, DeepSeek is the best proxy model for benchmarking to what OpenAI’s internal model architecture likely is.
For smaller, sparse MoE models, we decided on GPT-OSS 120B MoE because it is the closest to GPT-5 mini in terms of arithmetic intensity, approximate active, total parameter count, and memory access patterns.
We are benchmarking FP8, FP4 and MX4 weights across the models depending on whether the hardware supports it. We sweep through different max concurrency users (a concept similar to batch size) to plot the full throughput and latency curve. We also sweep through different model parallelism schemes because larger model parallelism can reduce memory loading time, which in turn increases throughput at a low latency regime to a certain extent to find the pareto frontier curve.
To prevent a restart of the SGLang vs vLLM benchmark wars and to save compute time, we decided to first pick only one of vLLM or SGLang as the default engine for each model. Back in July, we let AMD & Nvidia know that we would be using SGLang for DeepSeek 670B, vLLM for Llama3 70B as well as vLLM for Llama4. We have since replaced Llama4 with GPT-OSS 120B since nobody uses Llama4 and GPT-OSS 120B more closely matches a smaller “mini” frontier model.
We want server configs to reflect real world deployments as much as possible, thus we have asked AMD and Nvidia to submit configs that are decently close to what their documentation guides reference when they discuss how to deploy these models on their hardware:
We hadn’t clearly specified whether warmup was allowed for InferenceMAX, so Nvidia has included a warmup phase in their SGLang DeepSeek submission to handle certain JIT-compiled kernels. Towards the end of our work in developing the benchmarks, AMD noticed the above fact regarding Nvidia’s submission and asked if warmup was permitted, since they hadn’t realized they could do the same. After some discussion between AMD, Nvidia, and the SemiAnalysis AI Engineering team, all parties agreed that warmup would be disallowed for now, and that the DeepSeek benchmark length would instead be extended by up to 5× to ensure fairness. The confusion experienced was our fault for not being explicit from the start about warmup rules. We plan to revisit the topic after launch given that in real-world production inference, warmup often occurs before the Kubernetes control plane reports a pod as healthy.
Discussion: Strategies for Serving DeepSeek R1
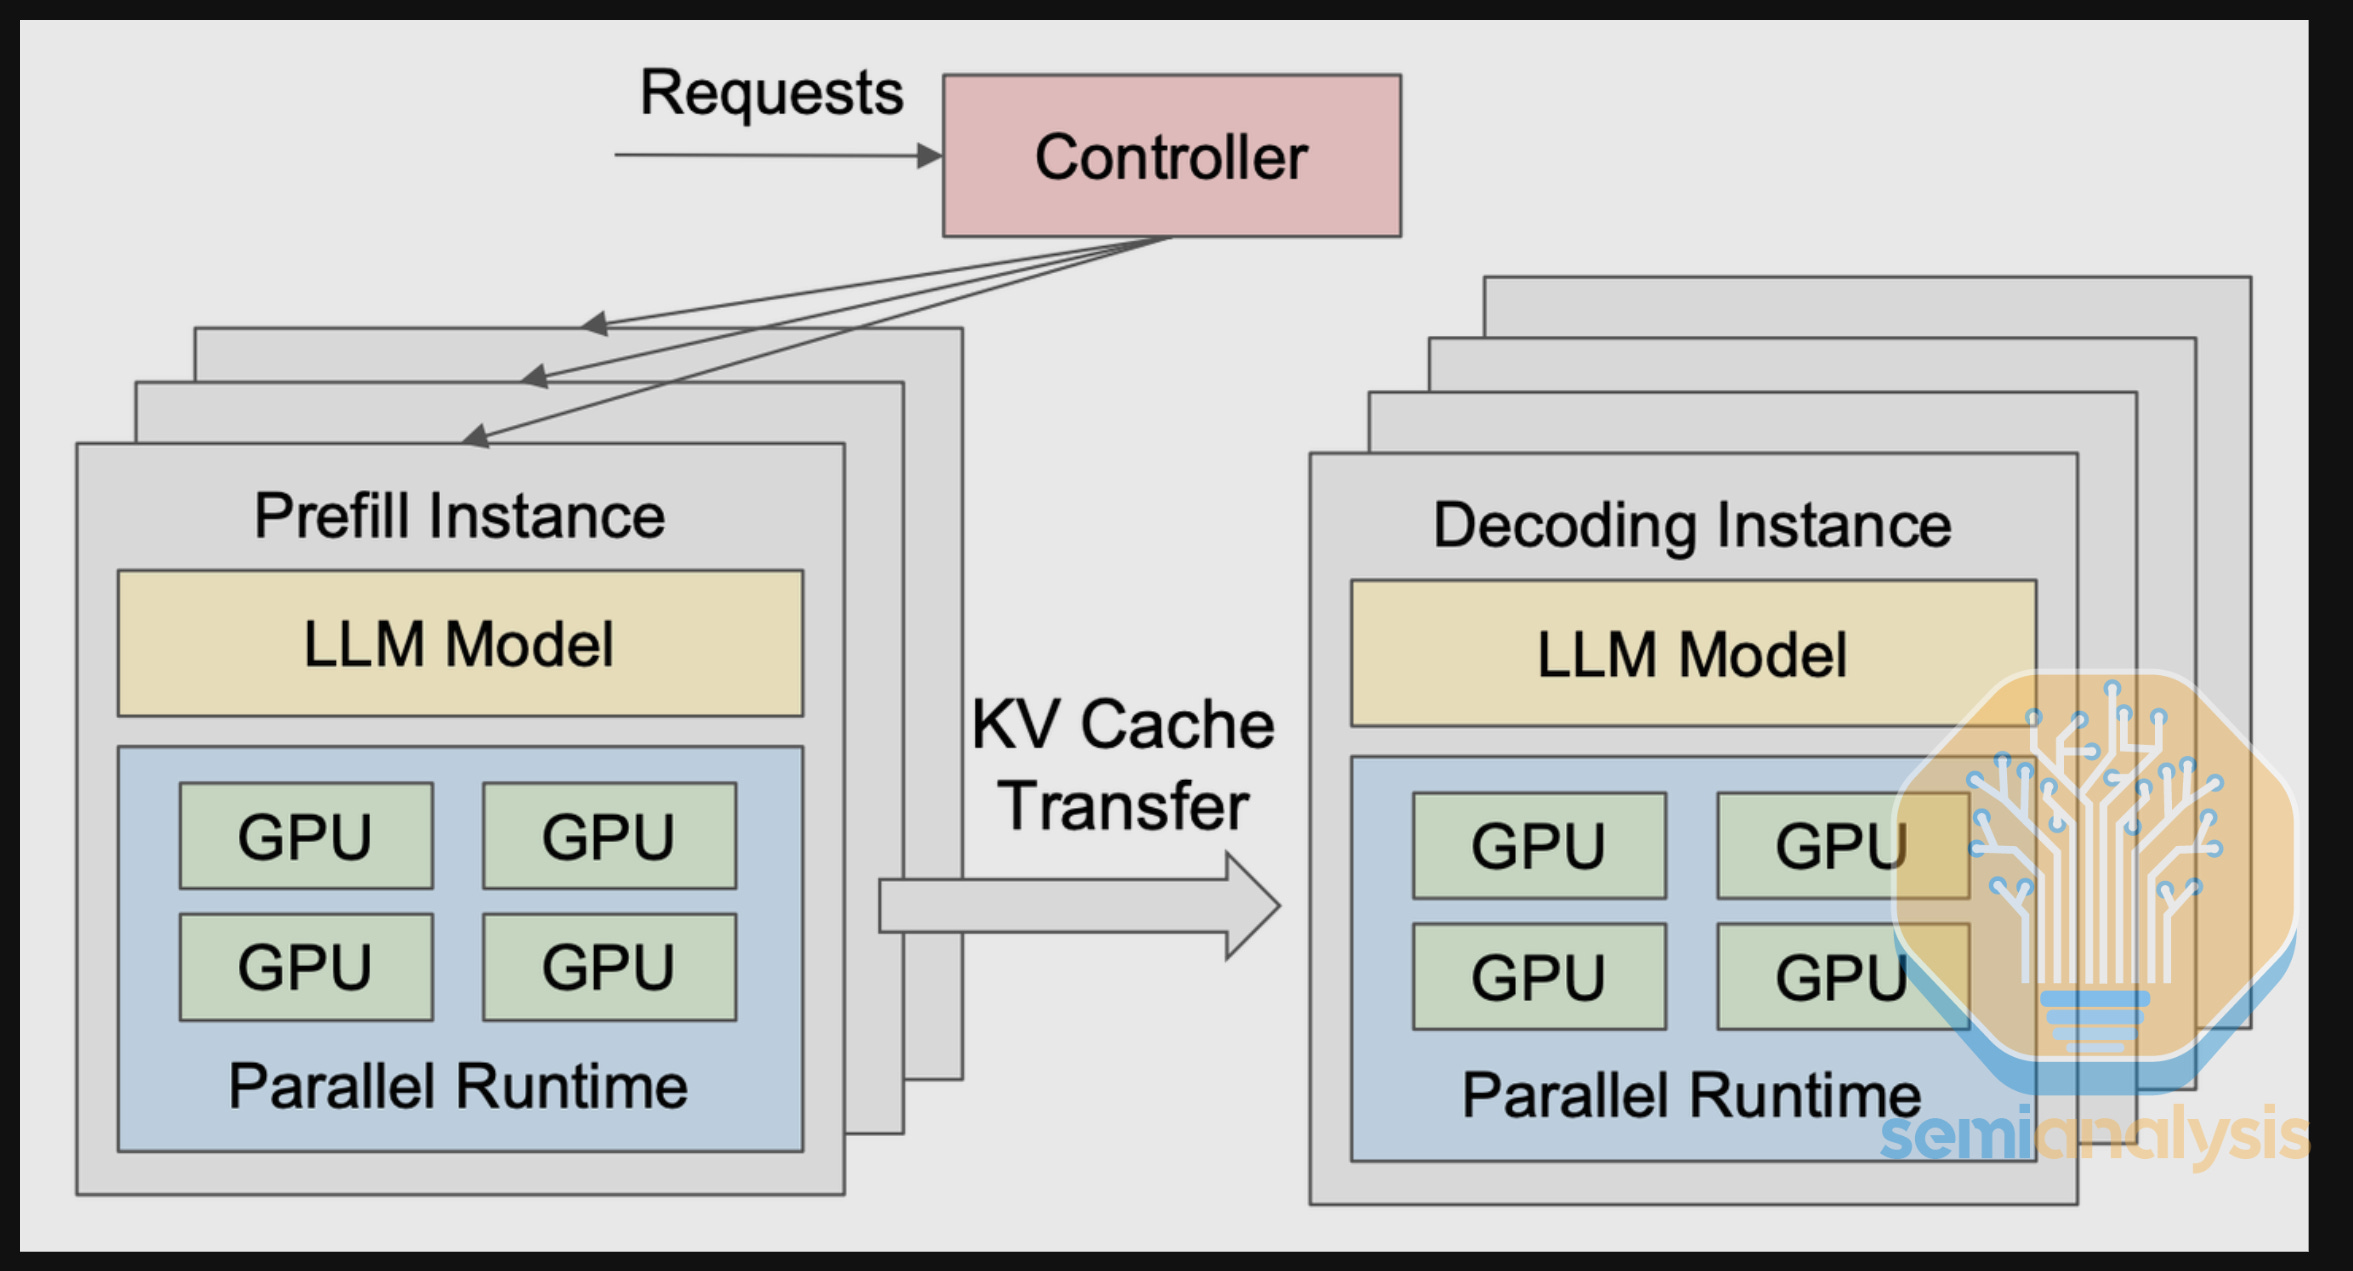
We allow providers to optionally submit disaggregated serving configs for DeepSeek R1. Disaggregated serving assigns the two stages of inference, prefill and decode, to different GPU resources. By separating the two stages, requests at different stages won’t interfere with each other, enabling better SLA guarantees, especially at high concurrency scenarios.
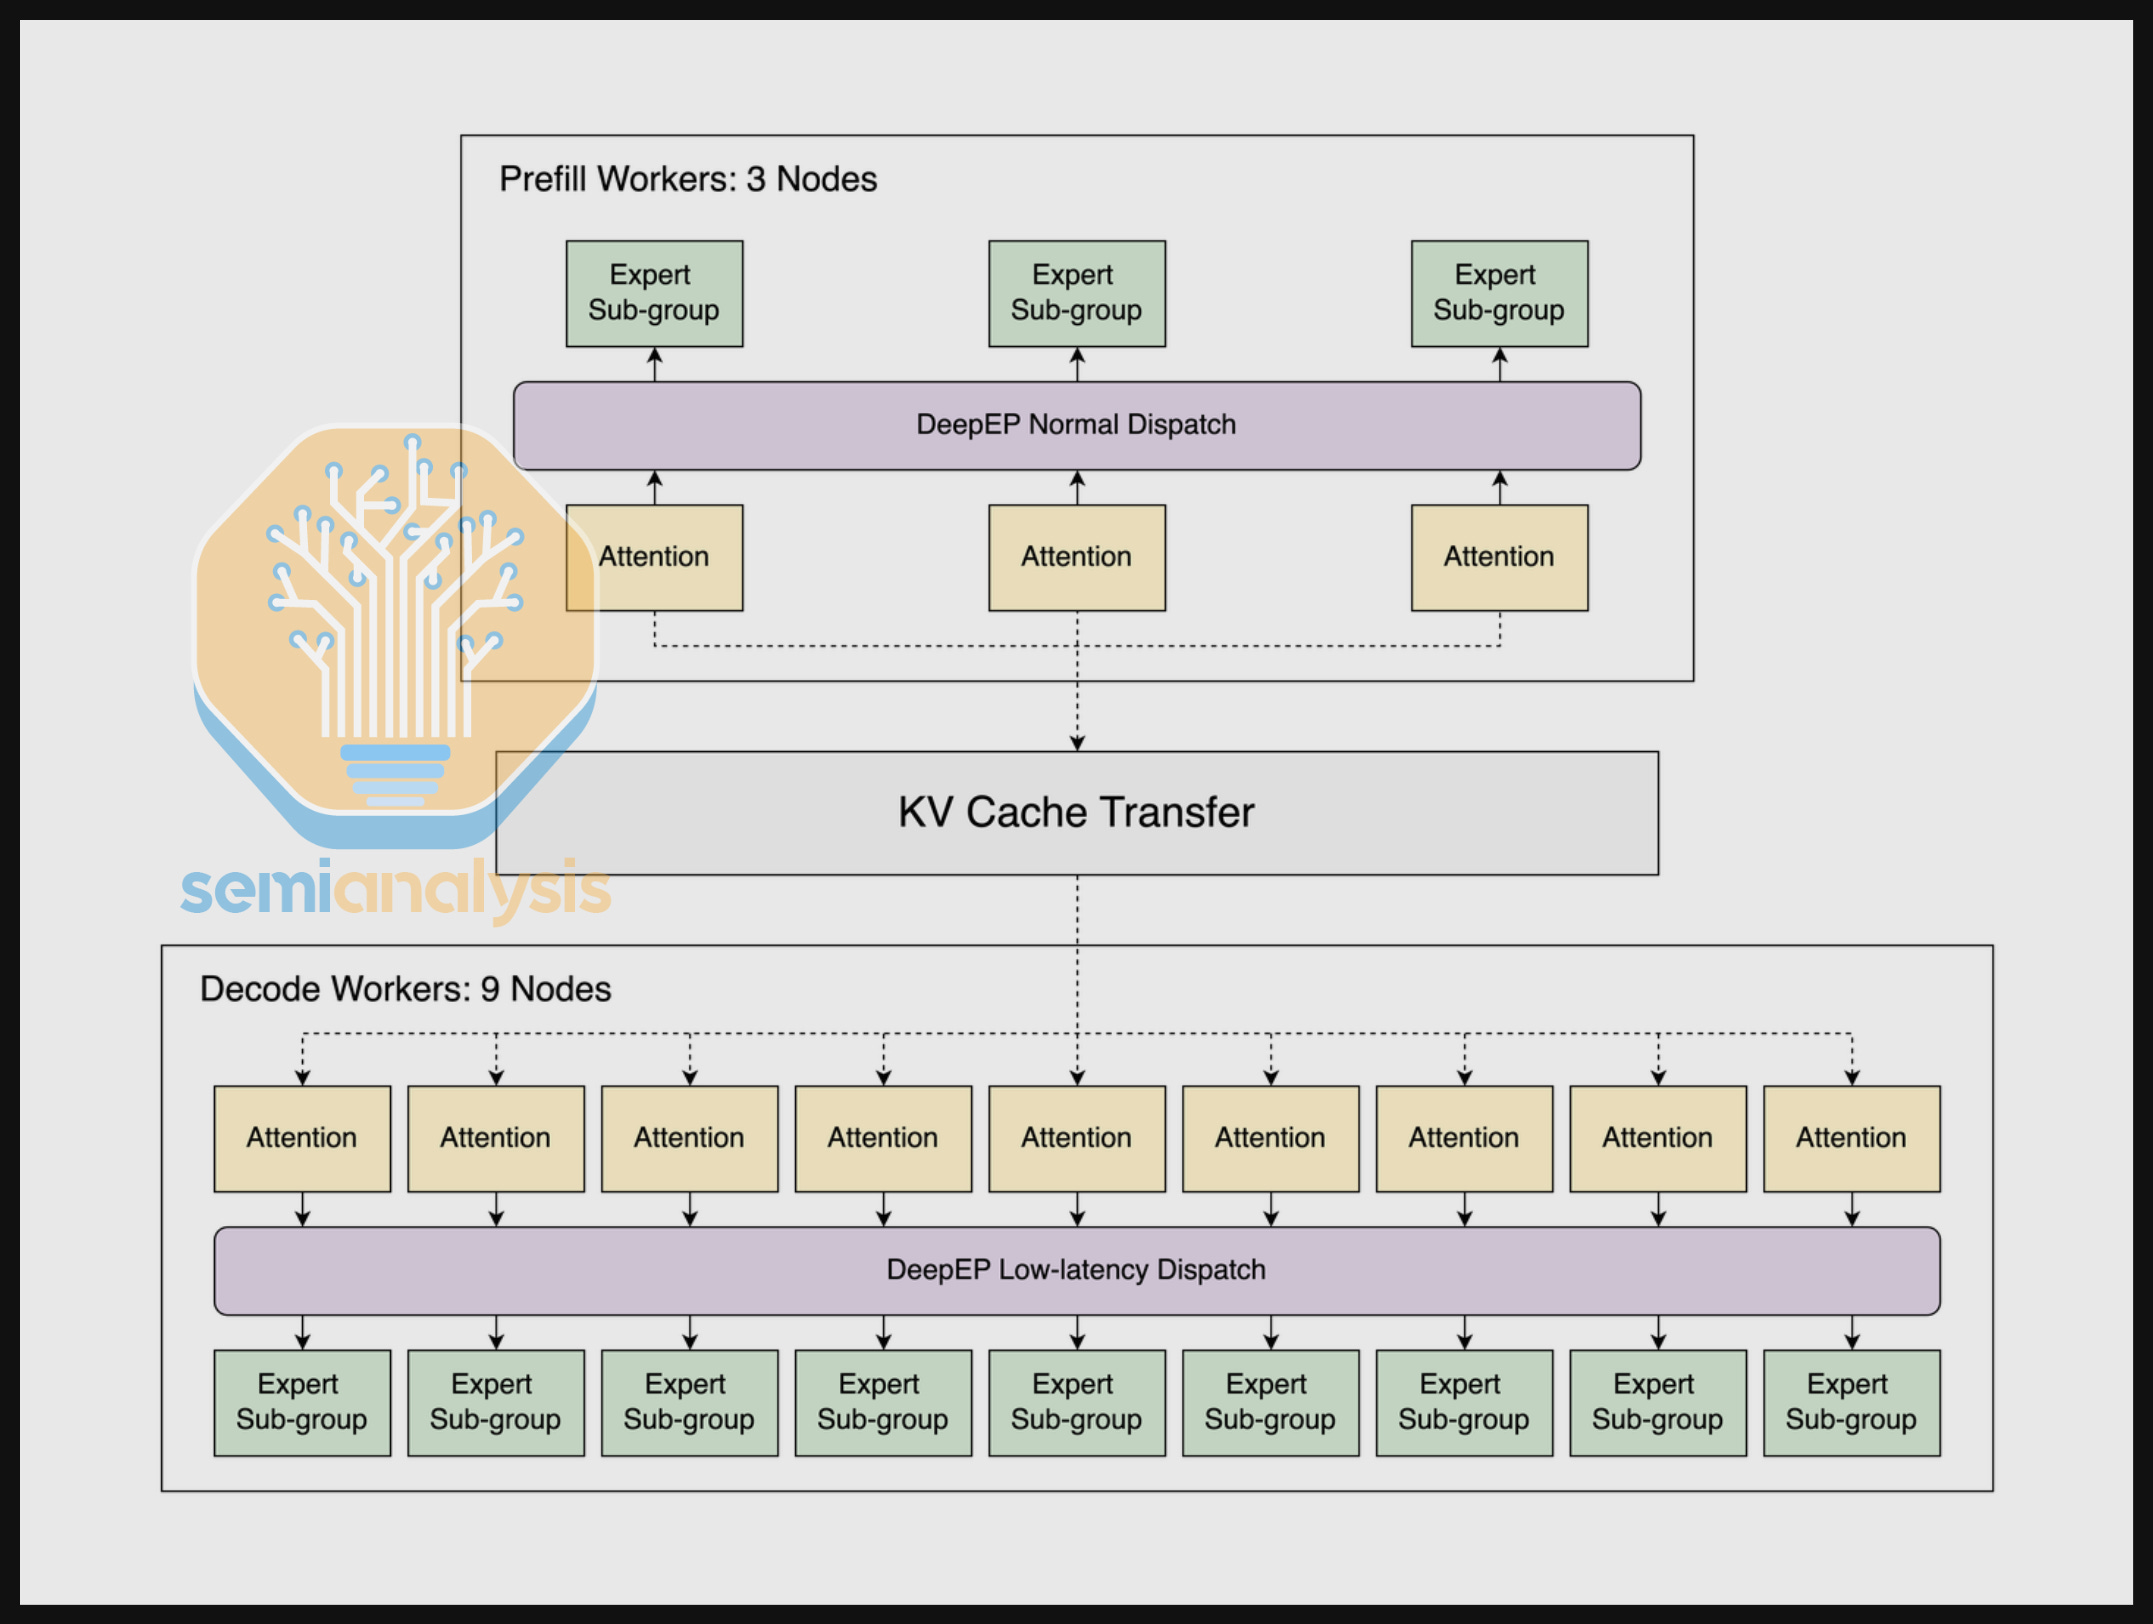
We additionally combined disaggregated serving with large scale expert parallelism (wide EP). Wide EP is enabled by multiple techniques, most notably DeepEP. DeepEP provides two dispatch modes: normal and low latency. Normal mode specializes in improving throughput of the prefill stage, while low-latency mode is tailored for lowering the latency of decode stage.
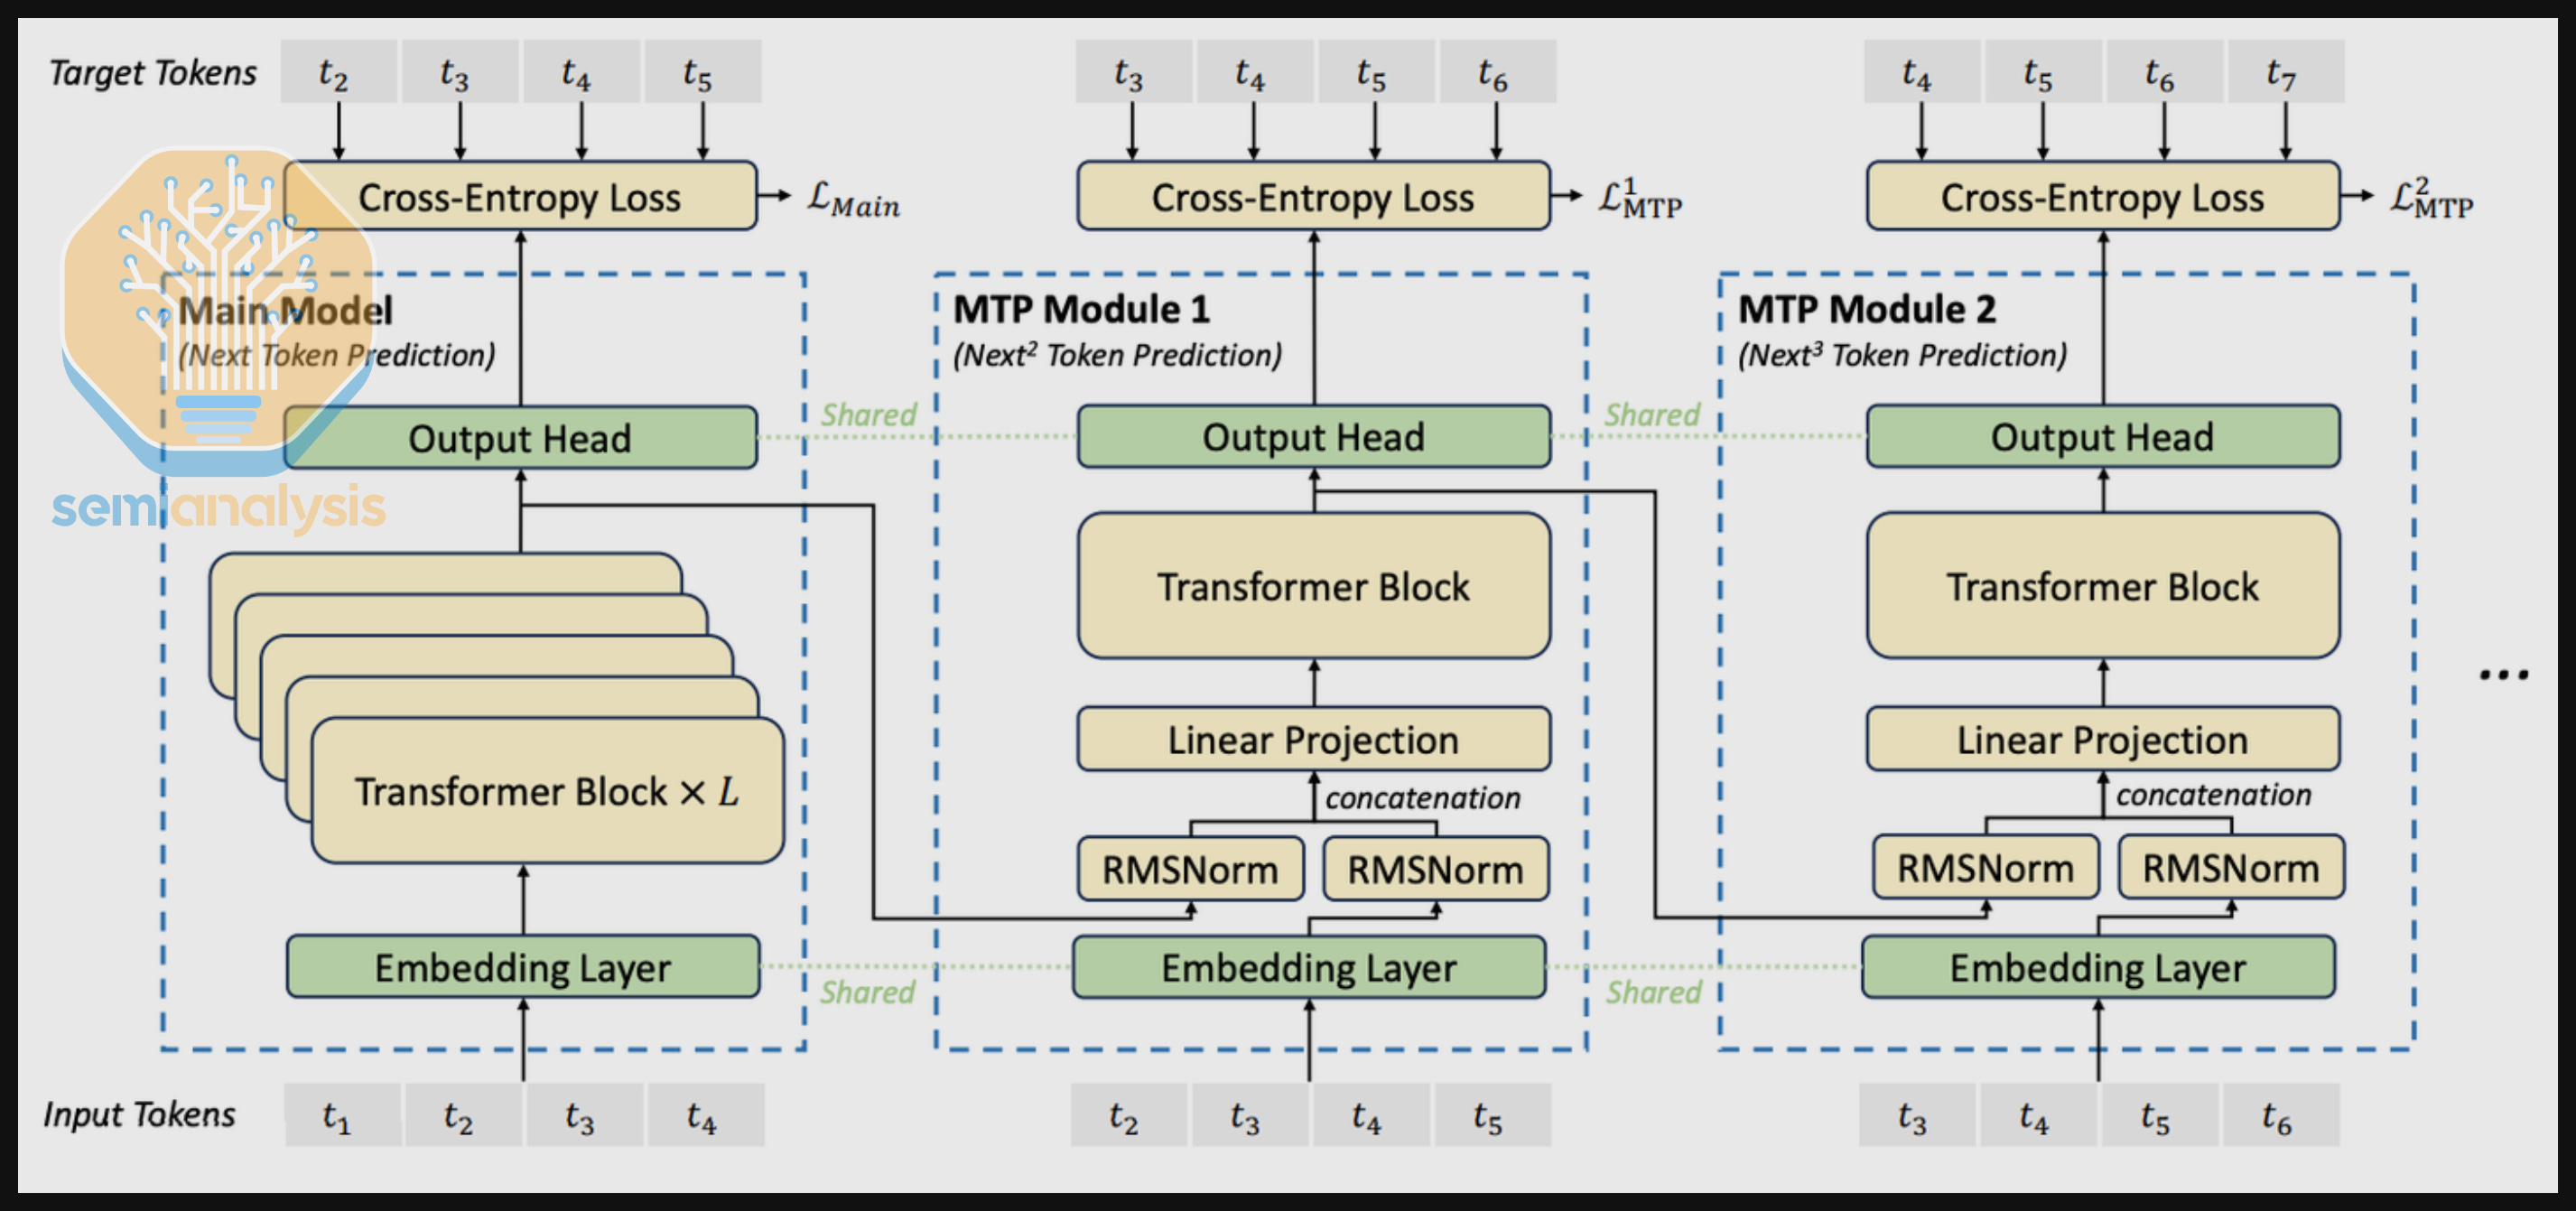
For disaggregated serving DeepSeek R1, we also received submissions with multi-token prediction (MTP) enabled. DeepSeek R1 implements MTP, where the model is trained to predict multiple tokens every forward pass with the help of additional MTP modules. According to DeepSeek, training with MTP improves the model’s planning abilities. In addition, using MTP modules during inference boosts token throughput with minimal model quality loss.
Nvidia has submitted runs for DeepSeek R1 on GB200 NVL72 with disaggregated serving, wide EP, and MTP. Nvidia has also submitted specific configs to plot out the Pareto frontier, and we plan to expand to sweep a larger config space in the future.
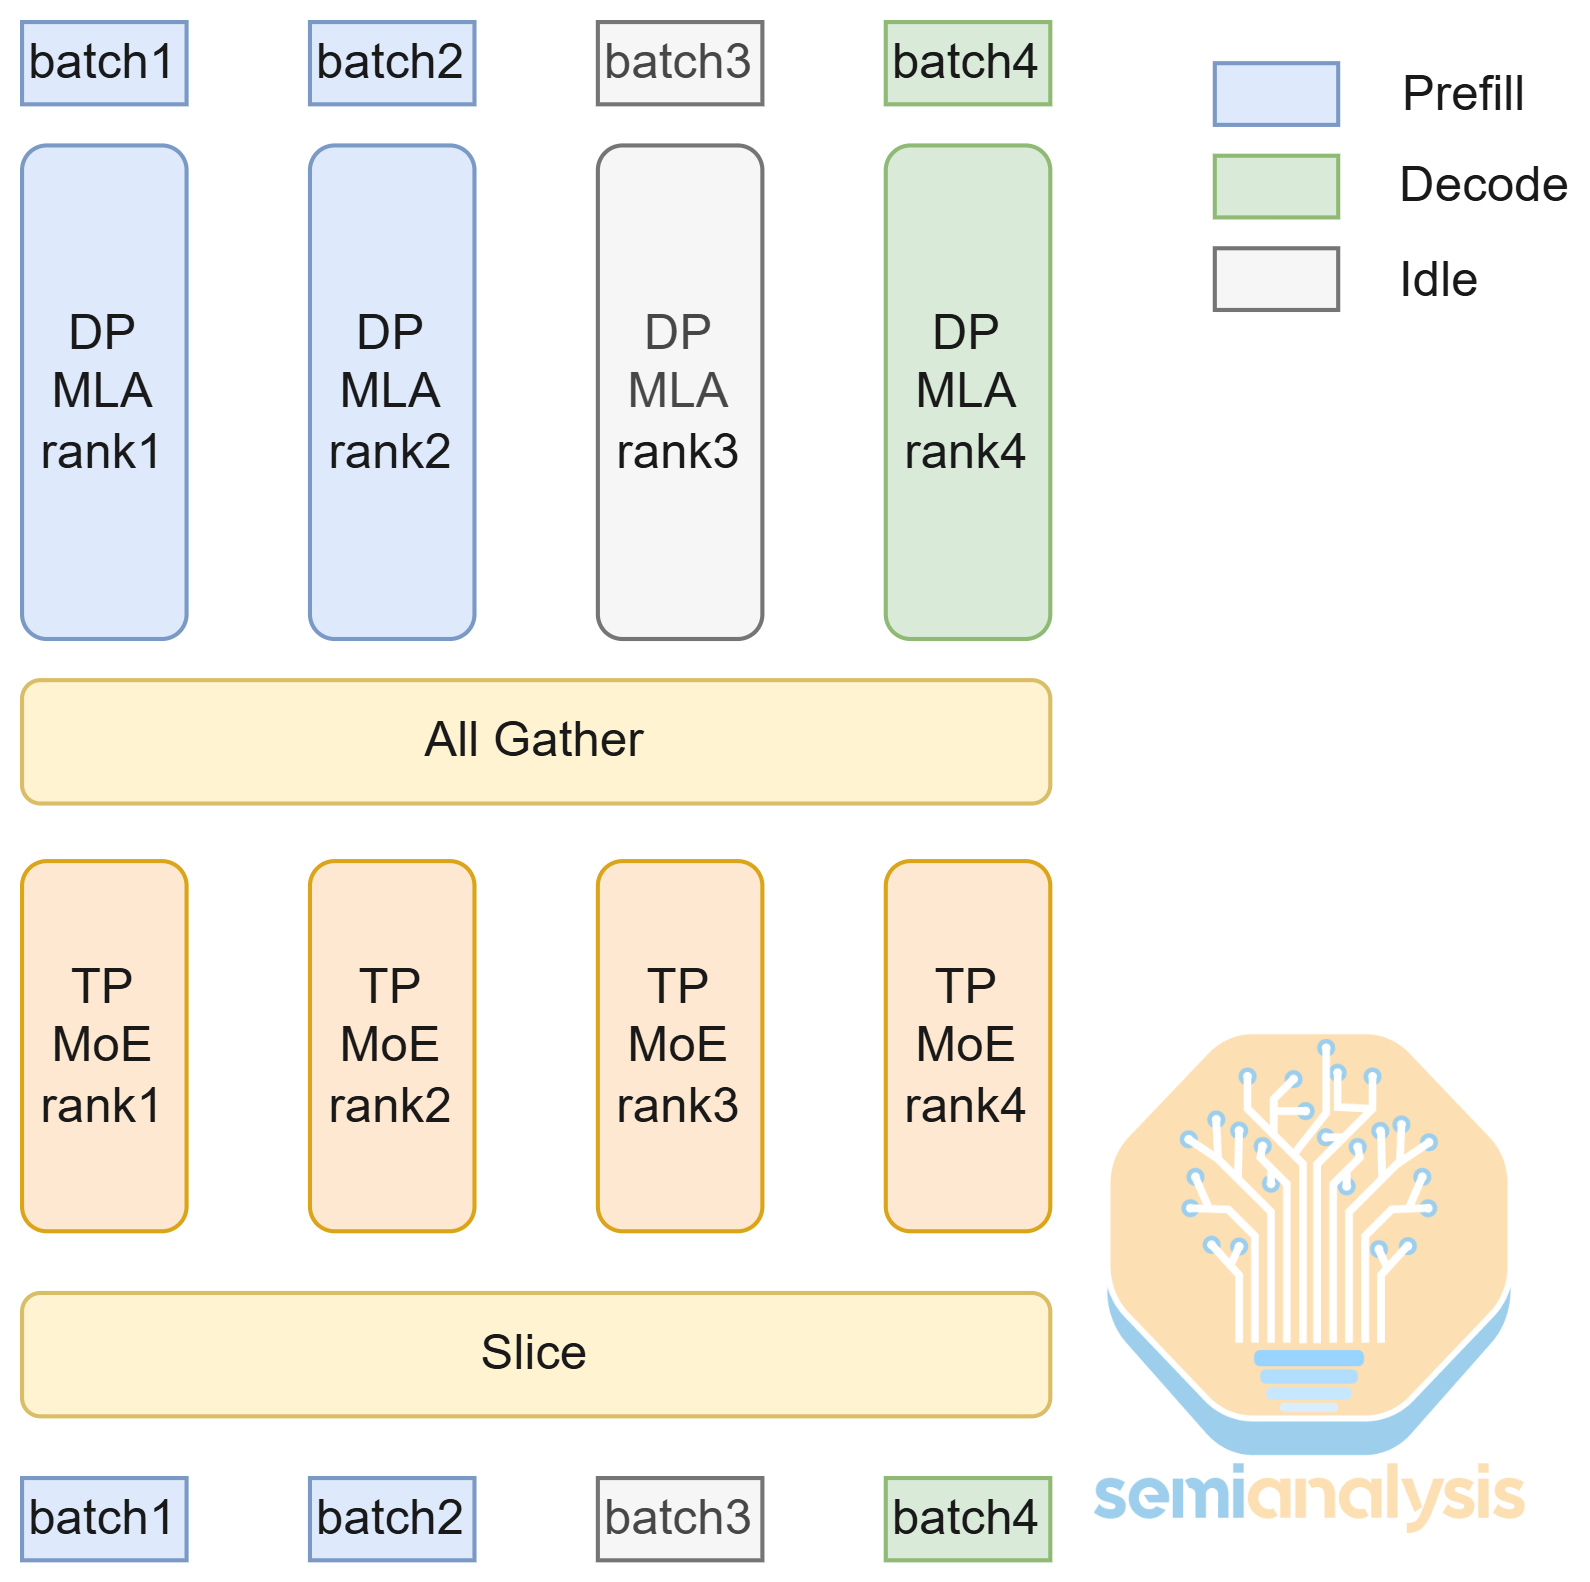
When serving DeepSeek R1, SGLang offers multiple parallelism strategies, including tensor parallel (TP), data parallel (DP), and expert parallel (EP). Parallelism strategies split up work between GPUs to lower the memory usage per GPU and improve hardware utilization.
Typically, we use tensor parallel to split up work in the attention layer along the number of heads dimension, which is typically 128. However, this doesn’t fit well with DeepSeek R1 because it uses Multi-Latent Attention (MLA), a special type of attention where there is only one KV head, leading to KV cache duplication. To tackle this issue, SGLang uses data parallel attention for lower interactivity and splits work along the batch dimension, removing the need to duplicate KV cache and reducing communication load.
DeepSeek R1 also has a lot of expert layers, so we apply expert parallel and assign each GPU a set of expert layers. This lowers the memory usage at the cost of higher communication load.
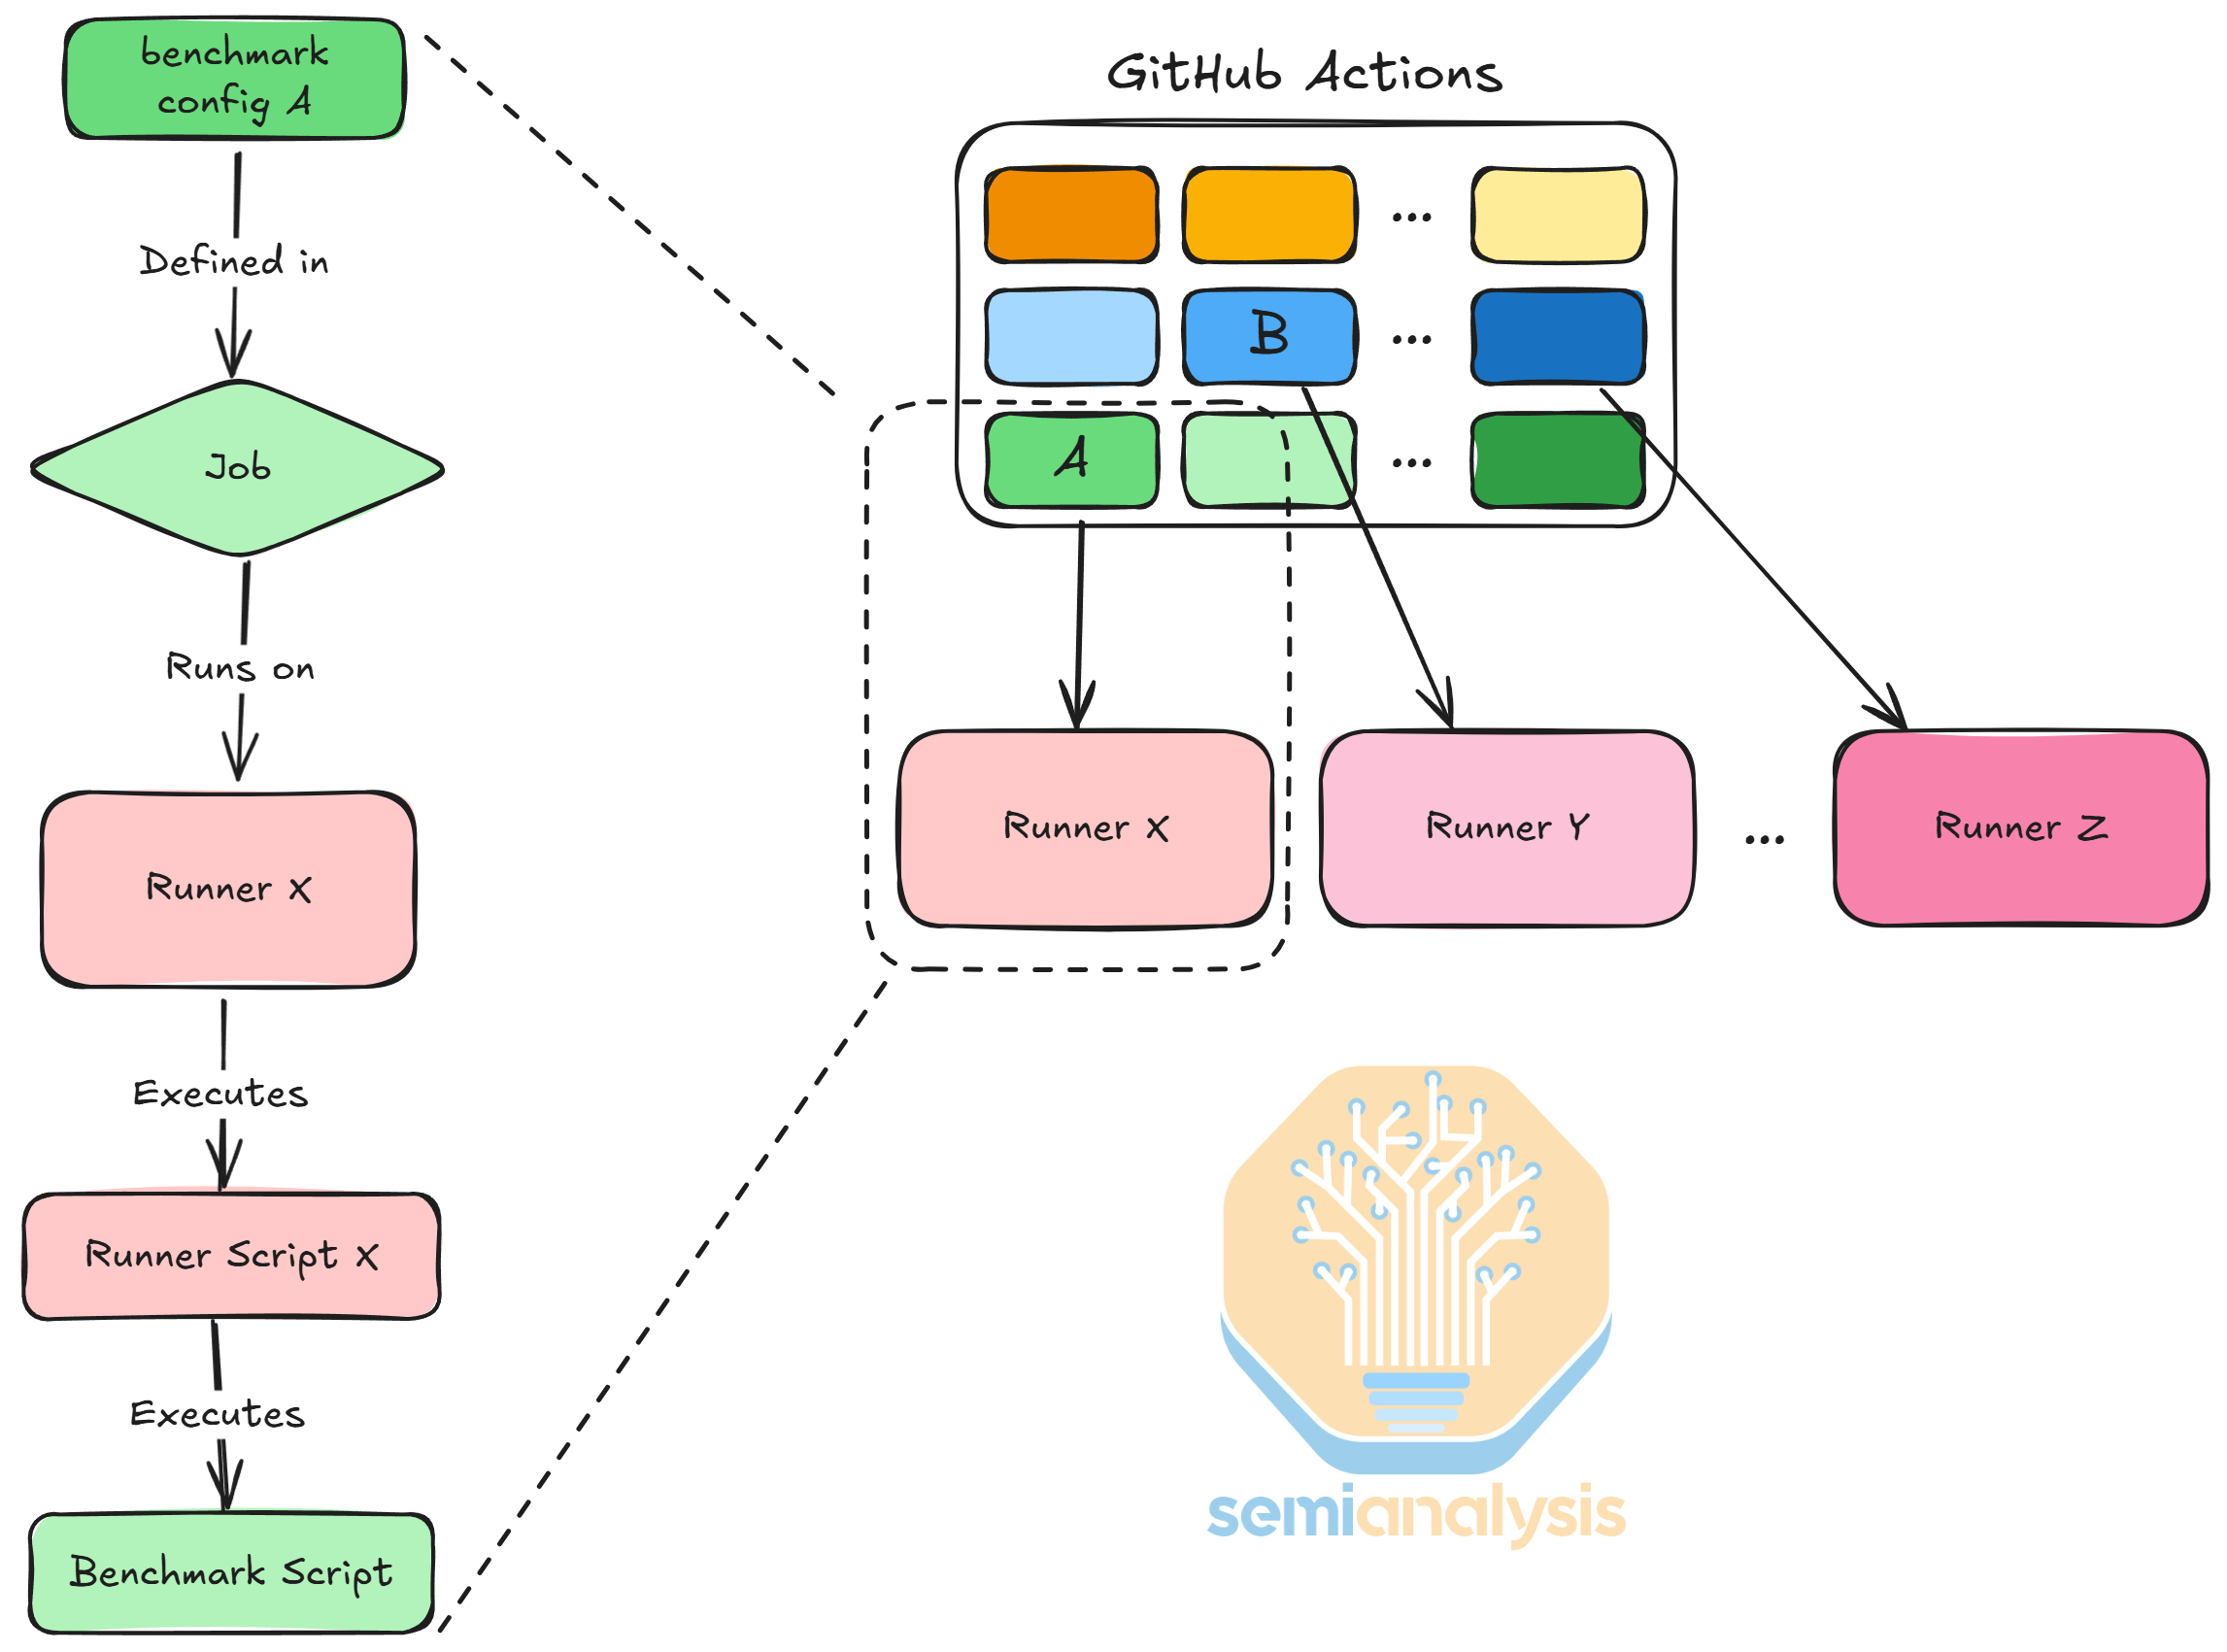
Architecture of InferenceMAX™
InferenceMAX™ uses GitHub Actions to orchestrate benchmark runs. A GitHub Action runs each benchmark config as a job and executes it on a runner. We hook GPU servers into GitHub Actions as runners, so they listen to requests and execute jobs. When executing a job, a runner will execute a runner launch script written for that server, which in turn uses Docker or SLURM, depending on the server setup. The launch script will then execute the benchmark script, which contains the concrete benchmark config.
We define the logic of parallelism strategies + max concurrency benchmark sweep as a parameterized workflow, and we incrementally compose the workflow to execute all GPU types for all models and GPUs, as well as different input / output sequence lengths.
Performance Results – Throughput vs E2E Latency/Interactivity (tok/s/user)
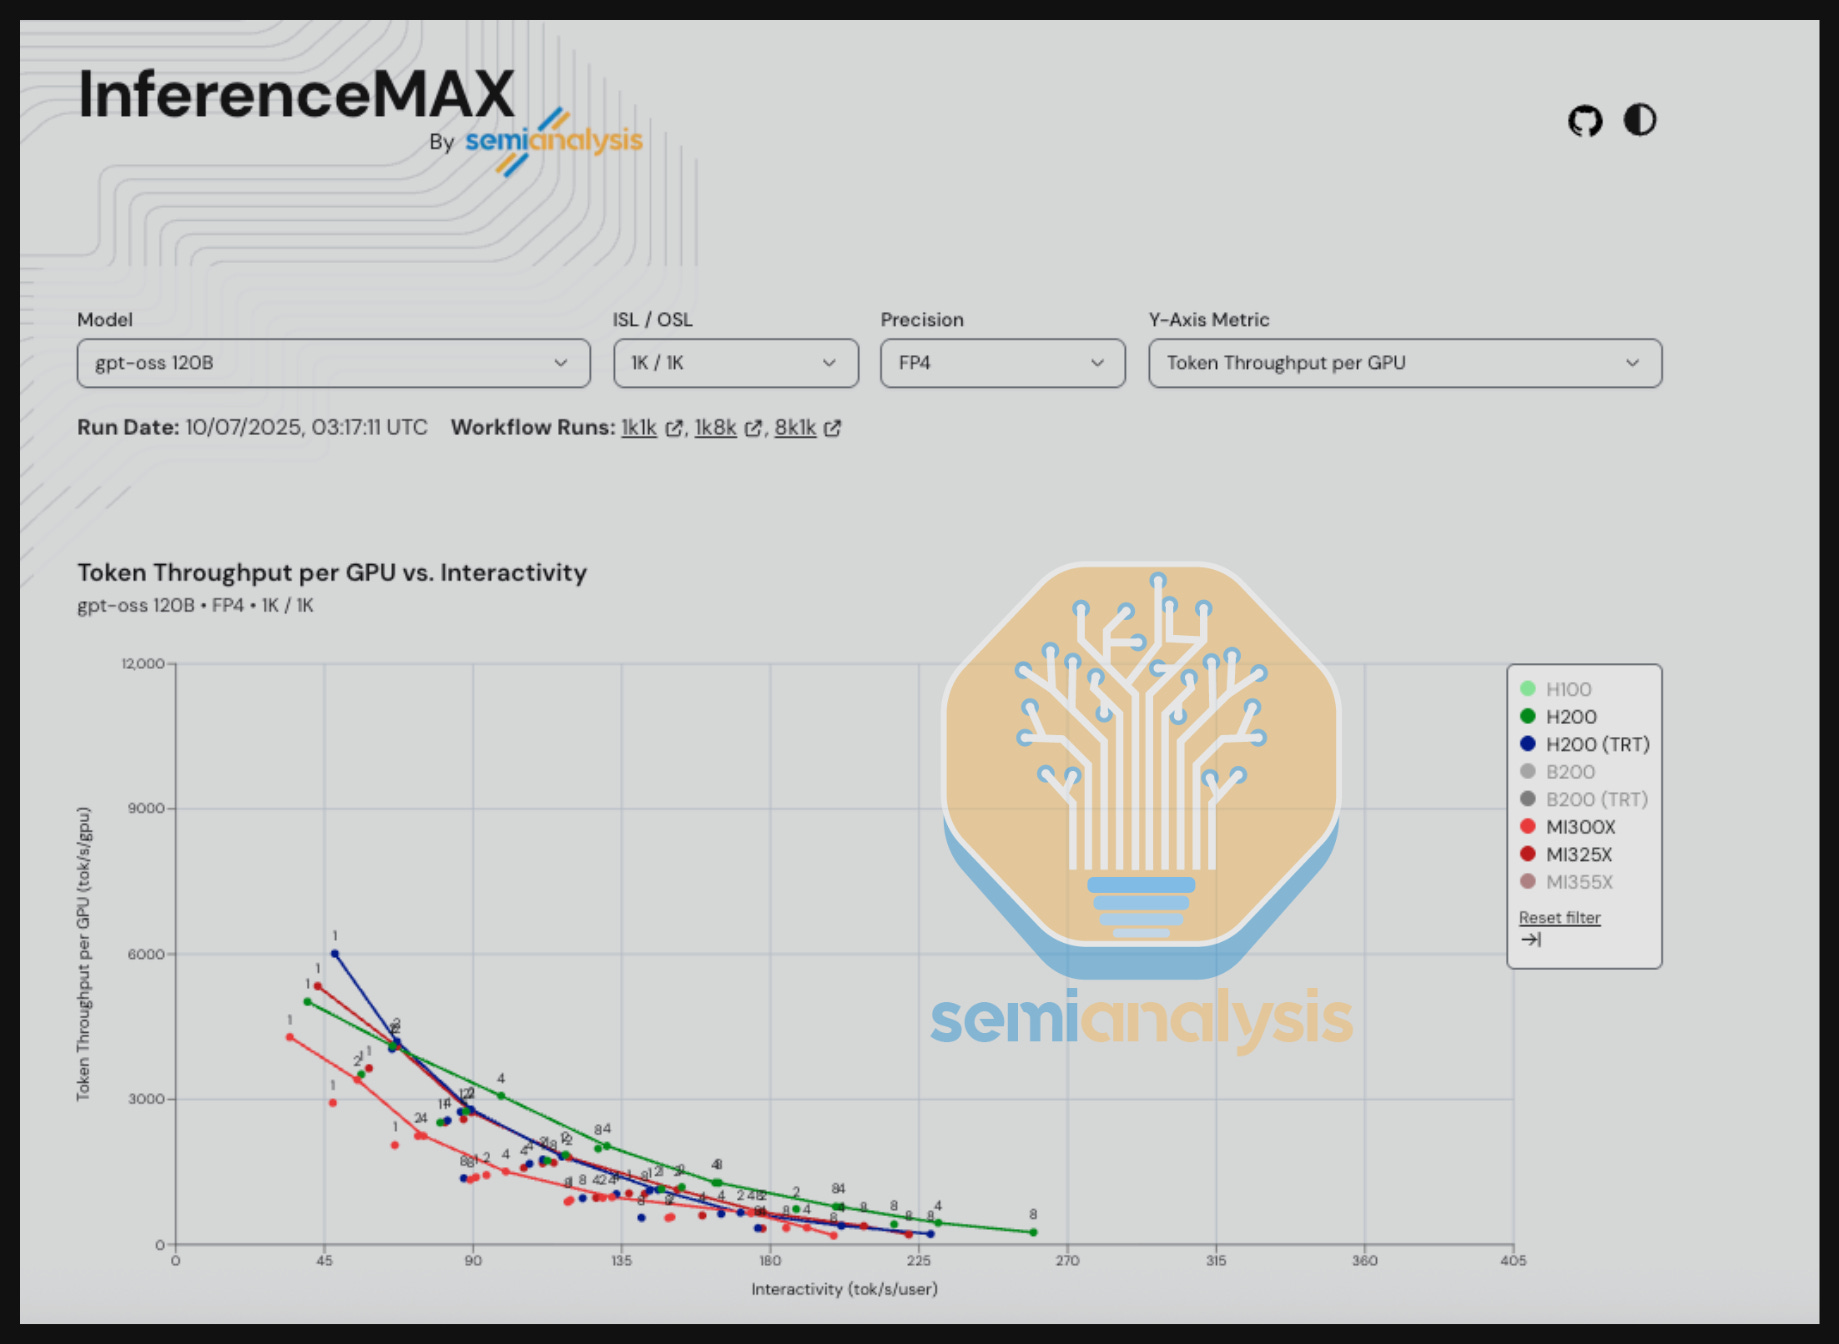
Below is the performance snapshot for the nightly run on October 7th, 2025 at the time of writing this article. For the full set of nightly results, visit our dashboards on http://inferencemax.ai/.
When interpreting throughput vs latency/interactivity graphs, keep in mind that most practical applications operate somewhere between the extremes. Benchmark results measuring only one or a limited level of throughput or interactivity can sometimes be misleading.
For instance, if GPU A delivers 4x the throughput of GPU B at a given interactivity level – take 5 tokens/s/user as an example for a human facing AI chatbot application, the fact that this interactivity level is far too slow to be practical means that this performance difference has little real-world significance. Instead – a realistic interactivity level should be chosen for the given applications.
Later in this report, we will be also be normalizing throughput of GPUs by the total cost of ownership (TCO) of those GPUs.
TCO per million tokens is the true north star that customers care about – performance is merely a stepping stone to calculating this metric. For example, a B200 could deliver 1.5x higher throughput than an MI355X, but if it has 2x the TCO per hour – the MI355X would be the better choice as it delivers better performance per TCO even if the MI355X delivers lower absolute performance in terms of throughput per GPU.
Let’s step through a few benchmark examples to explain how to analyze the results.
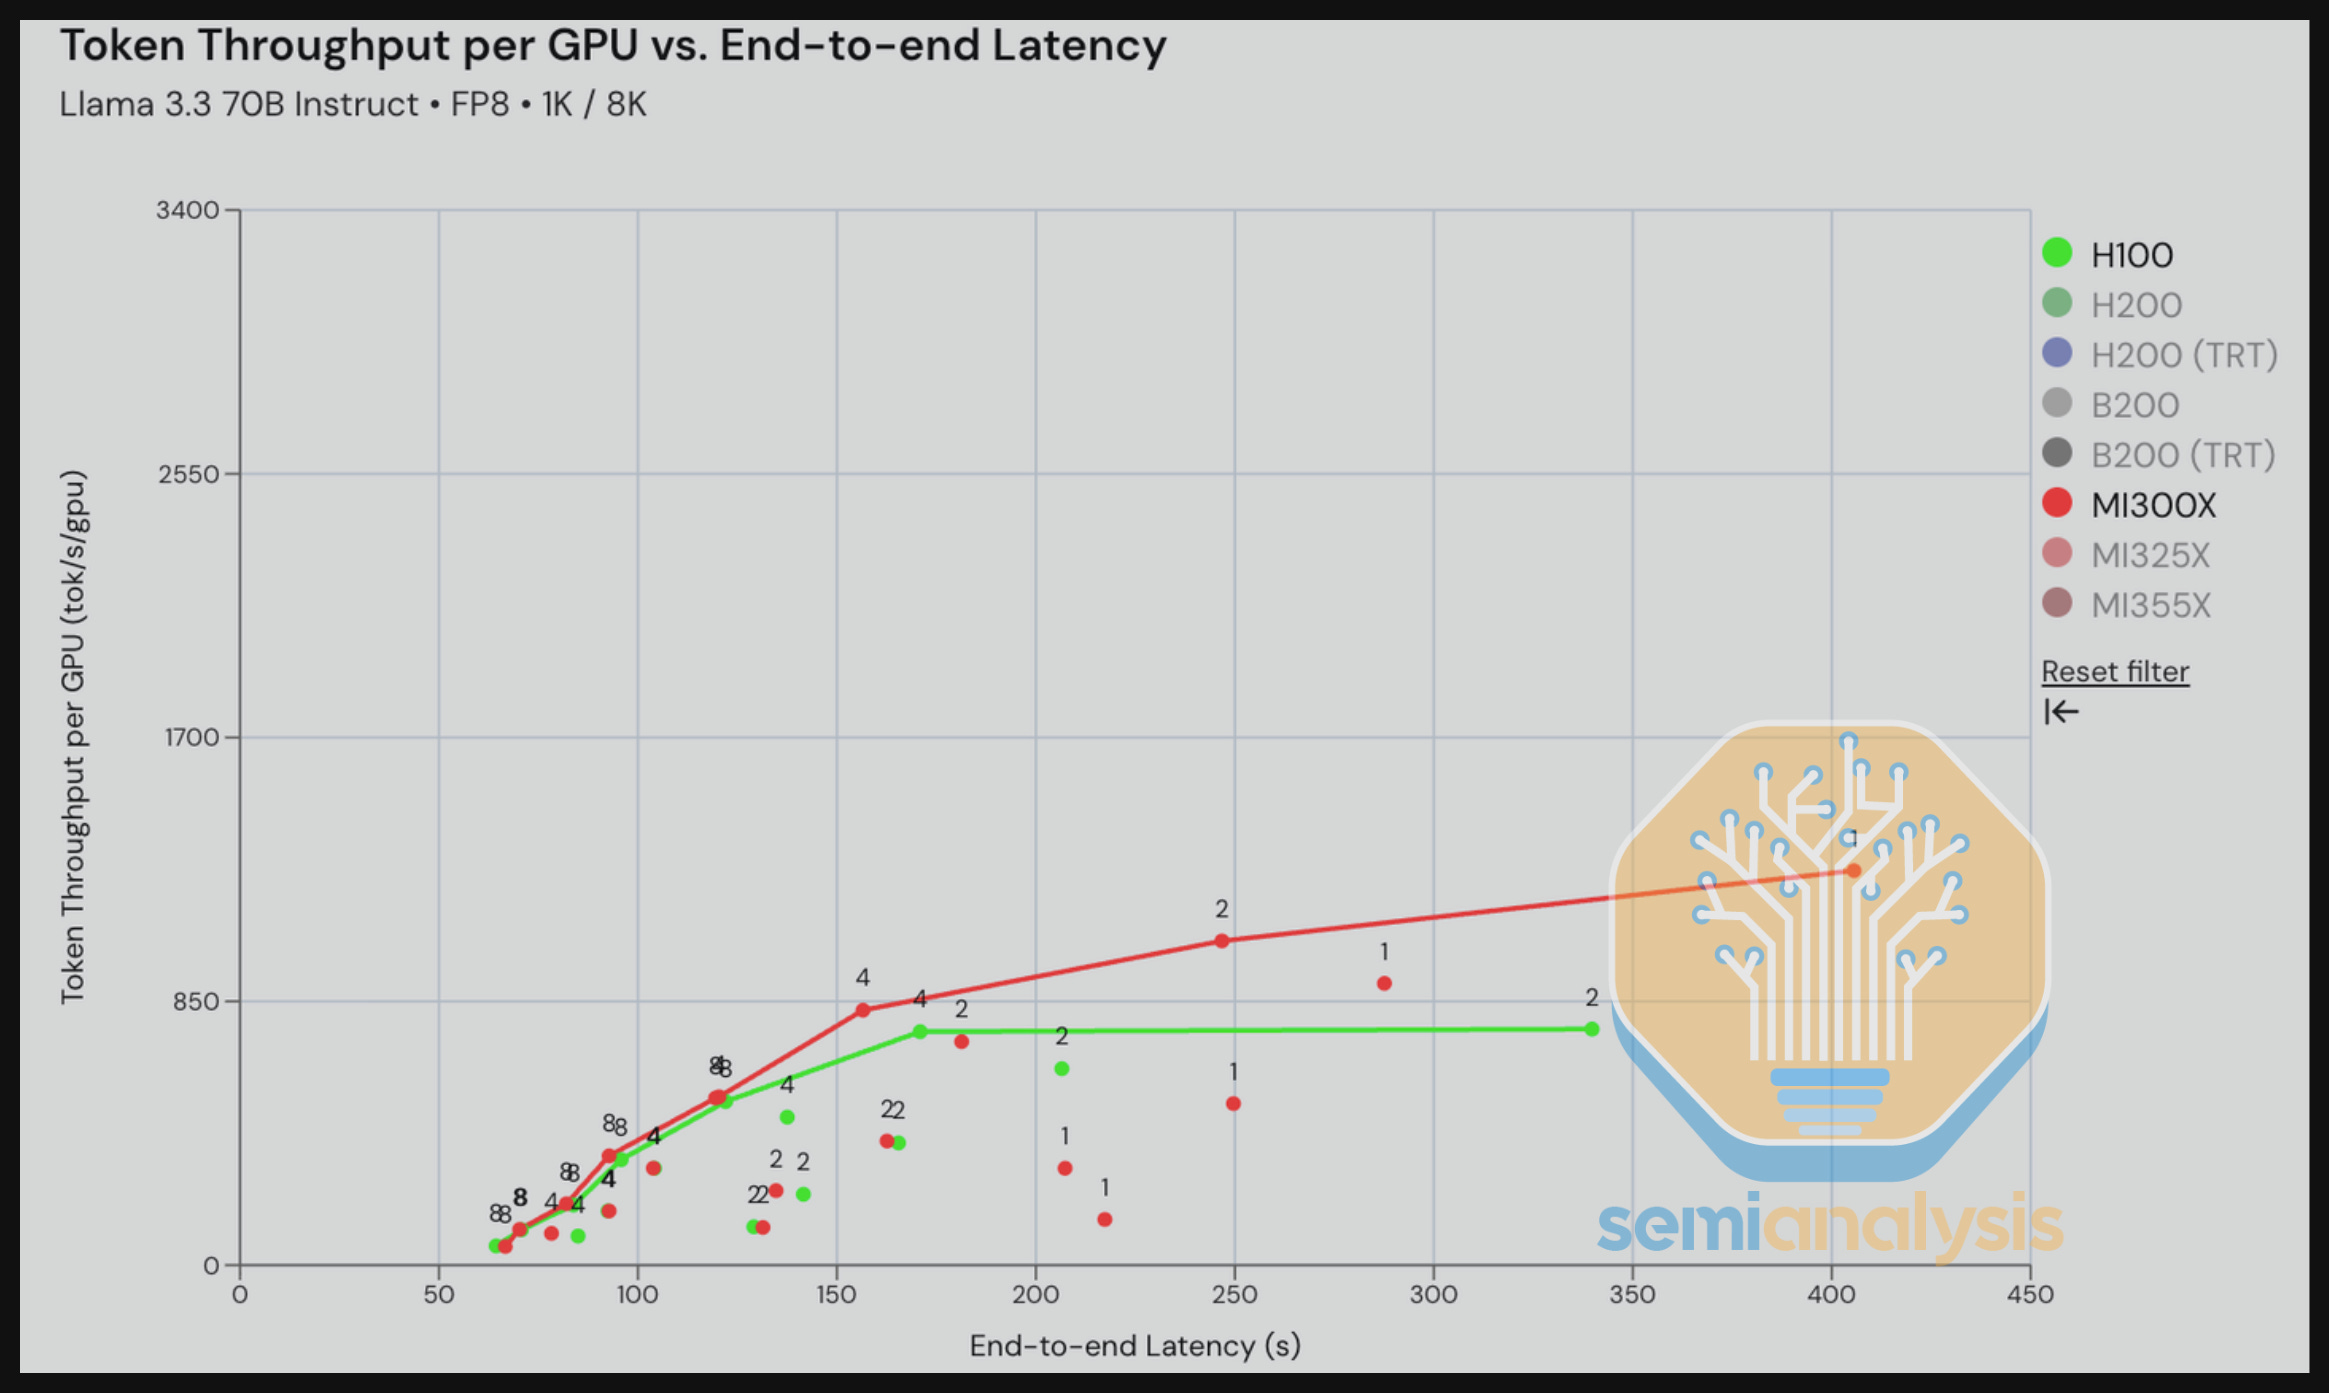
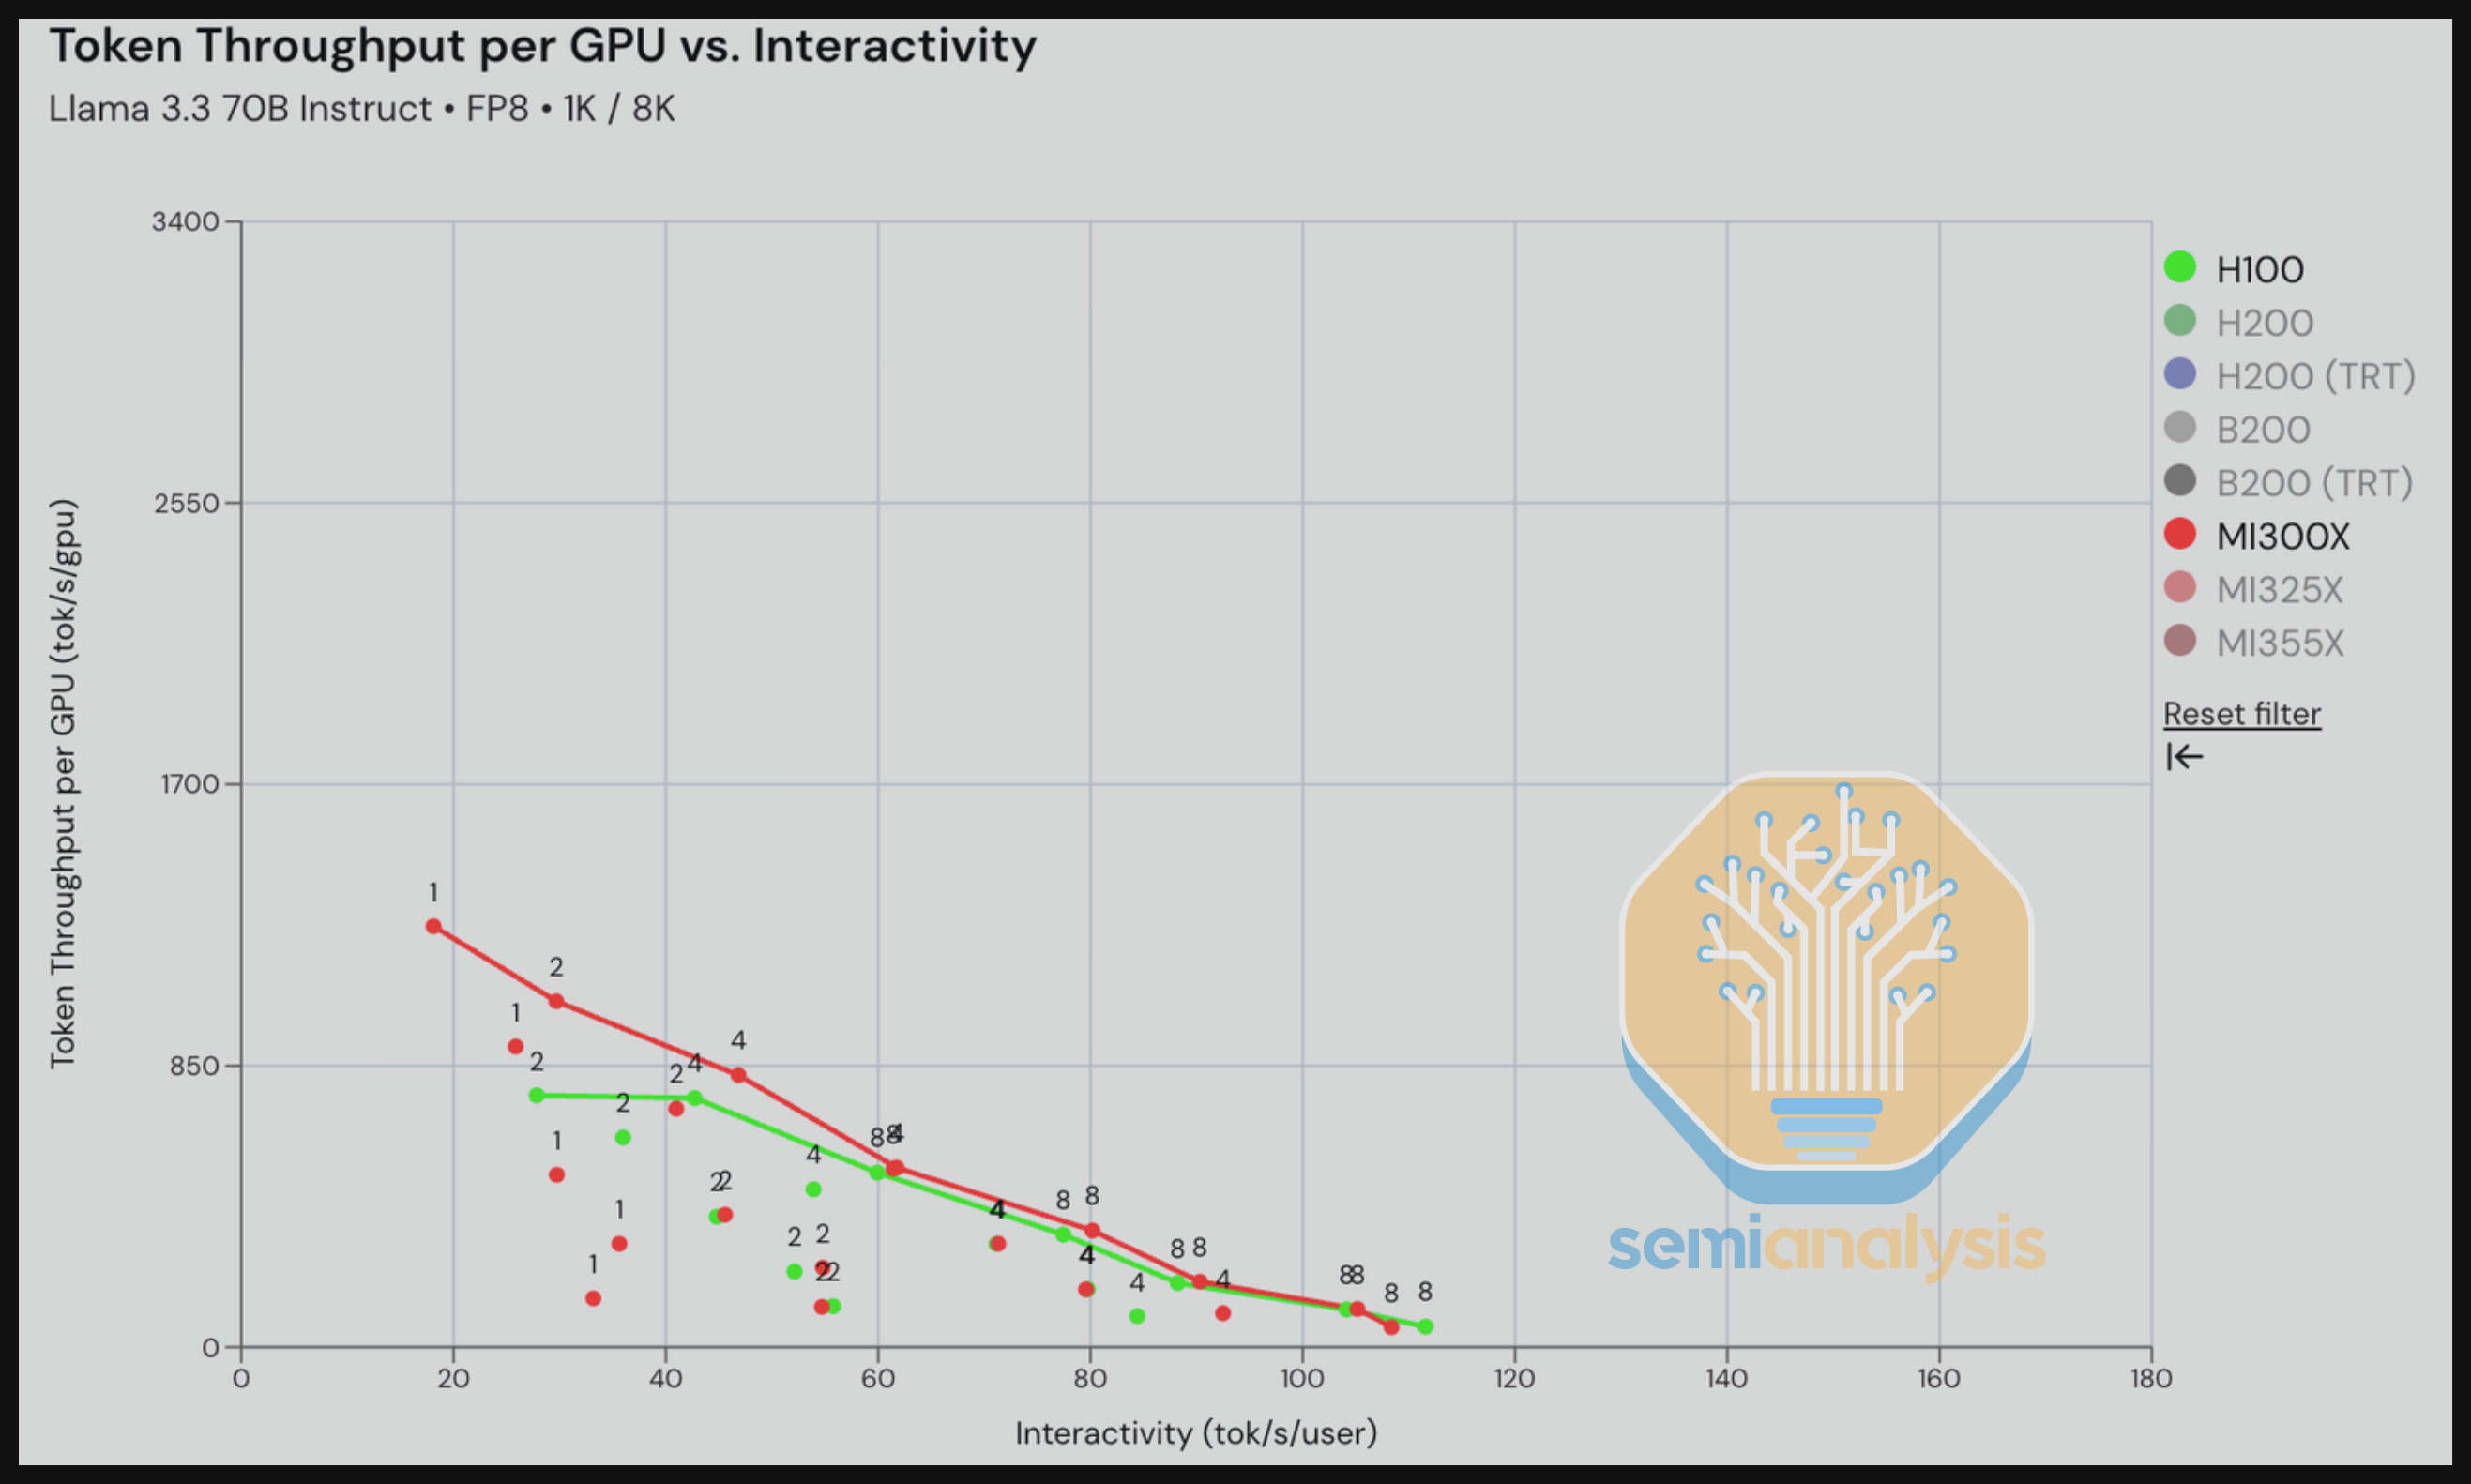
In our first result, the H100 vLLM vs MI300X ROCm 7.0 vLLM comparison for Llama 3.3 70B FP8 in our reasoning scenario (1k in/ 8k out) shows a strong MI300X performance especially at low interactivity levels (20 to 30 tok/s/user) due to the MI300X’s better memory bandwidth and memory capacity advantages when running at TP1.
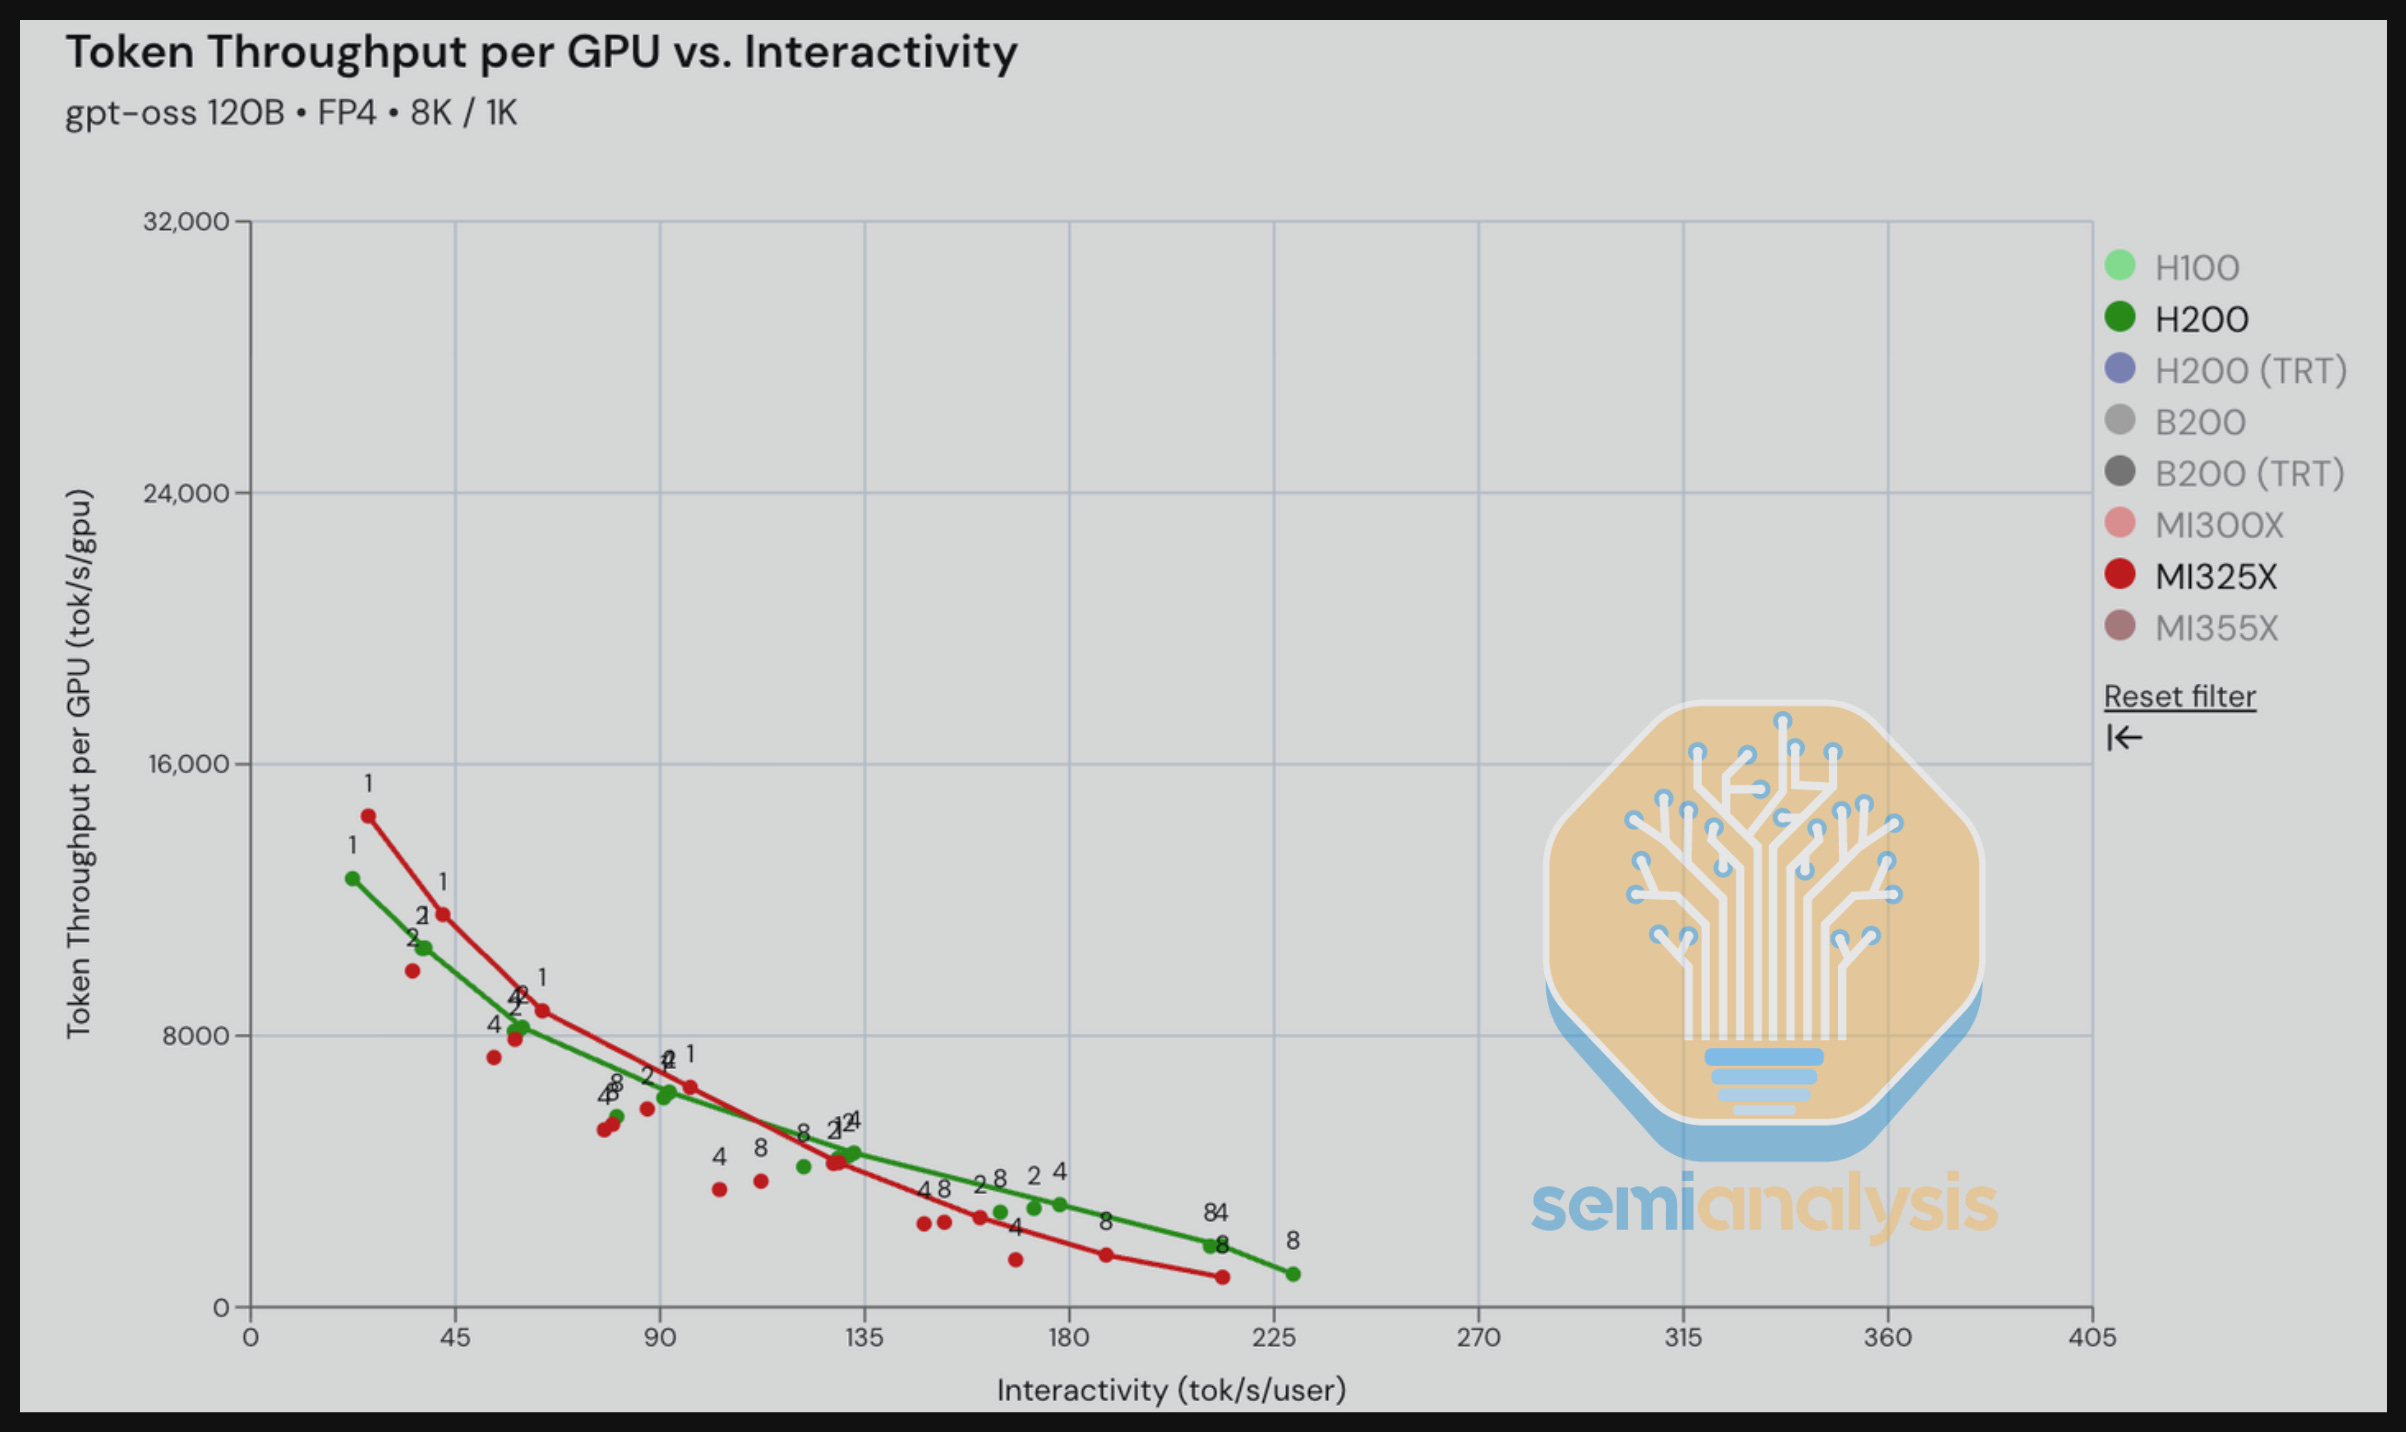
We are seeing competitive results comparing the H200 and the MI325X on vLLM GPT-OSS 120B with MX4 weights for a summarizing workload. The MI325X has an advantage over H200 for interactivity below 110 tok/s/user and still is somewhat competitive with Nvidia for levels above 110 tok/s/user.

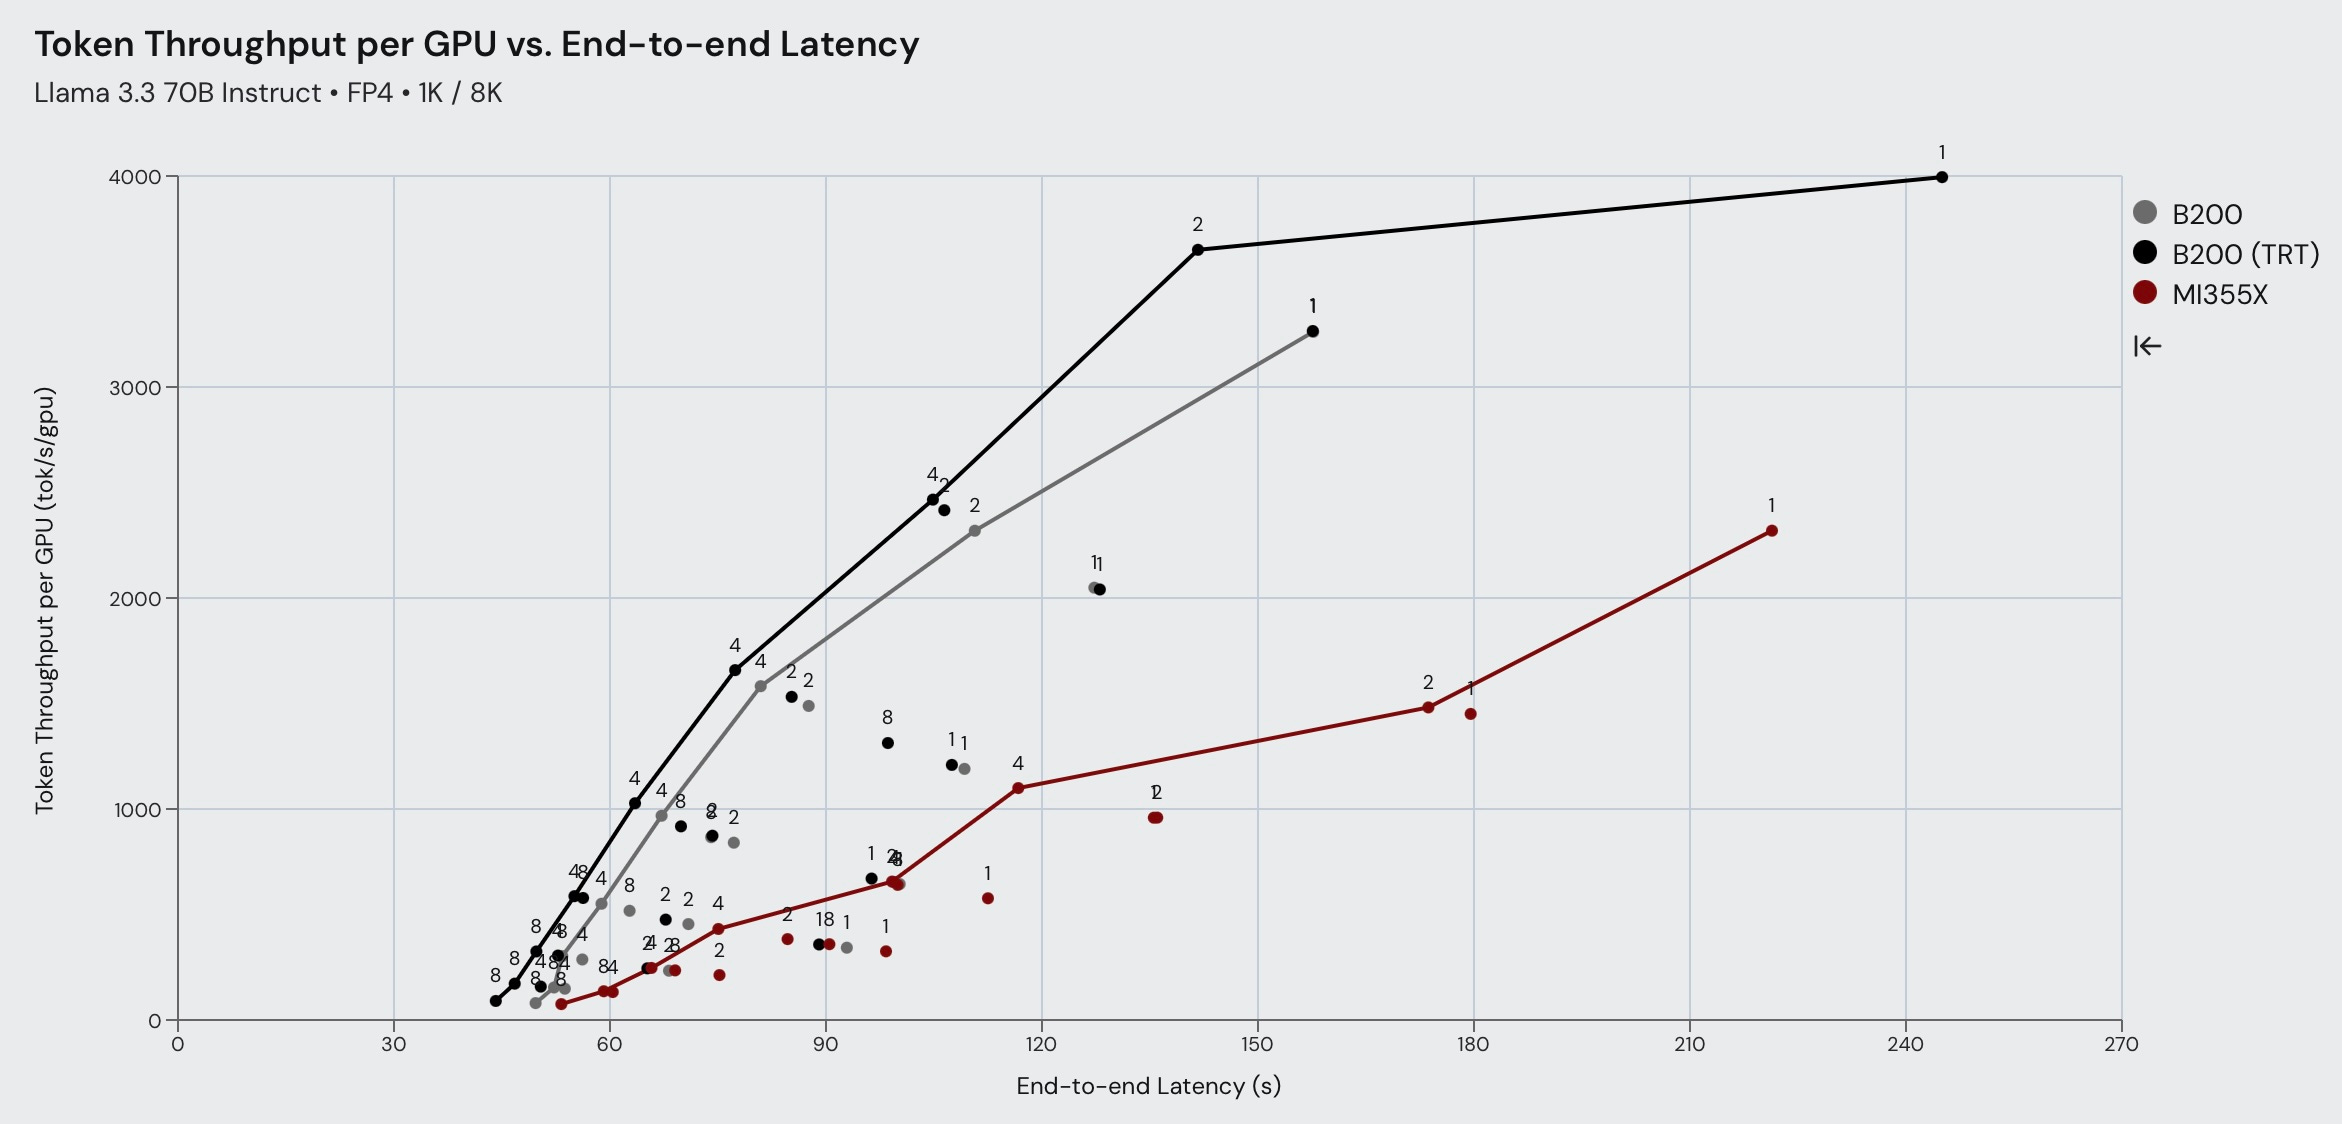
When it comes to LLaMA 70B FP4, B200 significantly outperforms MI355X across all three workload types in terms of throughput performance. This shows that AMD’s FP4 kernels have room for improvement.
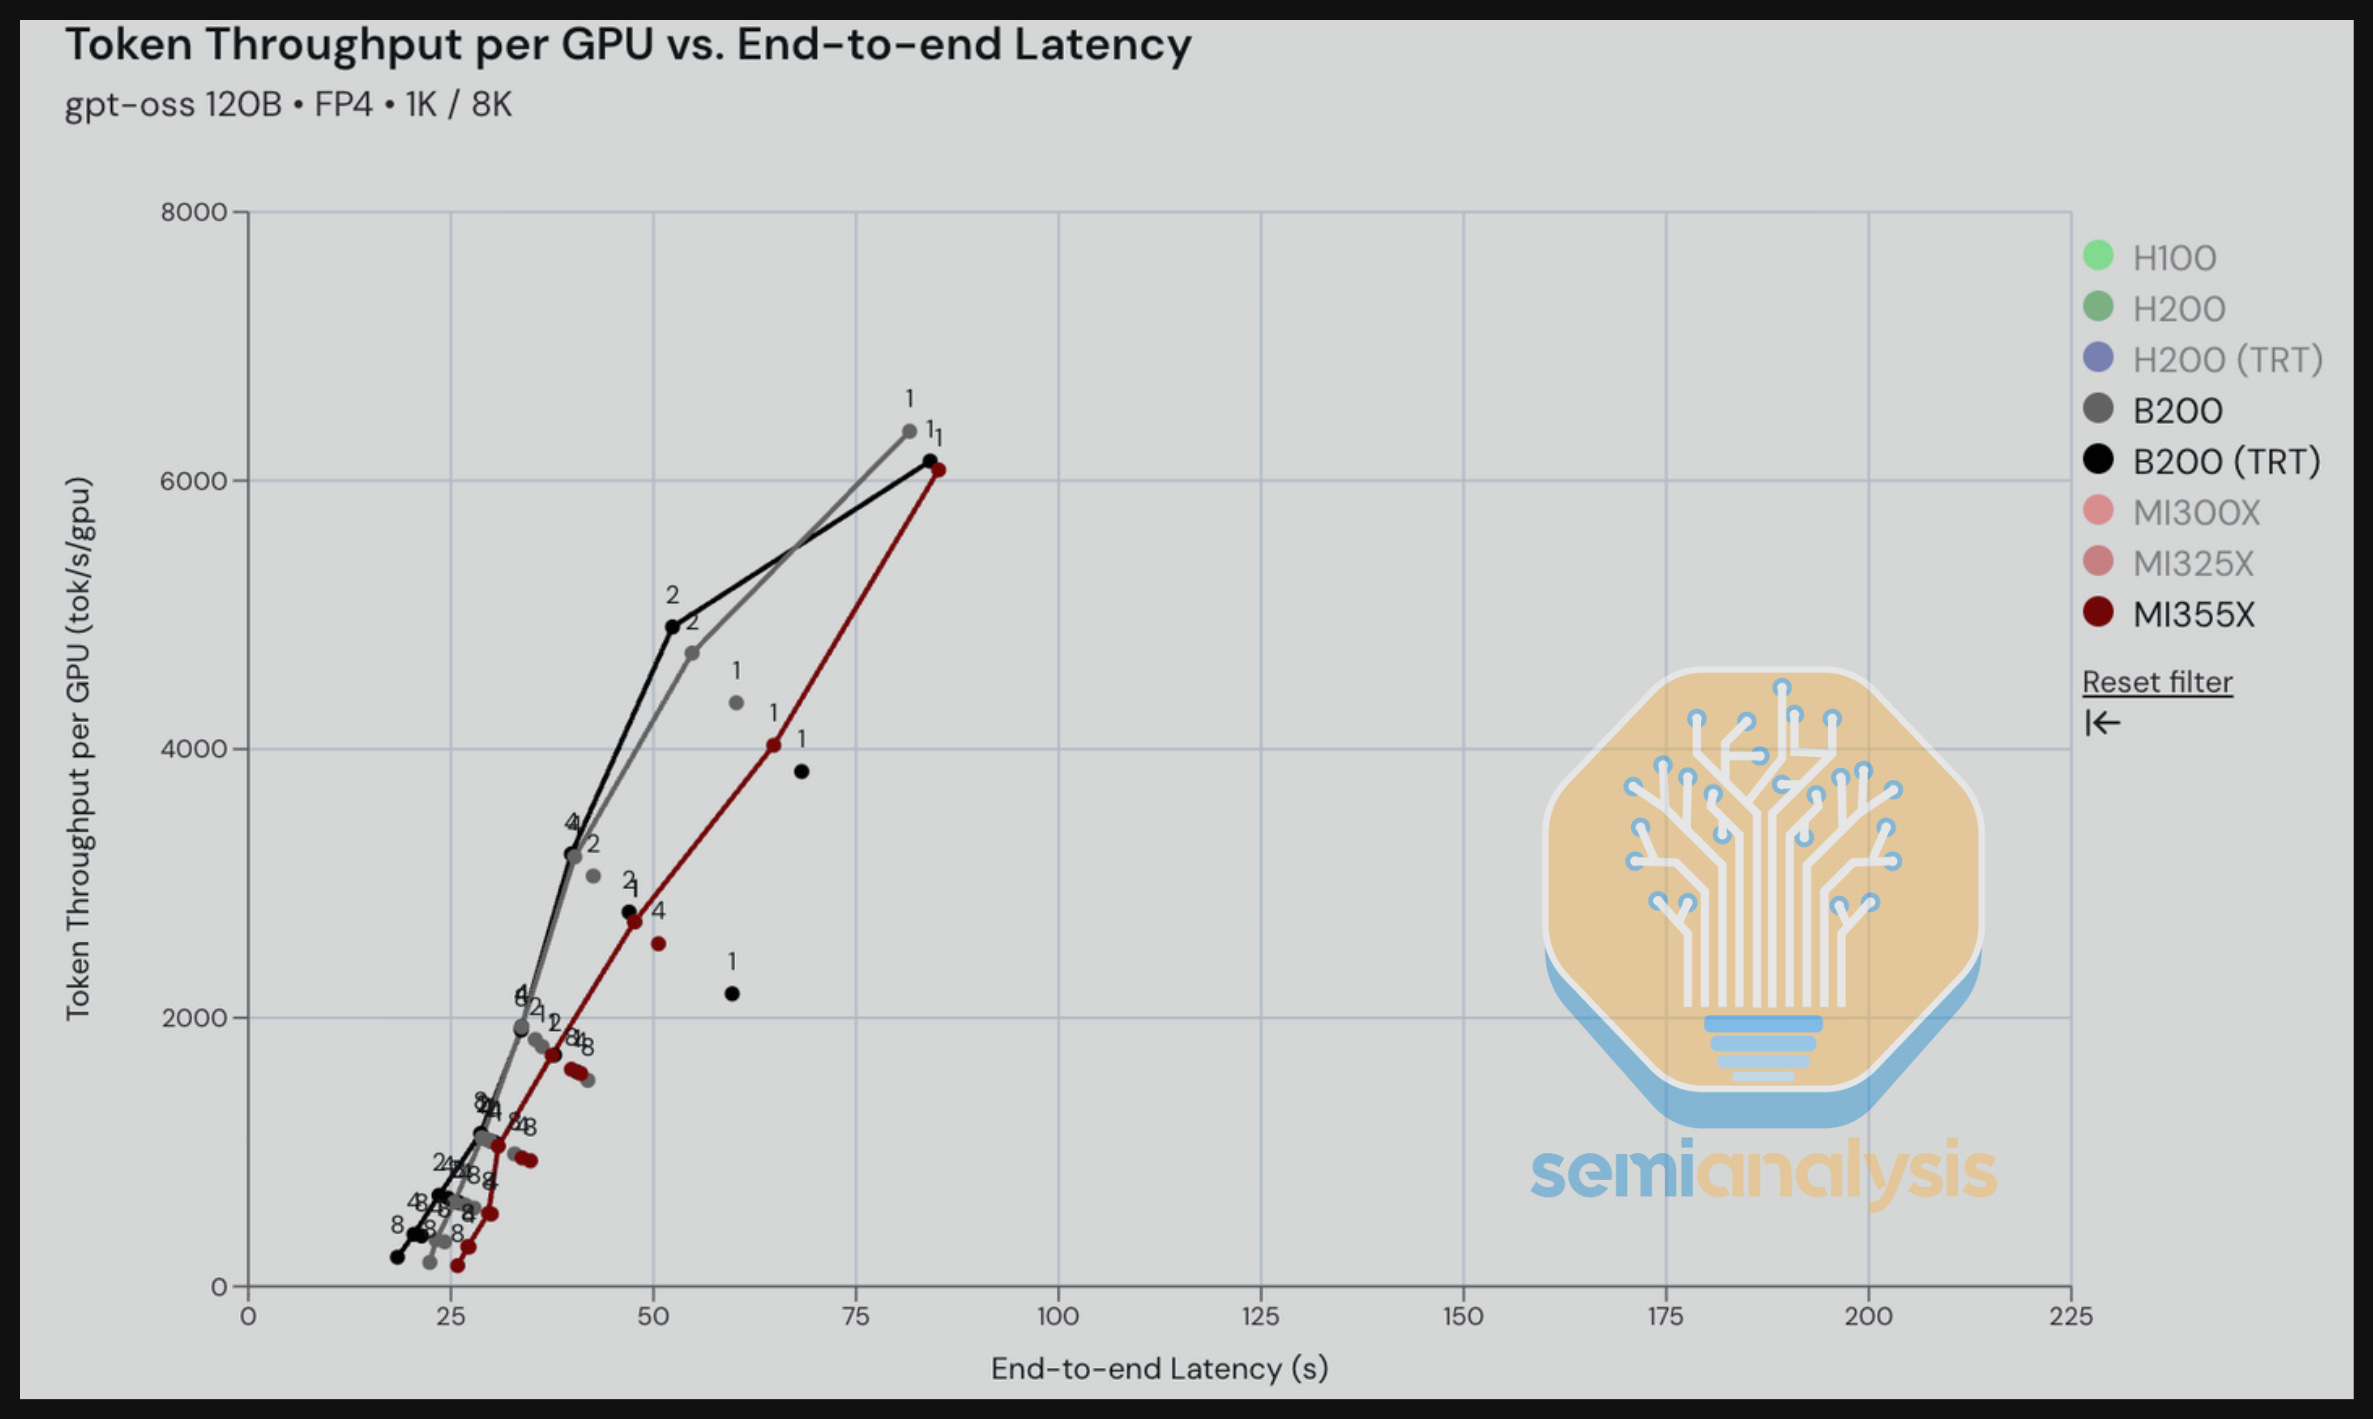
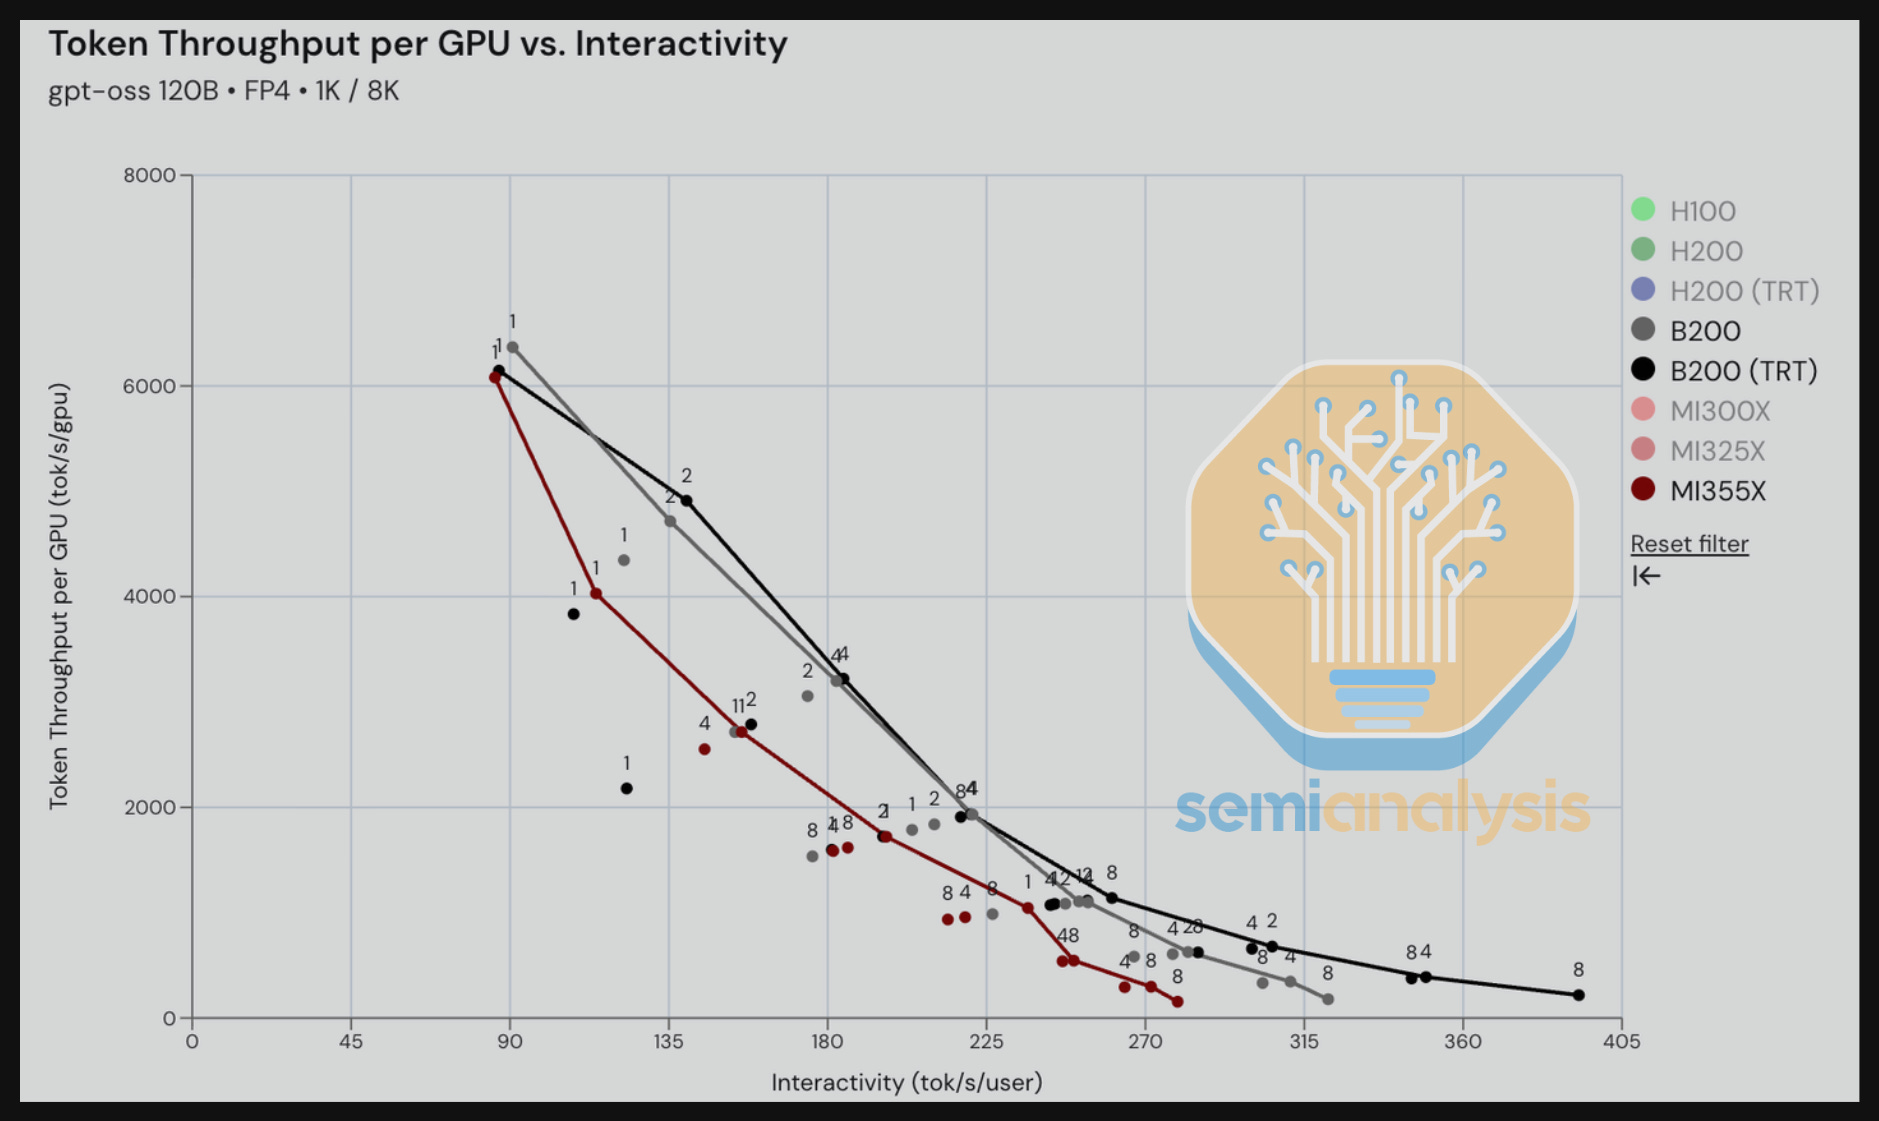
Moving on to the B200 (vLLM and TRT-LLM) vs. MI355X vLLM for GPT-OSS 120B, we can see that MI355X is competitive with B200 vLLM after normalizing by TCO. In the next section, we will see that MI355X across some interactivity ranges is better perf per TCO than Nvidia. The throughput-latency graph appears to show a tighter race, with the MI355x never more than ~15 seconds slower than the B200 for a given tok/s/gpu throughput. The most practical range of interactivity we see in the real world is approximately 150-200 tok/s/user for GPT-OSS 120B.
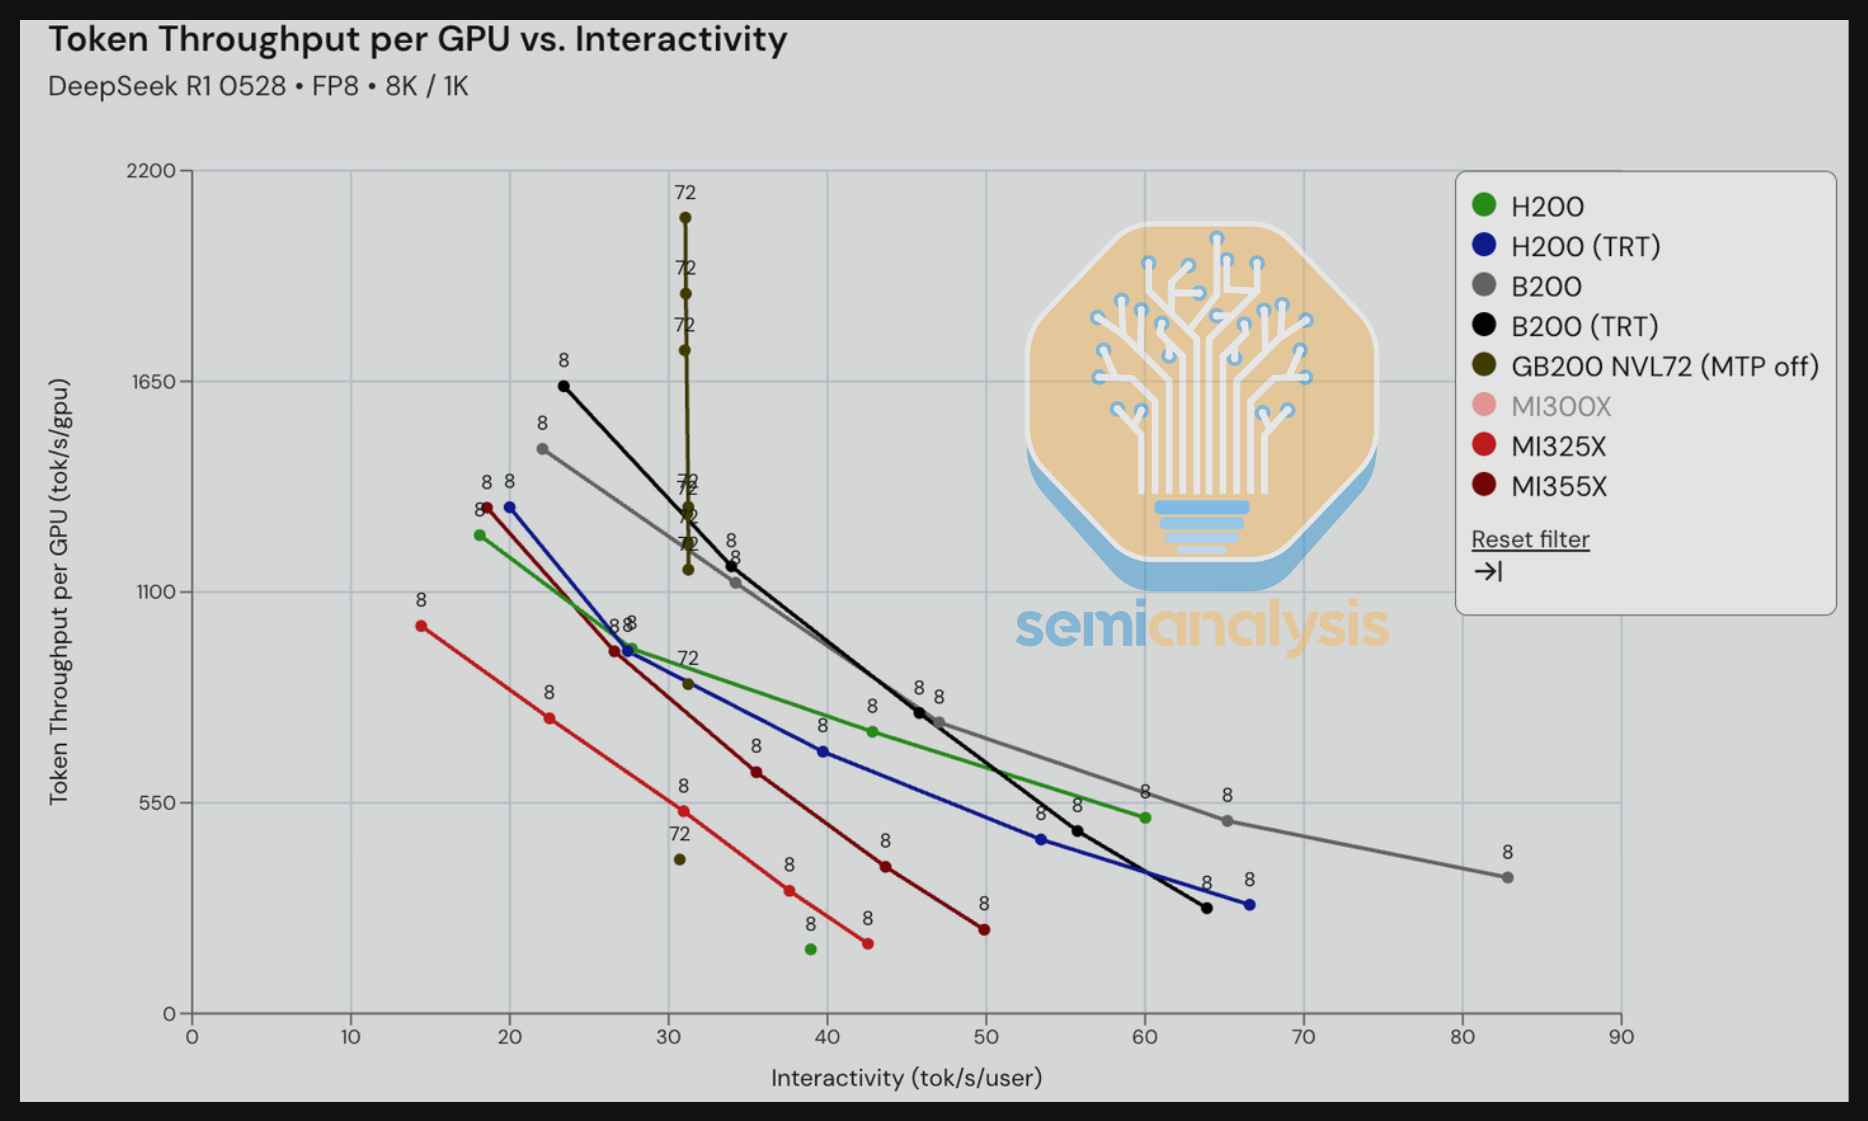
Moving to DeepSeek 670B MoE FP8, when comparing the MI325X on SGLang vs. the H200 on SGLang, we observe that the MI355X lags significantly in both latency and interactivity for a given level of throughput. The H200 on SGLang serves inference consistently at approximately 40% lower latency than the of MI325X for comparable throughputs. Furthermore, we also see a steady gap when comparing the Pareto frontier of their interactivities. Comparing the MI355X on SGLang and the B200 on SGLang tells a similar story to our MI325X vs H200 comparison. There appears to be lots of room for improvement for AMD when it comes to SGLang images.
We can also see that for GB200 NVL72 SGLang Dynamo FP8 rack scale inferencing, it is not yet optimized and there is still room for improvement.
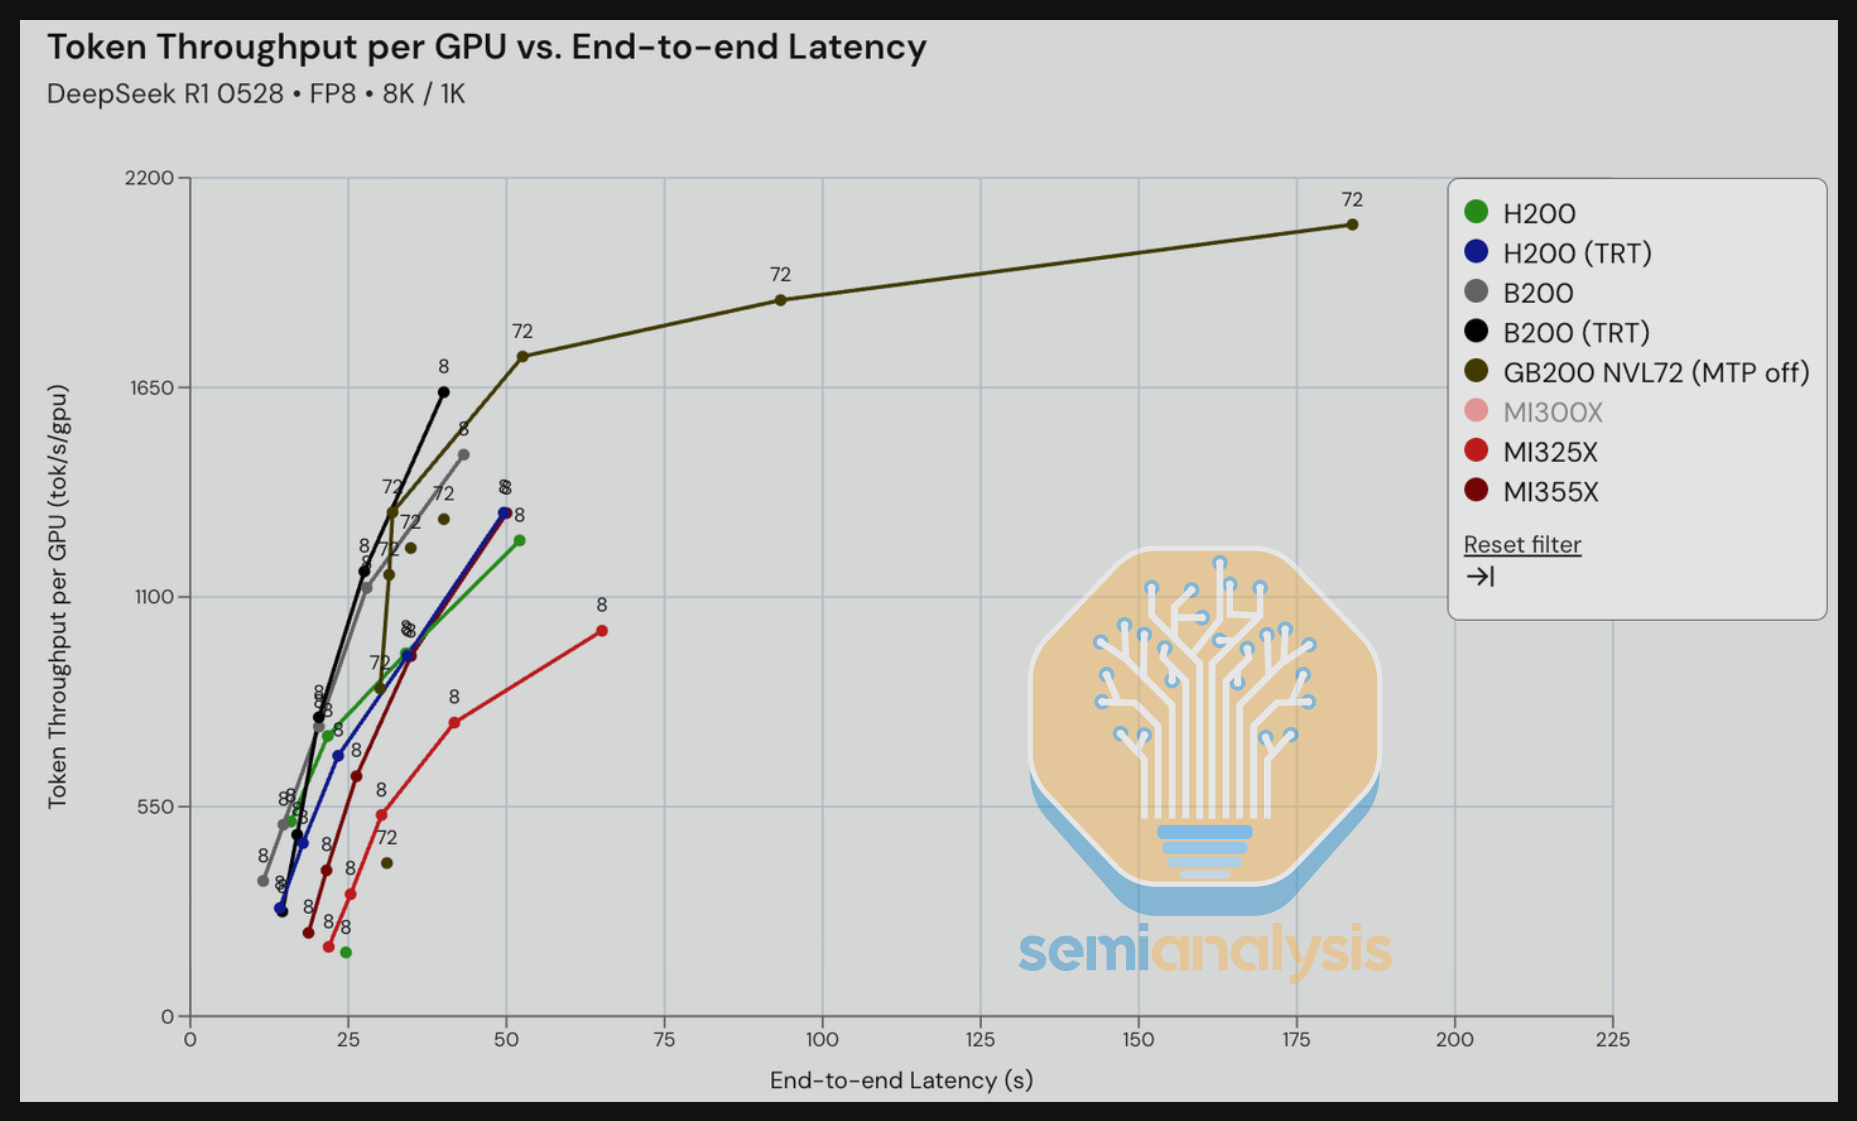
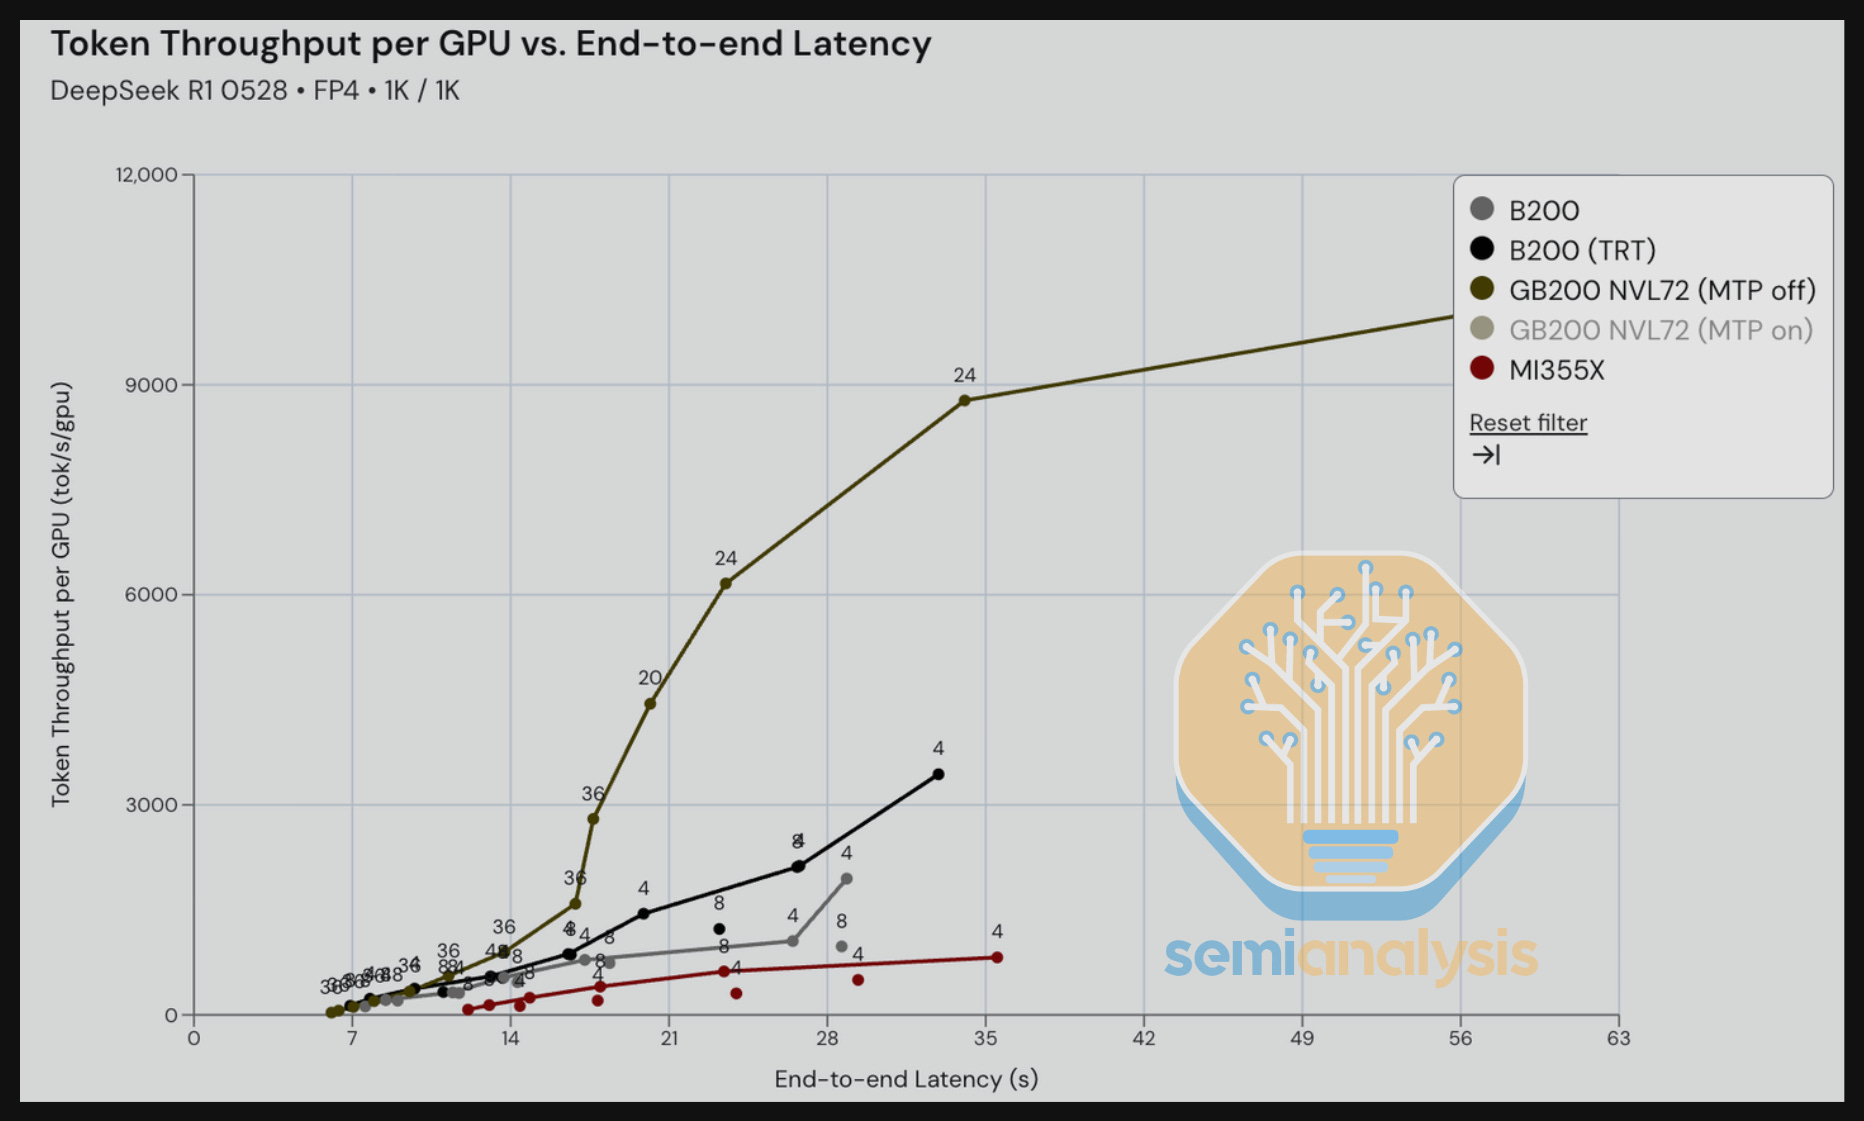
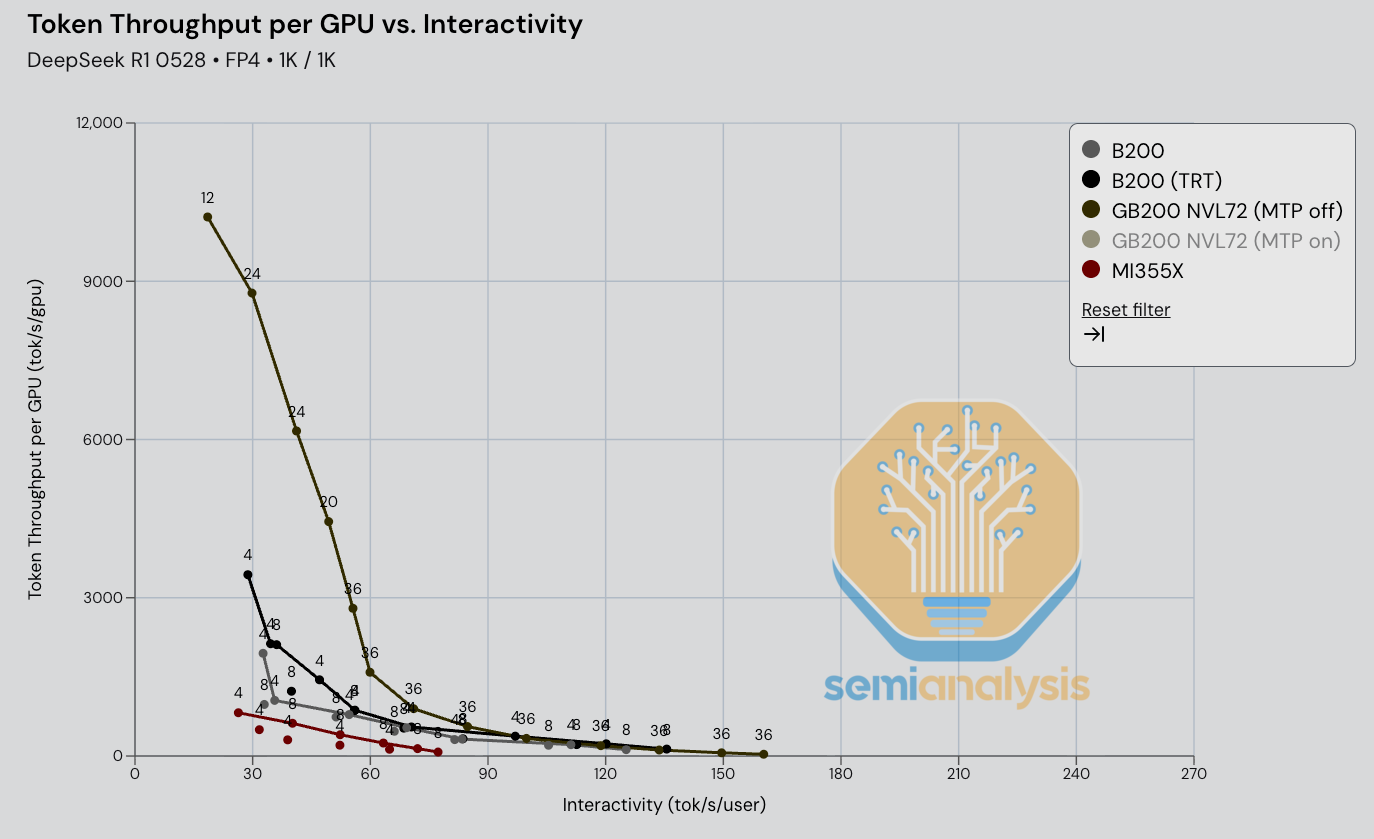
Moving on FP4 DeepSeek 670B MoE, we see that GB200 NVL72 rack scale TRT-LLM inference beats single node SGLang inference by a wide margin. We look forward to benchmarking wideEP + disagg prefill on multi-node 8-way machines over the next couple of months.
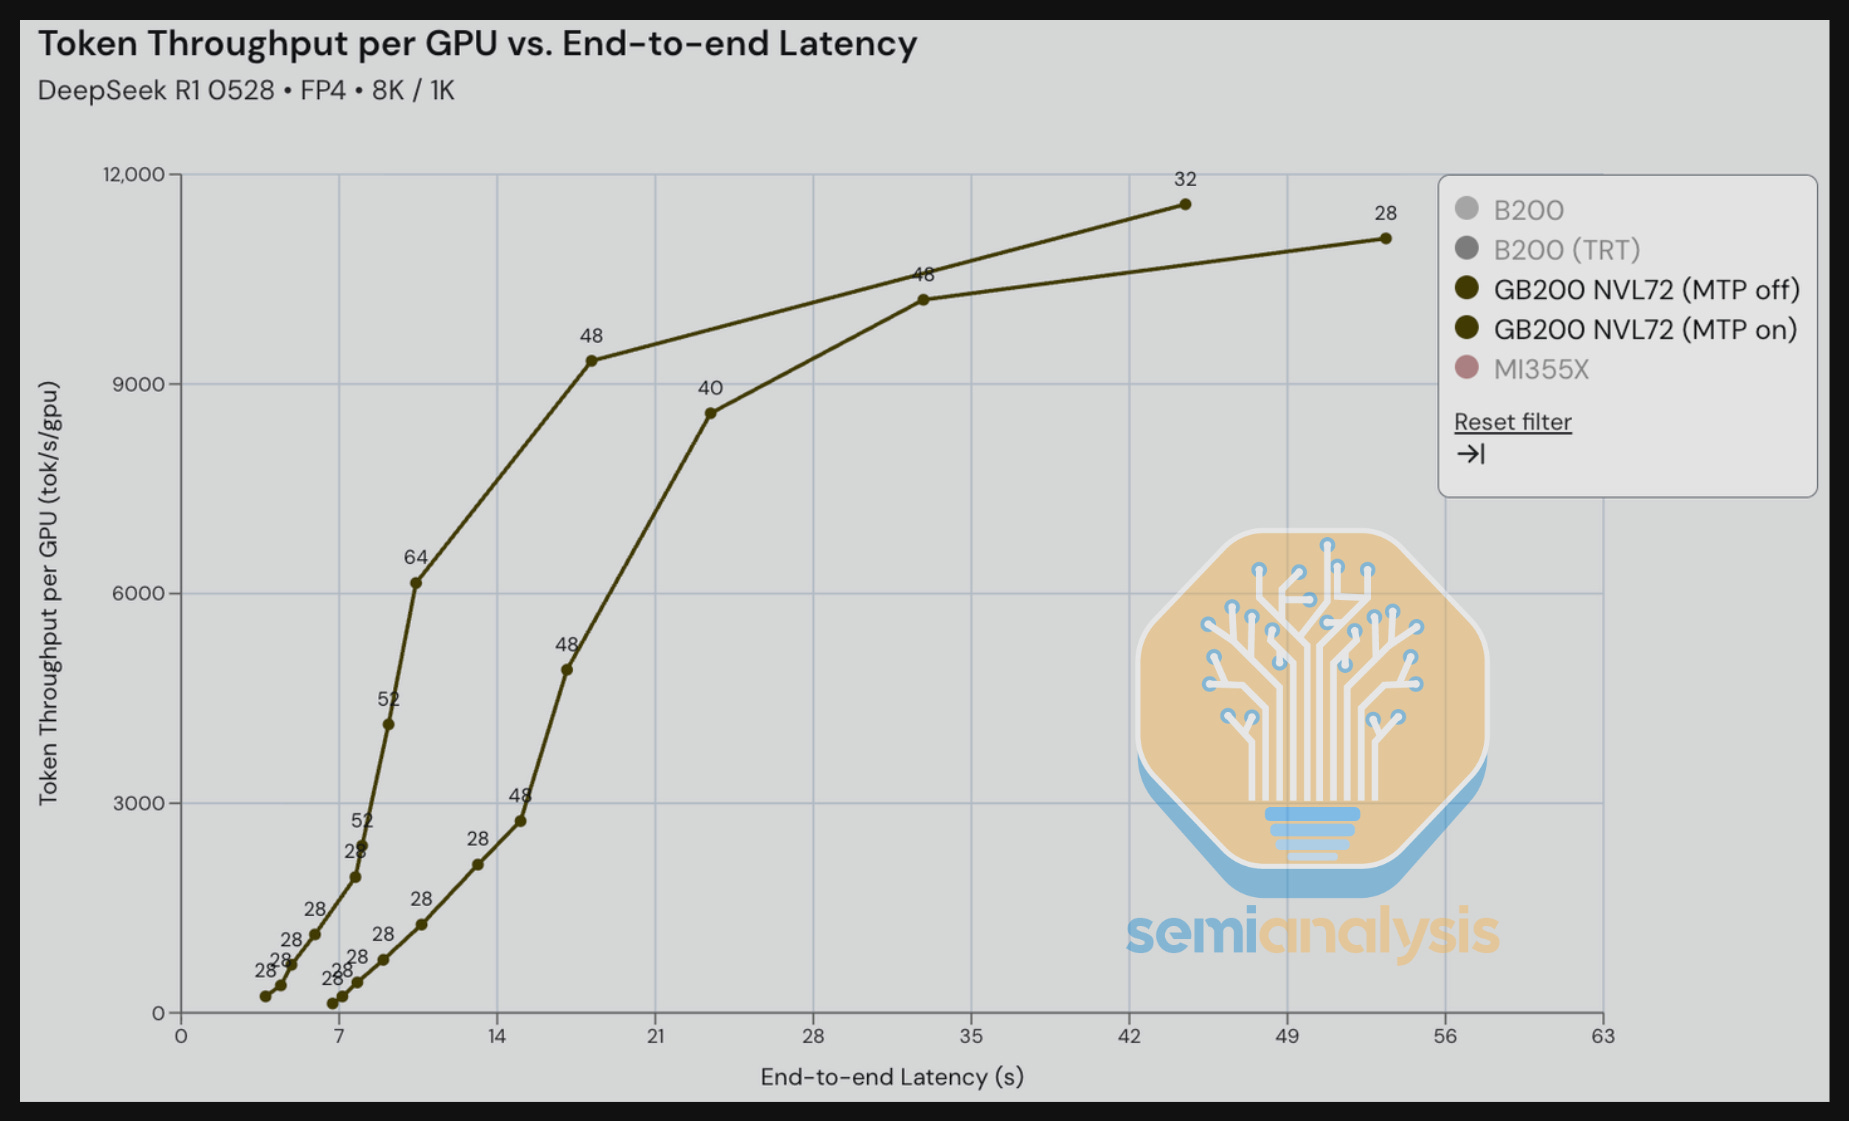
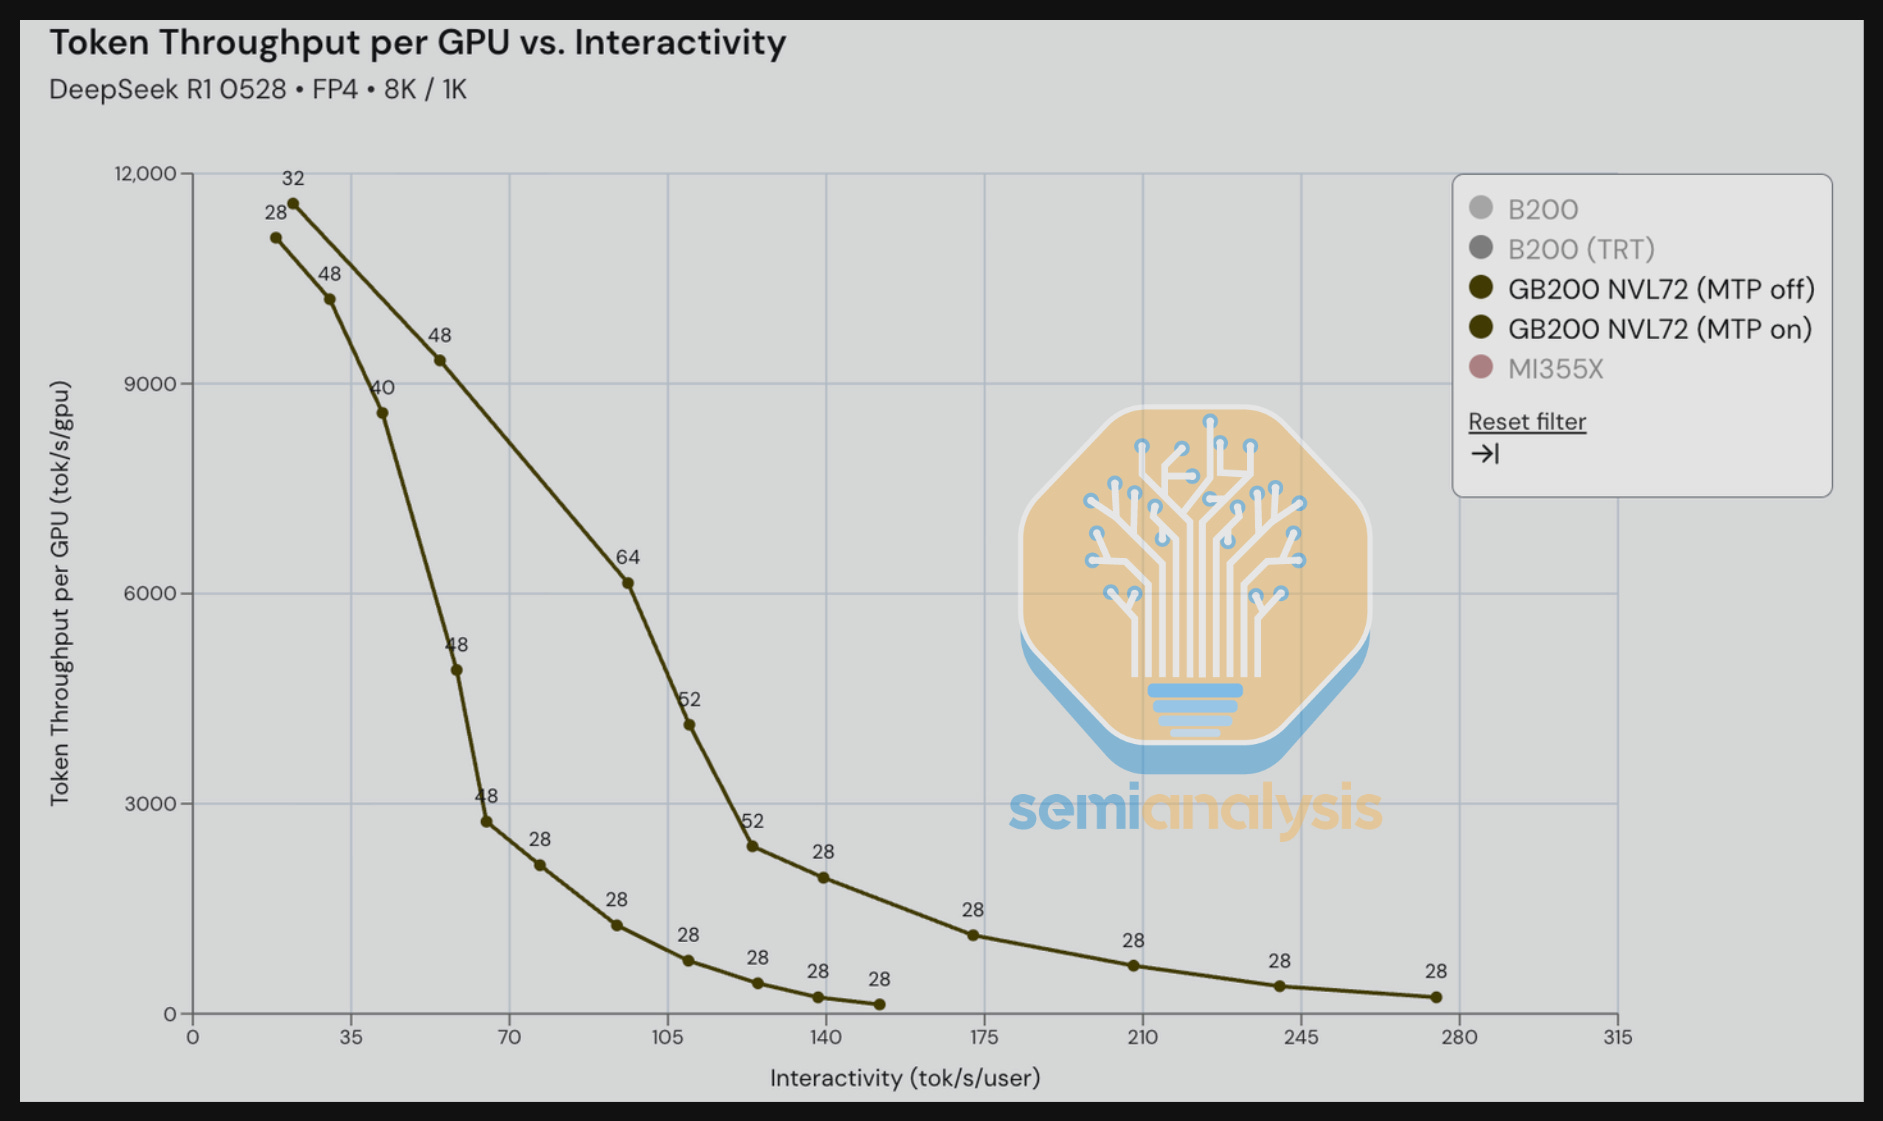
Next, we compare GB200 with Multi-Token Prediction (MTP) On and Off for DeepSeek R1 in an 8K input / 1K output scenario – an input/output ratio that is meant to reflect summarization use case. The MTP On benefit is particularly noticeable comparing throughput vs. interactivity. Between the range of 70-140 tok/s/user, we see significantly higher throughput/GPU for the MTP On scenario when compared to the MTP Off – up to 2-3x the throughput for some iso-interactivity (tok/s/user).
Performance Results – TCO Per Million Tokens Versus Interactivity (tok/s/user)
However, comparing token throughput per GPU is just one of a few data points needed to get to the real bottom line, namely total cost of ownership (TCO) per token.
ML inference engineers typically measure this in units of TCO per million tokens. To get from throughput per GPU to TCO per million tokens, we must normalize by the total cost of ownership in units of USD/hr/GPU when comparing chips to chips. For example, if a B200 delivered 1.5x higher throughput than the MI355X but had 2x the TCO per hour – the MI355X would be the better choice, even if it delivers lower absolute performance.
At our InferenceMAX™ portal, located at http://inferencemax.ai/, we have estimated the TCO per million vs. latency/interactivity for various customers segments such as:
Hyperscalers and Tier 1 Frontier Labs Buying & Owning Chips (4-year Economic Useful Life)
Neocloud Giants and Giant Managed Inference providers that plan to own their own chips (4-year Economic Useful Life)
Renting GPUs from Neoclouds with 3 Year contract, with 25% upfront payment
Modeling Total Cost of Ownership per Token is no mean feat and it involves multiple SemiAnalysis teams and practice areas. In the AI Token Factory Economics stack, we show all the assumptions that are used to derive this north star metric, as well as the SemiAnalysis Models used to determine these quantities.
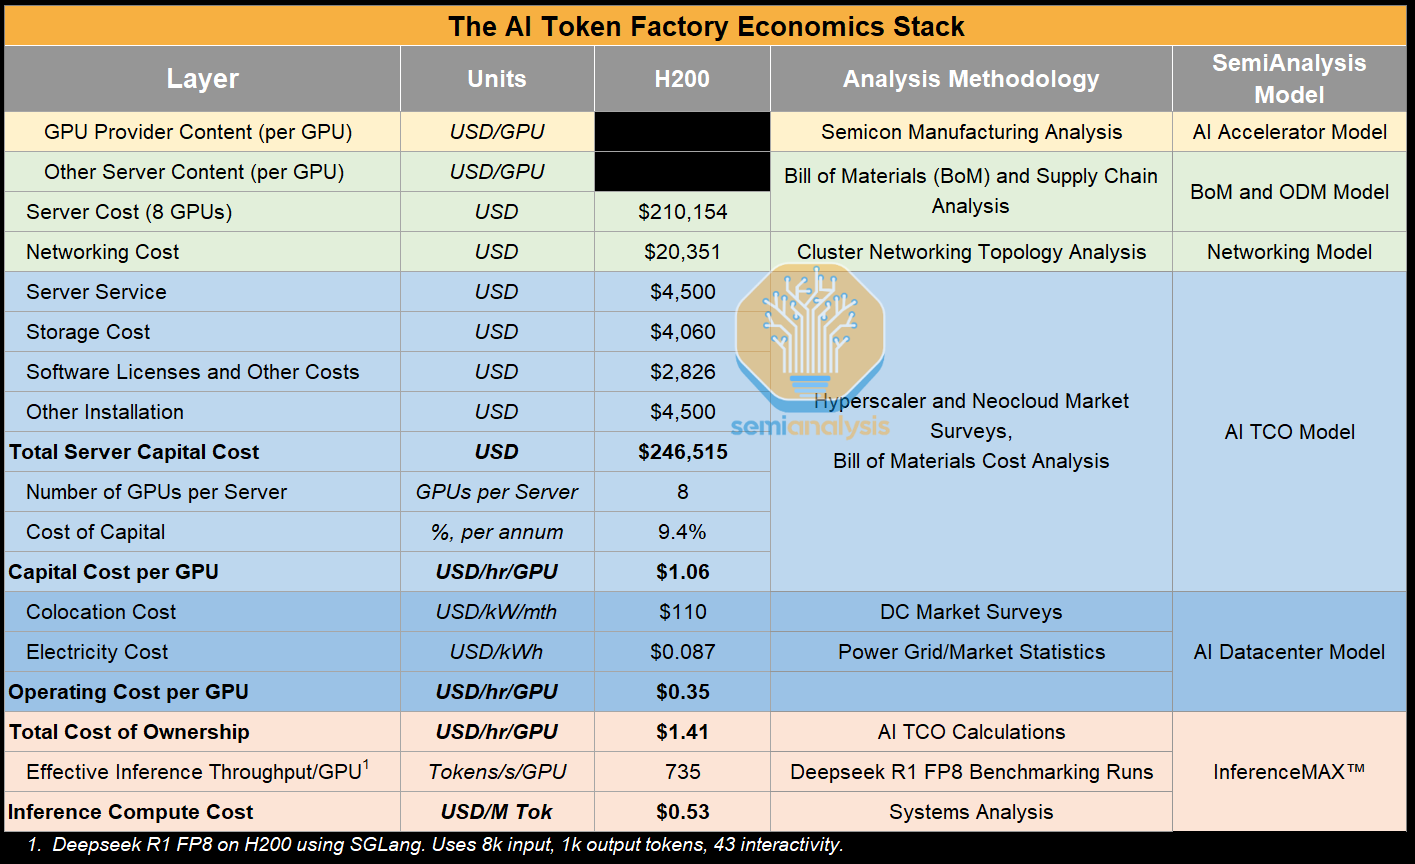
In particular, the SemiAnalysis AI TCO Model provides comprehensive modeling of total cost of ownership for combinations of various AI server solutions and networking architectures (i.e. InfiniBand vs SpectrumX vs Arista Ethernet vs WhiteBox Ethernet) and is the main source for the total cost of ownership per GPU as well as Neocloud rental market prices used in InferenceMAX™.
The SemiAnalysis GPU Cloud Market Rental Price Report is built on surveys with over 70+ GPU Clouds and over 100+ end users that rent from GPU clouds. In the future, we will explore implementing dashboards on the InferenceMAX.ai portal for different rental pricing contracts lengths like 1 year or 1 month. We also plan on allowing custom inputs such that you can input your own $/GPU/hr quotes to determine the GPU that best matches your interactivity targets and costs.
In our analysis below, we focus on cost per million tokens for Hyperscaler tier operators that are owning chips and underwrite their business case to a 4-year economic lifespan.
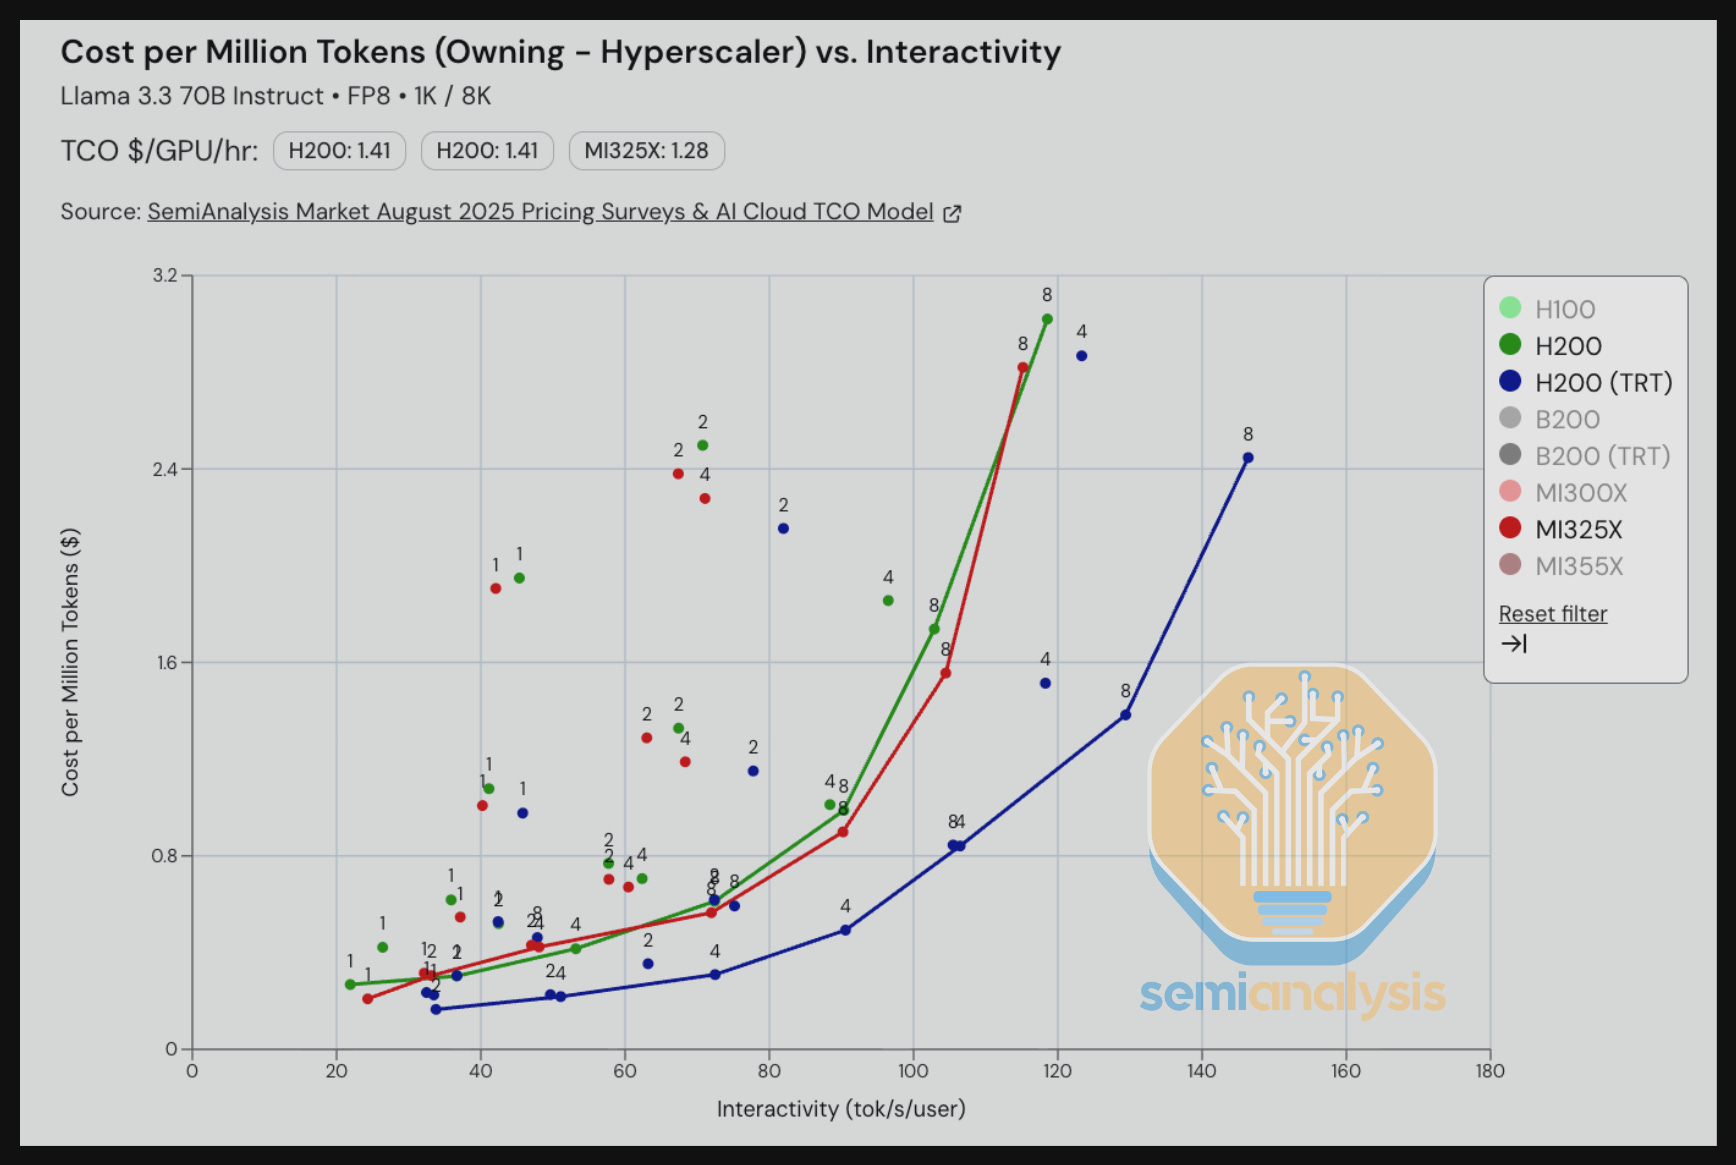
We see that across all interactivity levels, the cost per million tokens on MI325X on vLLM beats the cost per million tokens on the H200 using vLLM. When we bring in Nvidia’s (mostly) open source TRT-LLM, we see that the H200 current software stack wins against the MI325X using today’s vLLM stack.
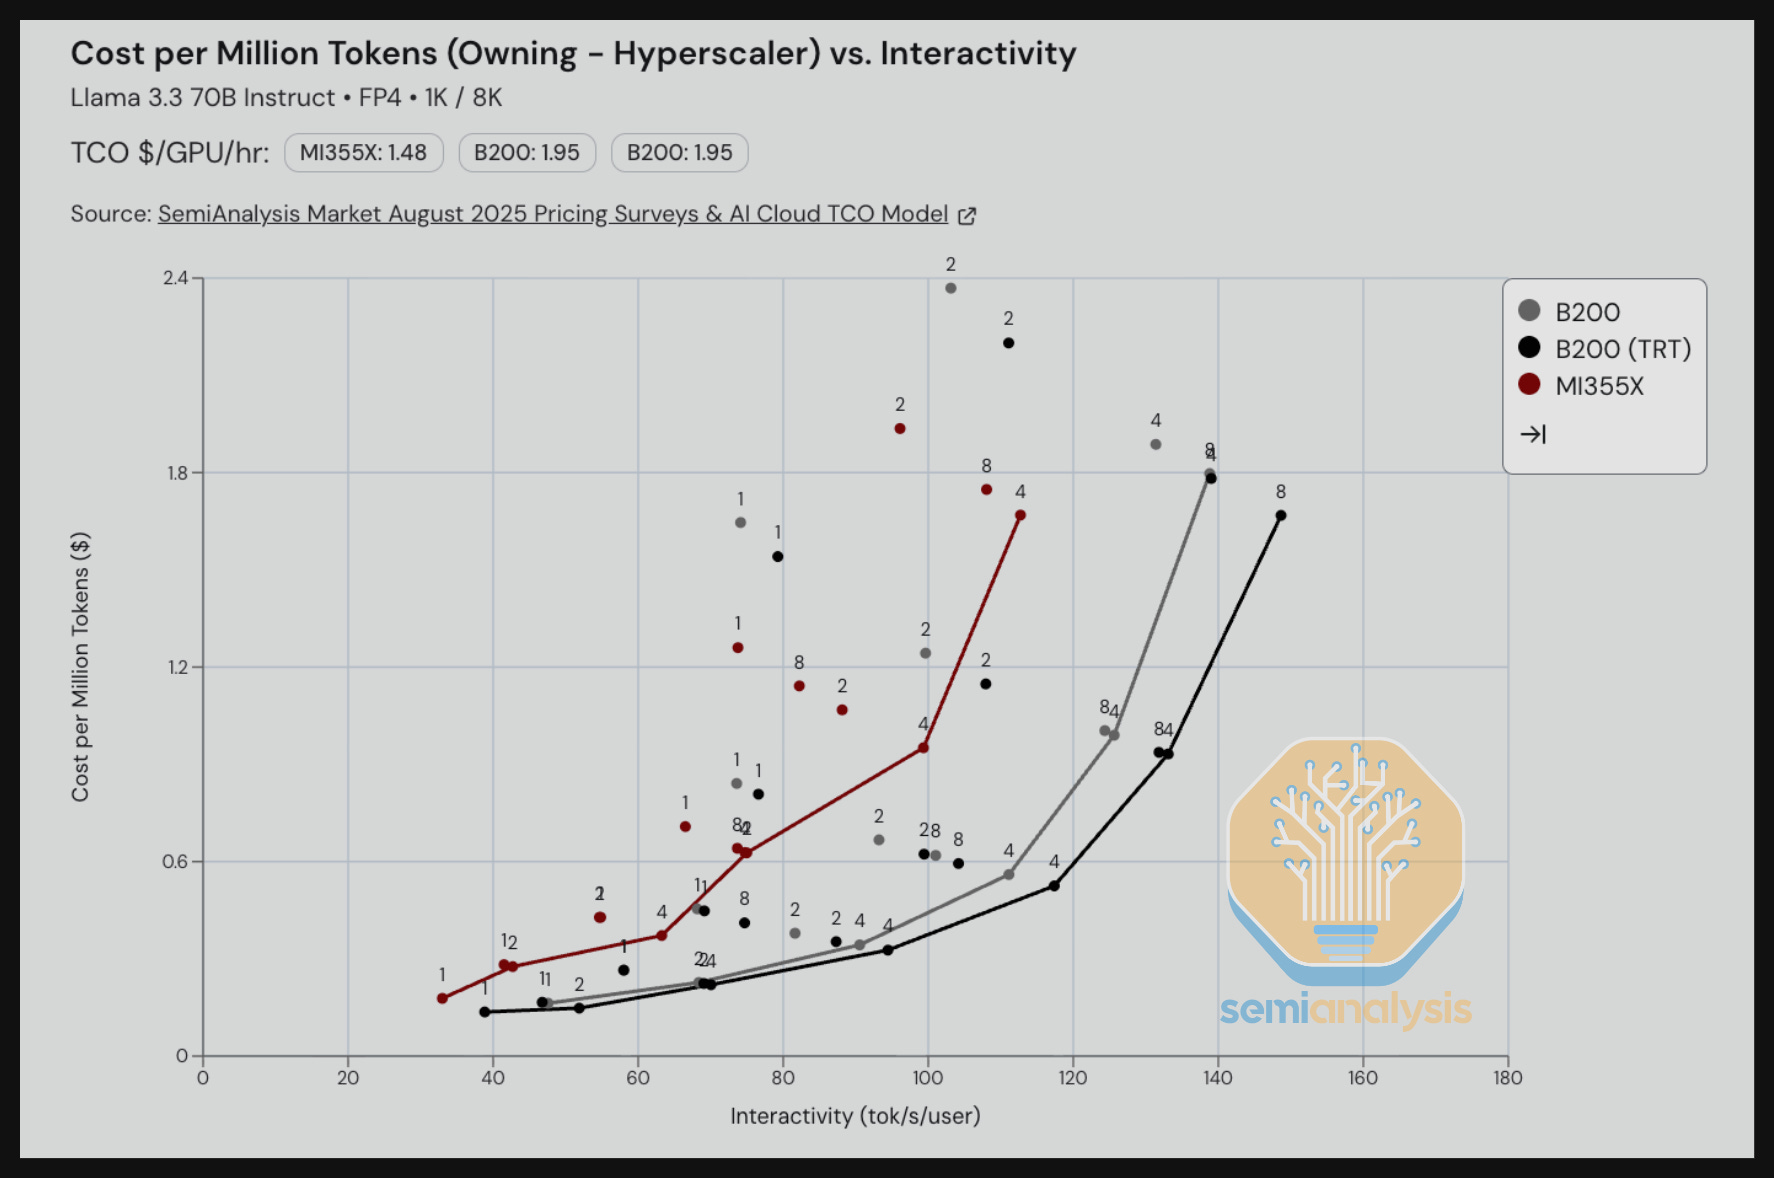
When we compare the B200 on vLLM vs the MI355 on ROCm 7.0 vLLM when running Llama3 70B FP4 on reasoning input/output length scenarios, the B200 currently outperforms the MI355. This also illustrates our suggestion that AMD focuses more on optimizing FP4 for Llama3.
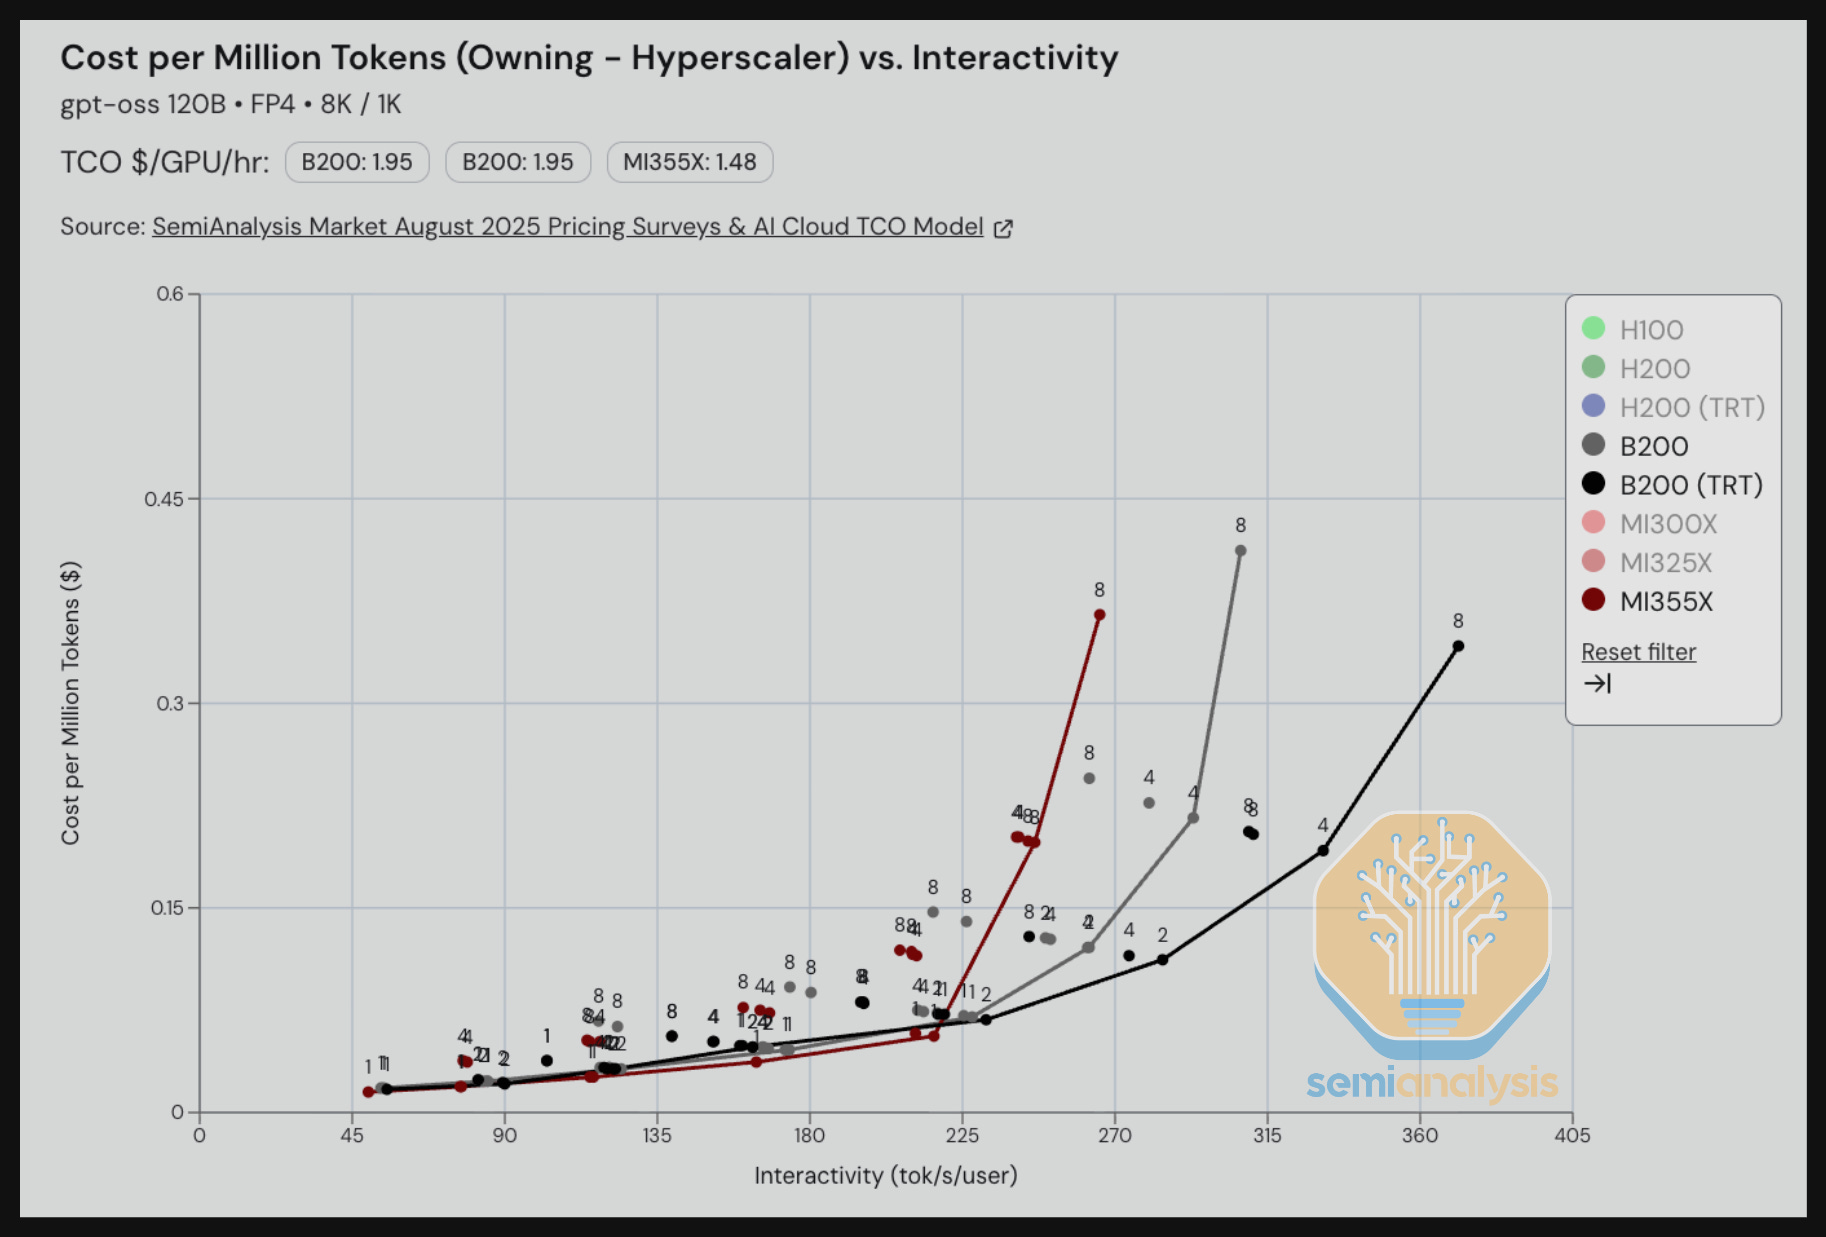
For GPT-OSS 120B FP4 summarization tasks, we see that the MI355X on vLLM has a lower TCO per million tokens than the B200 on vLLM and can even beat B200 on TRT-LLM when interactivity is below 225 tok/s/user. For interactivity levels greater than 225 tok/s/user, we see that the B200 on TRT-LLM as well as other inference engines are more optimized and deliver lower TCO per performance than the MI355X on vLLM.
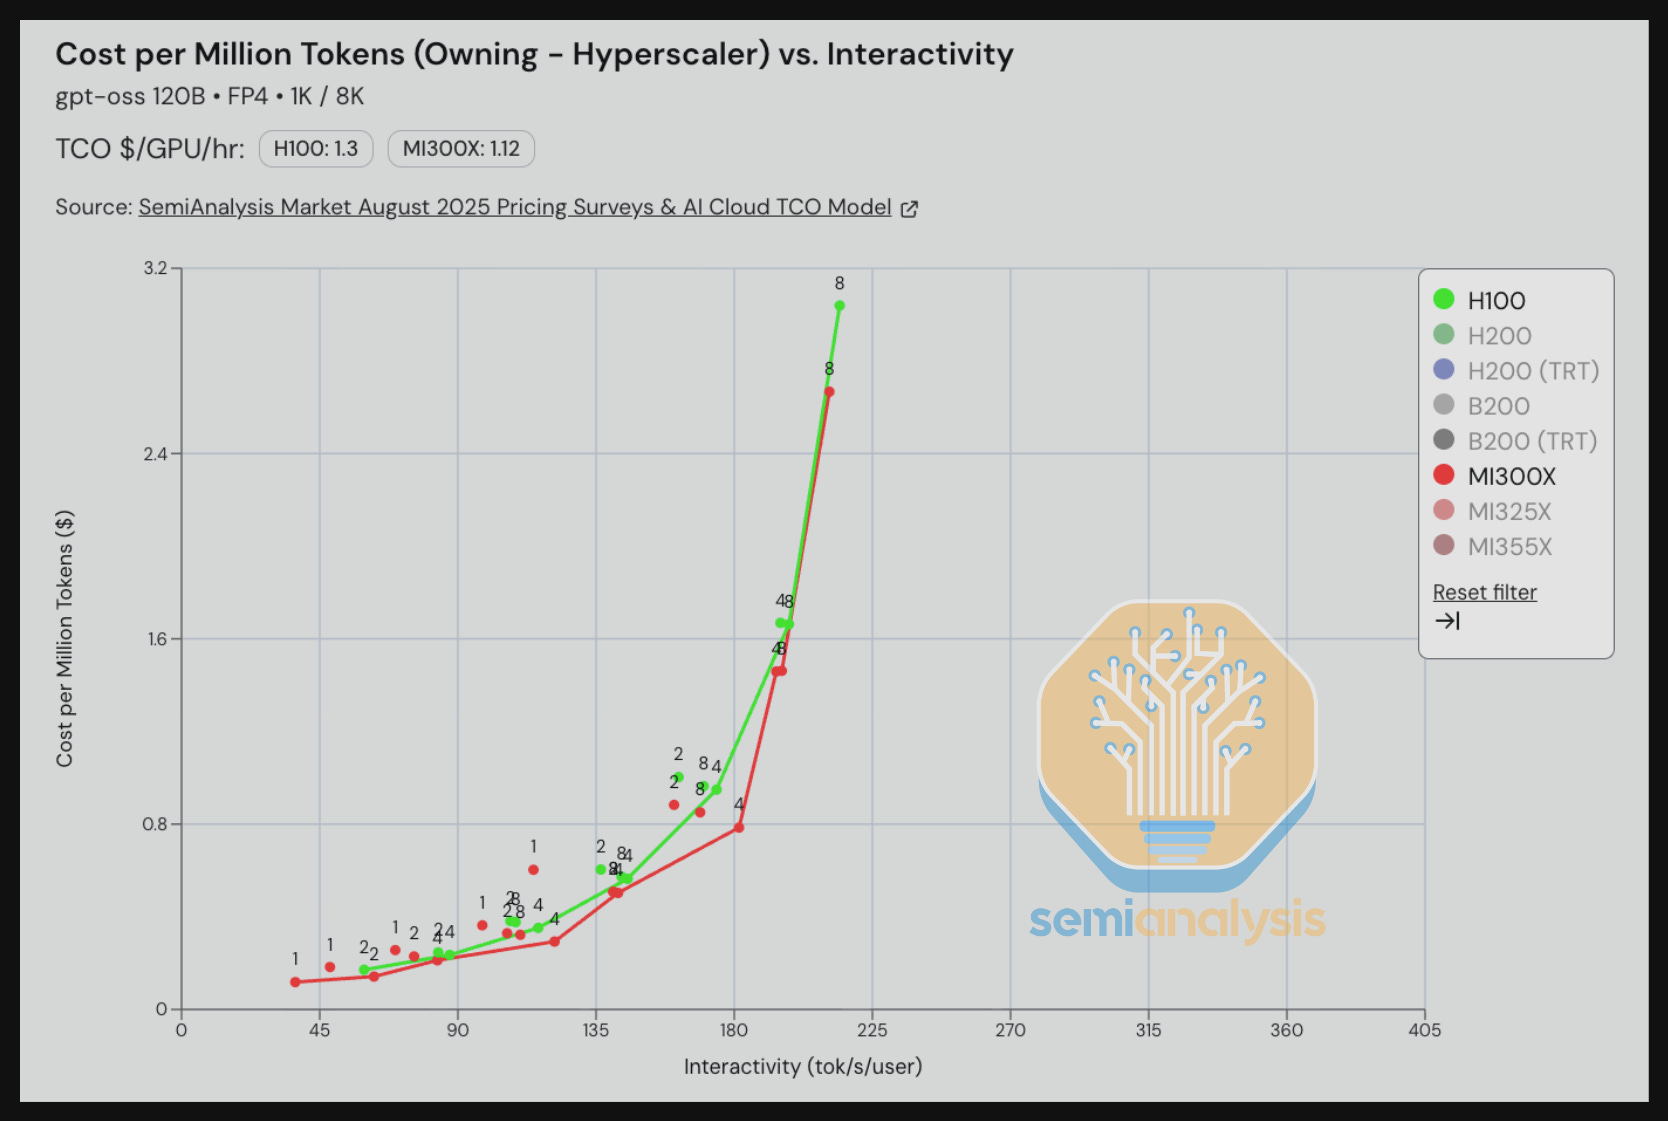
On GPT-OSS 120B with MX4 weights, we see very strong performance per TCO from the MI300X compared to the H100 across the entirely interactivity range.
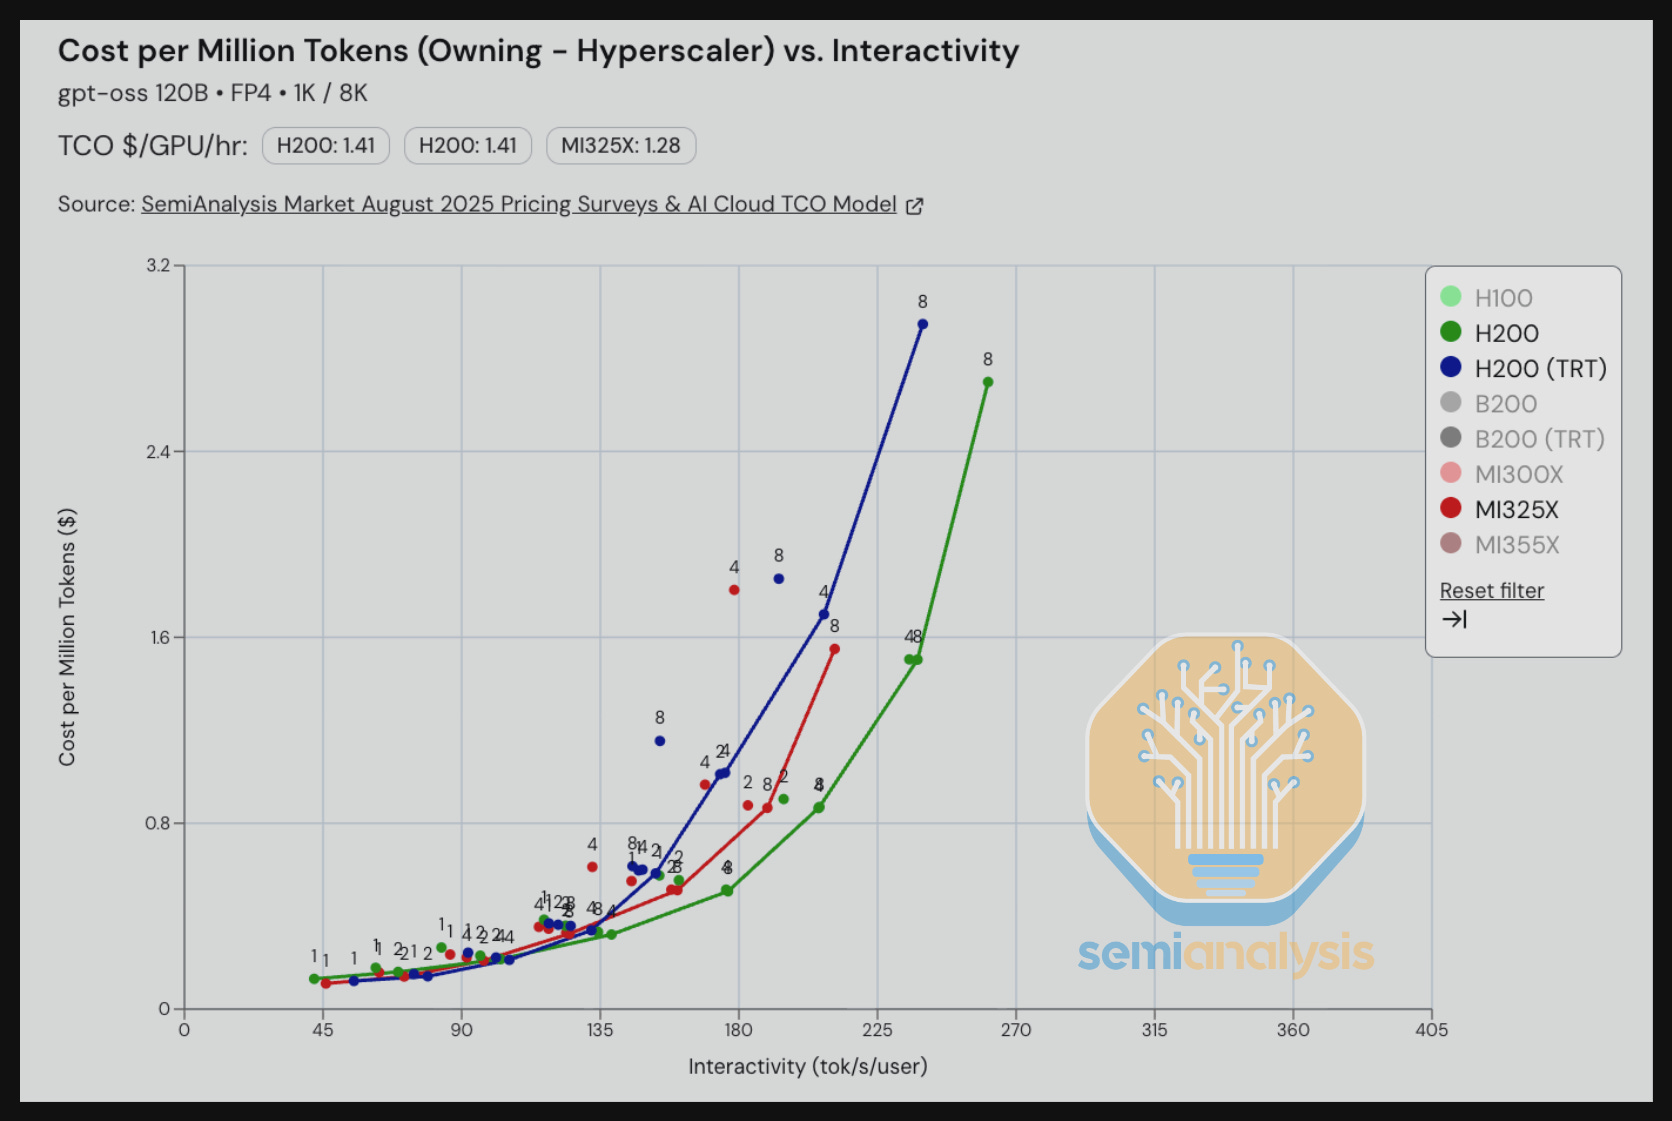
For gpt-oss 120B using MX4 weights, the H200 on TRT-LLM is neck and neck with the MI325X in terms of perf per TCO for interactivity levels less than 135 tok/s/user. Above this level, the MI325X vLLM takes the lead in terms of TCO per million tokens compared to H200 TRT-LLM.
What is surprising about this result is that true open source vLLM for Hopper is faster than “mostly” open source TRT-LLM hopper. Even the MI325X on vLLM beats the H200 on TRT-LLM for interactivity levels greater than 135 tok/s/user.
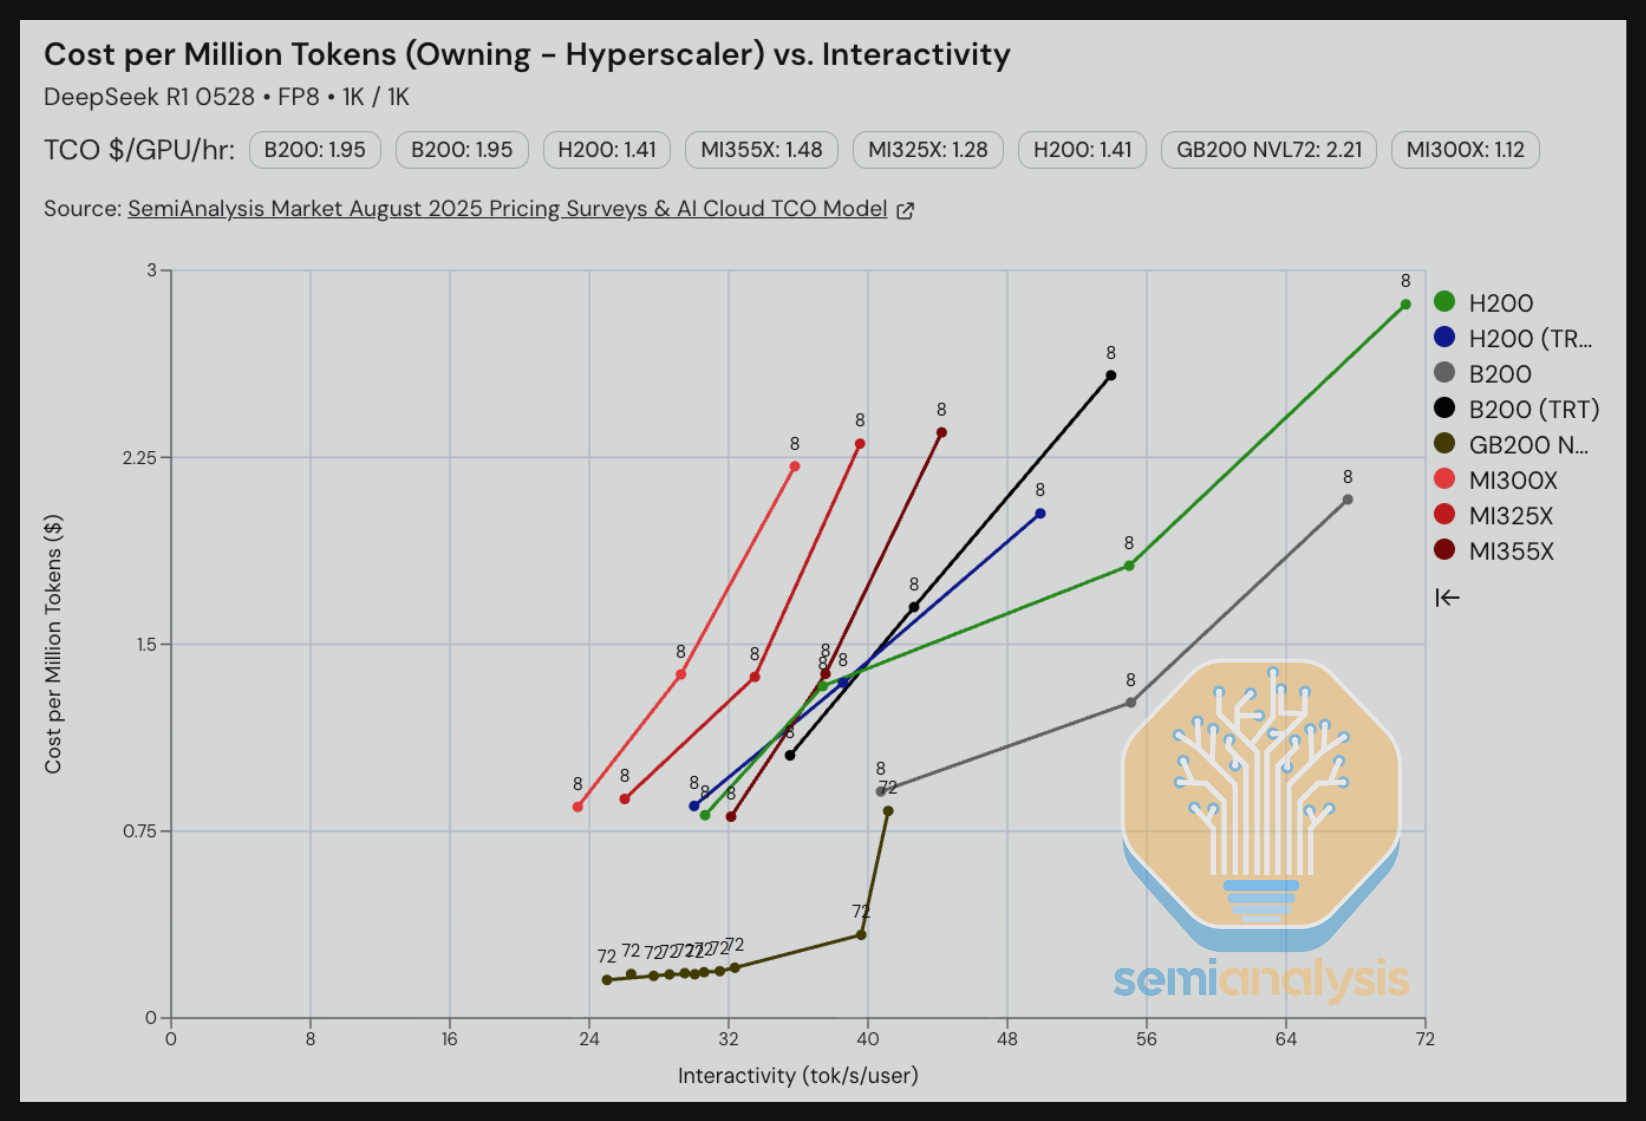
Moving on to DeepSeek 670B MoE using FP8, we see that when we hold TCO per million tokens constant, the B200 on SGLang delivers 1.5x faster interactivity as compared to the MI355X on SGLang. We note that there is still lots of optimizations currently in ROCm AITER that ROCm is integrating into SGLang, and so we expect that SGLang DeepSeek 670B MoE performance per TCO will improve soon.
When holding interactivity constant at ~35 tok/s/user, the GB200 NVL72 beats everything else, delivering 4x better TCO per million tokens. We note that the Dynamo team has so far only had time to implement optimizations sufficient to lower the parallelism cost pareto frontier at the 30 tok/s/user region. There is still room for them to further optimize to push down the cost pareto frontier for interactivity levels of around 40 and above for the GB200 NVL72 using FP8.
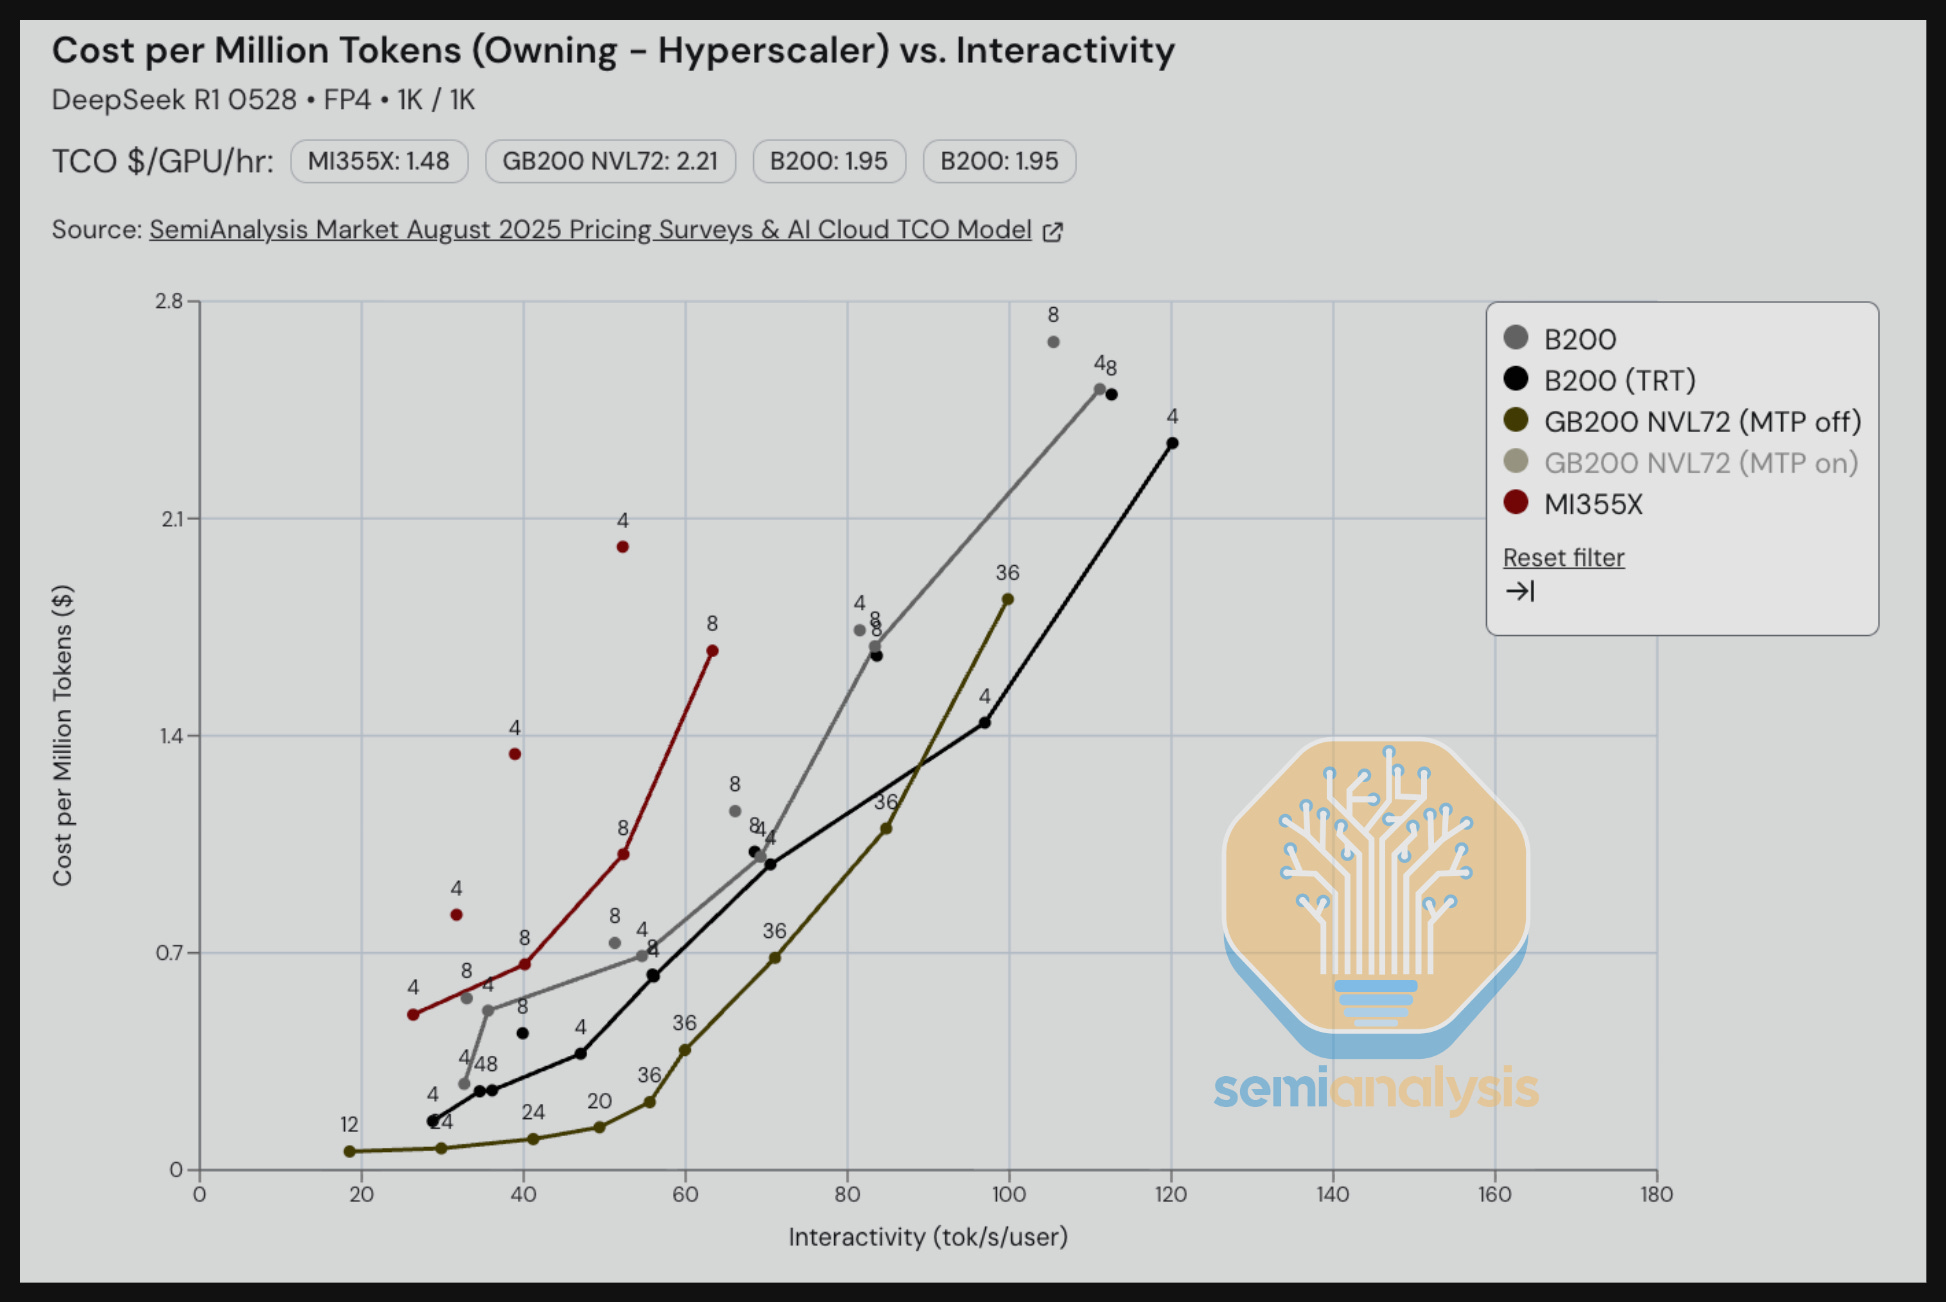
Moving on to DeepSeek R1 using FP4 for a summarization use case, we see that below 90 tok/s/user interactivity, the GB200 NVL72 on the TRT-LLM engine using Dynamo disagg prefill decisively outperforms all single node 8-GPU severs on TCO per million tokens. Interestingly, for interactivity levels above 90 tok/s/user, the B200 on TRT-LLM beats the GB200 NVL72. However, as it stands now, a single node B200 server can drive better TCO per performance than the GB200 NVL72 for high interactivity use cases.
In the benchmark below focused on a reasoning use case, we see that the B200 on SGLang currently outperforms the MI355X on SGlang.
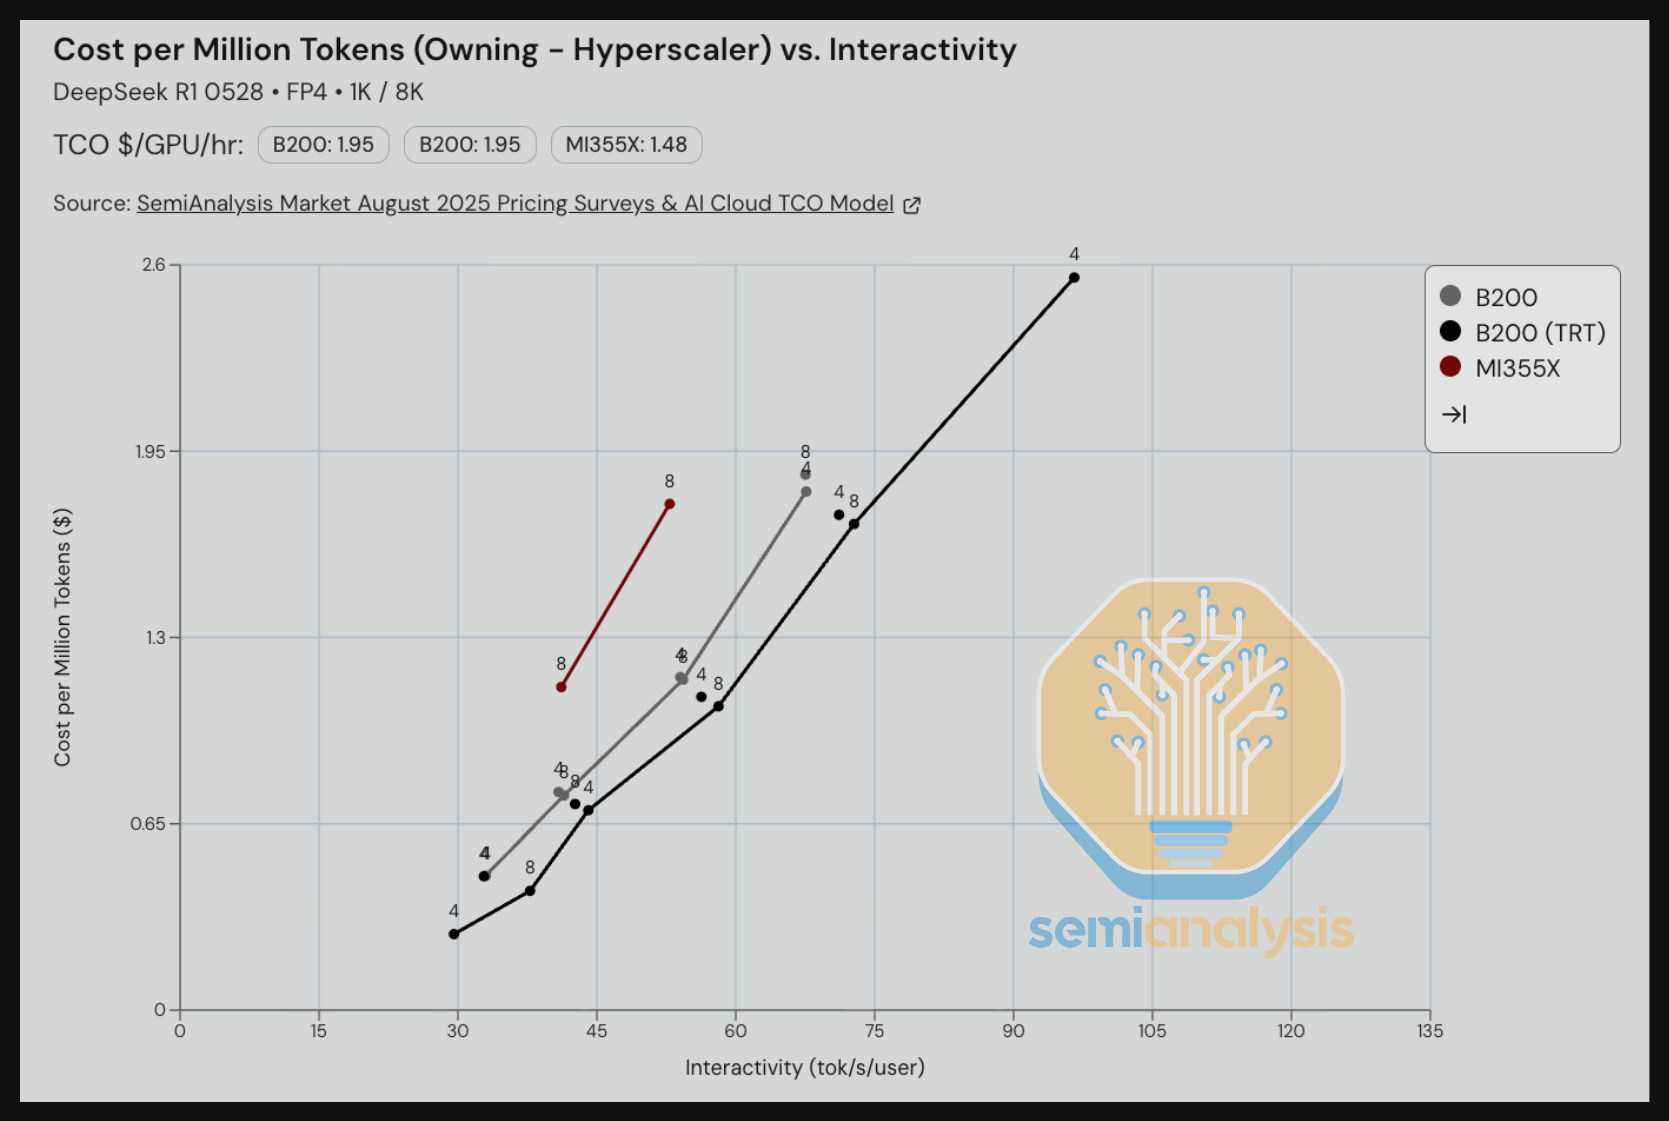
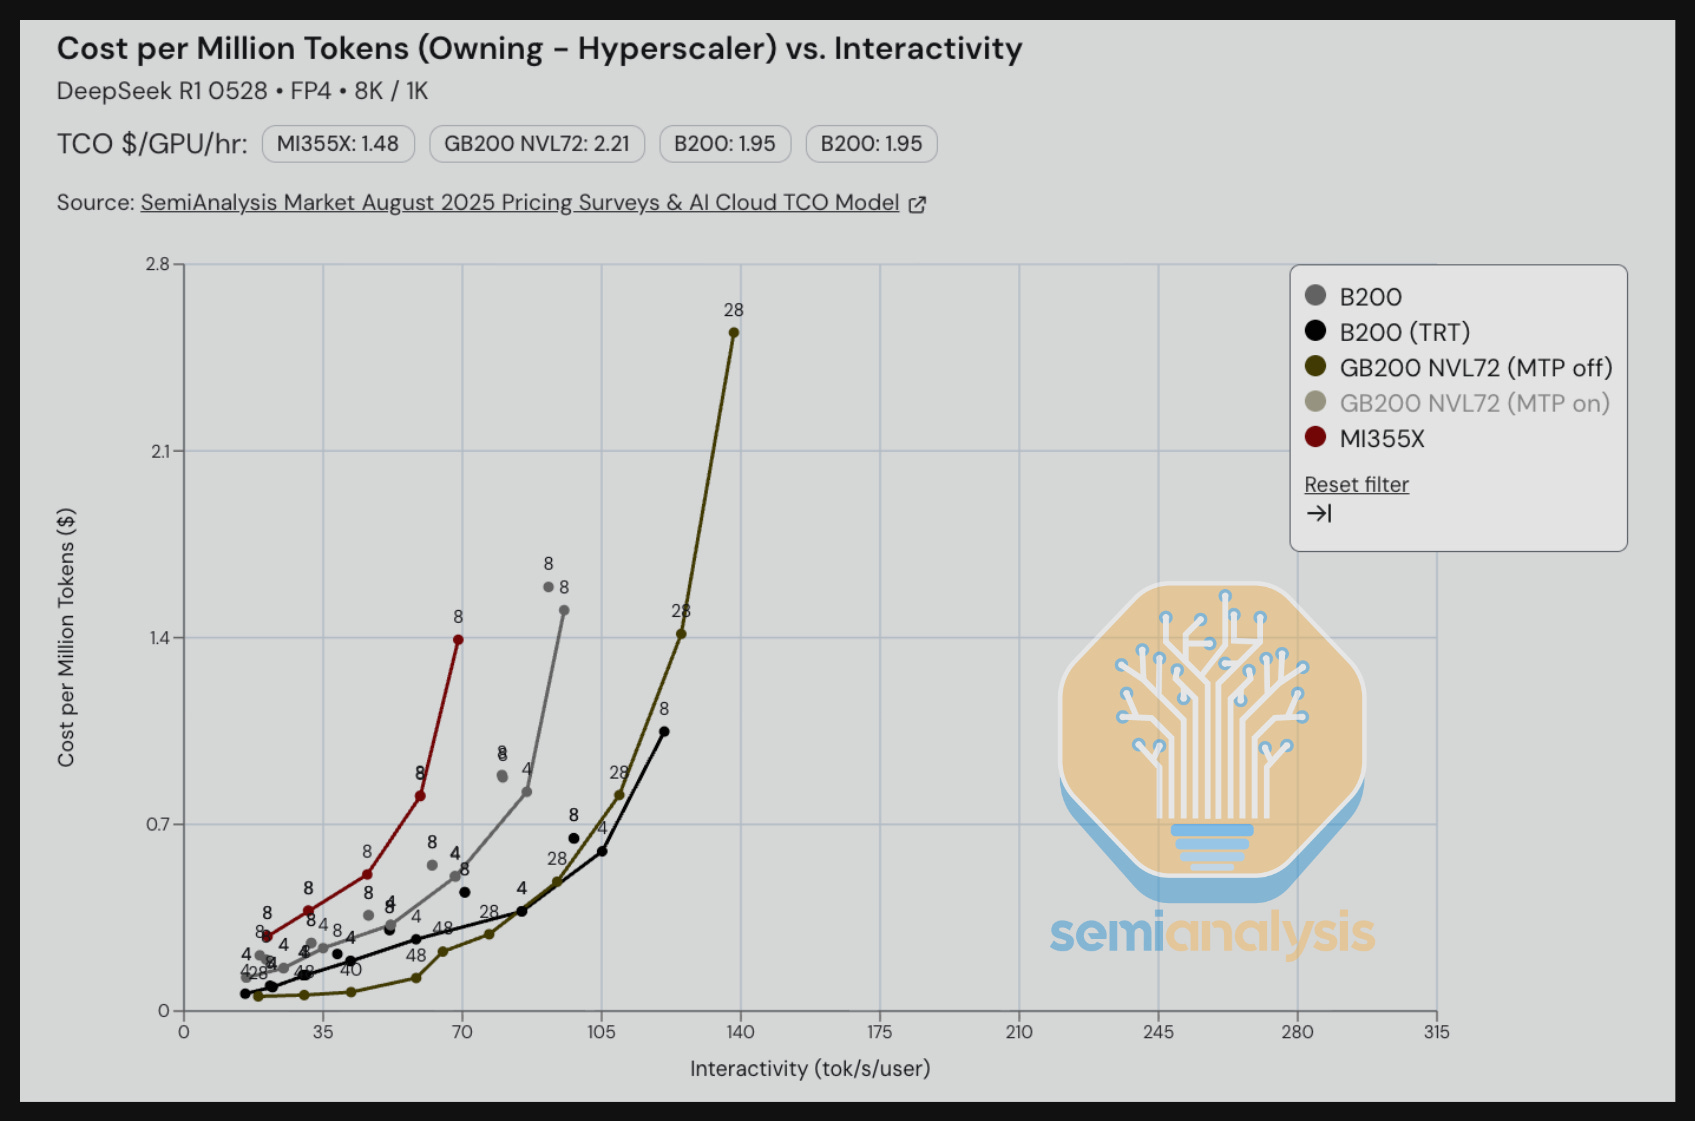
For the summarization scenario, the GB200 using today’s TRT-LLM Dynamo software outperforms a B200 single node for interactivity levels under 80 tok/s/user. Comparing the MI355X on SGLang to the B200 on SGLang, we see that the B200 delivers better TCO per million tokens.
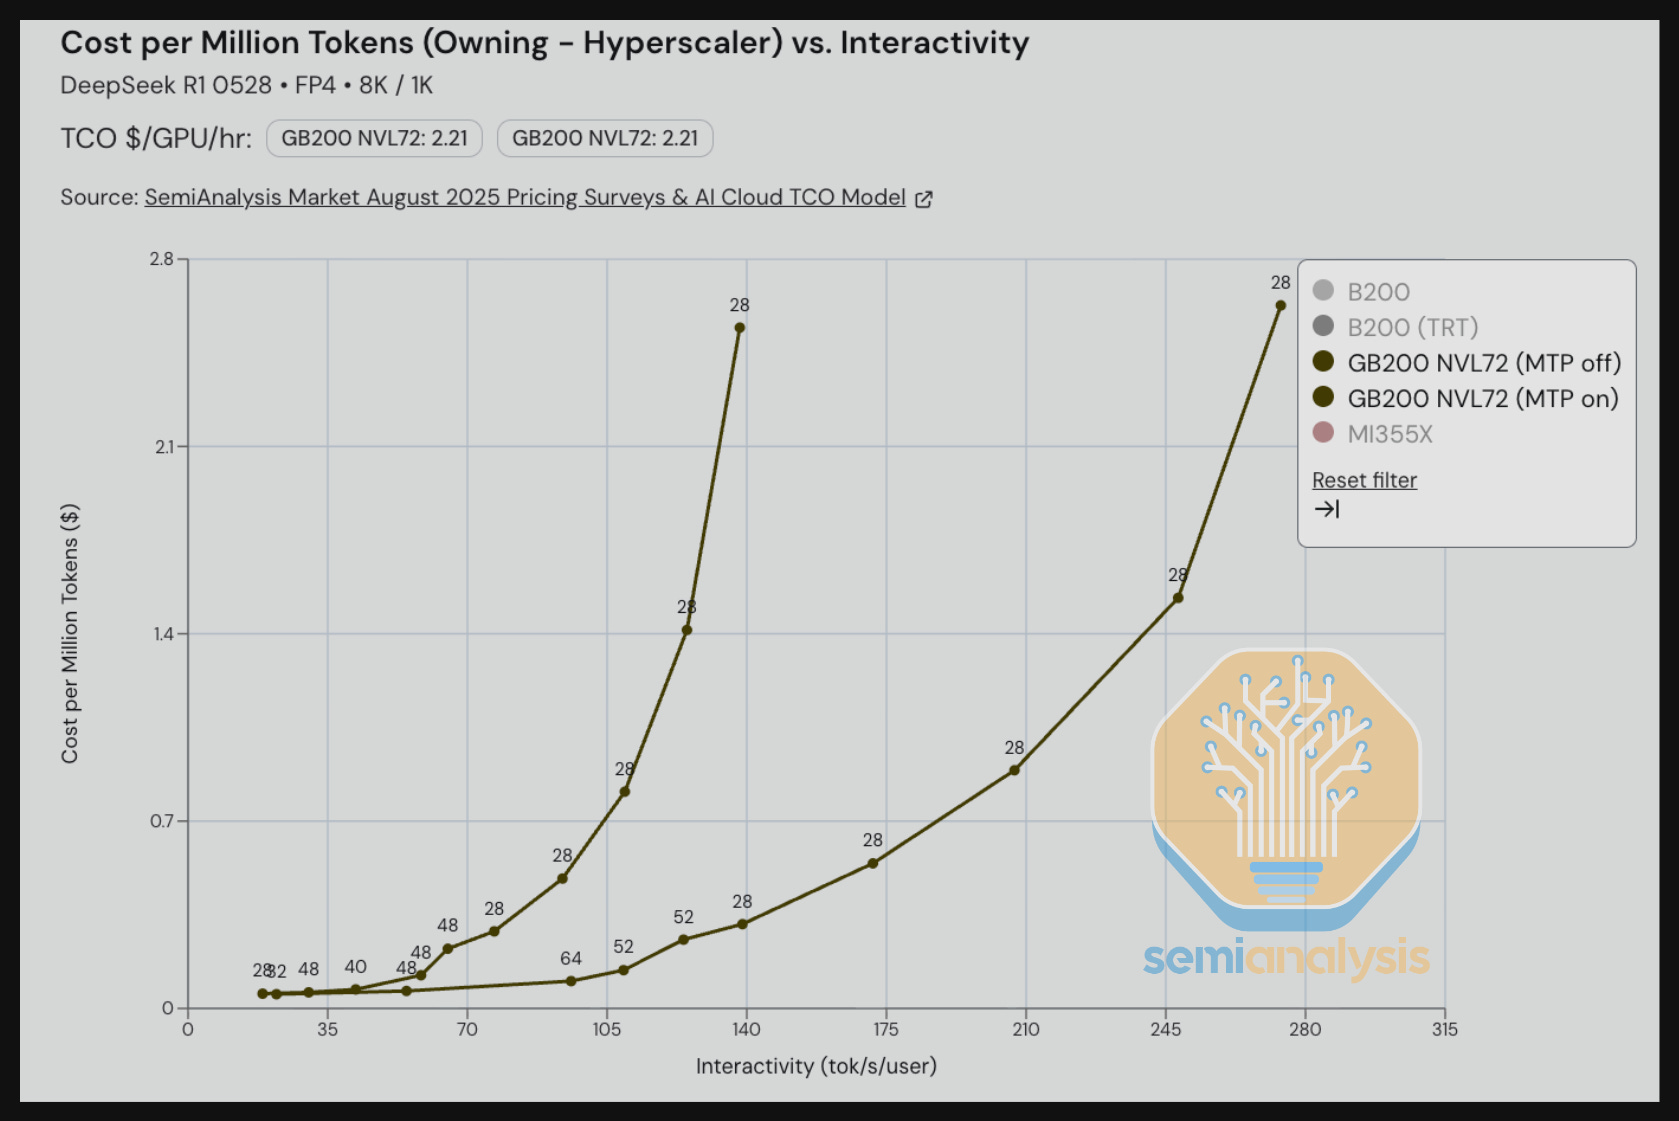
We also benchmarked workloads running on FP4 using Multi-Token Prediction (MTP), which is a feature implemented by the DeepSeek team during training. We see that when holding TCO per million tokens constant, MTP can deliver 2-3x greater interactivity (tok/s/user) than without MTP for that given cost level. Indeed, most frontier labs and tier 1 managed DeepSeek REST API endpoint providers have already enabled MTP for production workloads.
Estimated Token Throughput per All In Provisioned Utility Megawatt vs Interactivity (tok/s/user)
Power is the ultimate constraint for AI infrastructure. Every datacenter operates within a finite power envelope, usually measured in Megawatts (MW). This directly determines how much useful computation, and ultimately, how many tokens can be produced by a given datacenter.
Inference economics can also be analyzed not only through a lens of GPU performance in terms of throughput/GPU vs TCO, but also in terms of throughput per power as measured in terms of tokens/s per all-in provisioned MW of total utility power. Total utility power encompasses power requirement for GPUs, CPUs, networking equipment, other related cluster IT equipment as well as facility overhead. Facility overhead includes items such as electrical distribution losses and power expended on cooling equipment such as chillers, CDUs and cooling towers, among others. The greater the number of tokens processed per MW, the greater the potential revenue and profit per unit of energy. Please note that for InferenceMAX™, we use all-in provisioned utility MW, which accounts for the aforementioned facility overhead, as opposed to tokens per all-in Critical IT MW, which does not account for facility overhead. These differ across sites, but we chose a representative for teh industry based on our AI TCO model and Datacenter model.
Do note that colocation rent and electricity cost typically make up less than 20% of the total cost of ownership. This means that if a given GPU delivers 20% lower tokens per MW compared to another GPU, this would only translate to a delta of less than 4% of the total cost of ownership (i.e. 20% * 20% = 4%). The lion’s share of the TCO contribution is from the gross margins each GPU hardware vendor charges. Some charge up 75% gross margins (i.e. a 4x markup over cost of goods sold), while others less than 50% gross margins (i.e. less than 2x cost of goods sold).
We use rate units – i.e. token/s per MW as opposed to an accumulated amount of energy per token such as Joules per Token. This is because datacenter capacity is commissioned in terms of Megawatts (MW), which is a rate unit and is equivalent to 1 megajoule (MJ) per second. If we integrate the rate unit over a given time period – we get the absolute quantity of energy consumed over that period.
For now, we build up our estimate for MW needed for a given cluster by adding up Thermal Design Power (TDP) of each component in the datacenter. TDP is not the same as expected average power. Using an example to explain, for memory bandwidth bounded decode workloads, power consumption of the system should never reach TDP and will instead hover at a lower power level – the expected average power. In the future, we will benchmark the actual power consumption of each system (and networking equipment) through ipmitool. Only then will we pivot to an accumulated quantity of energy per token.
We estimate throughput per provisioned power based on the raw InferenceMAX™ results combined with data on total utility power for AI clusters from our AI Datacenter Industry Model. This model quantifies total utility power through power-normalized estimates across vendors, architectures, and inference stacks. Full estimates and ongoing nightly benchmarks are available at InferenceMAX.ai.
Performance per MW Results
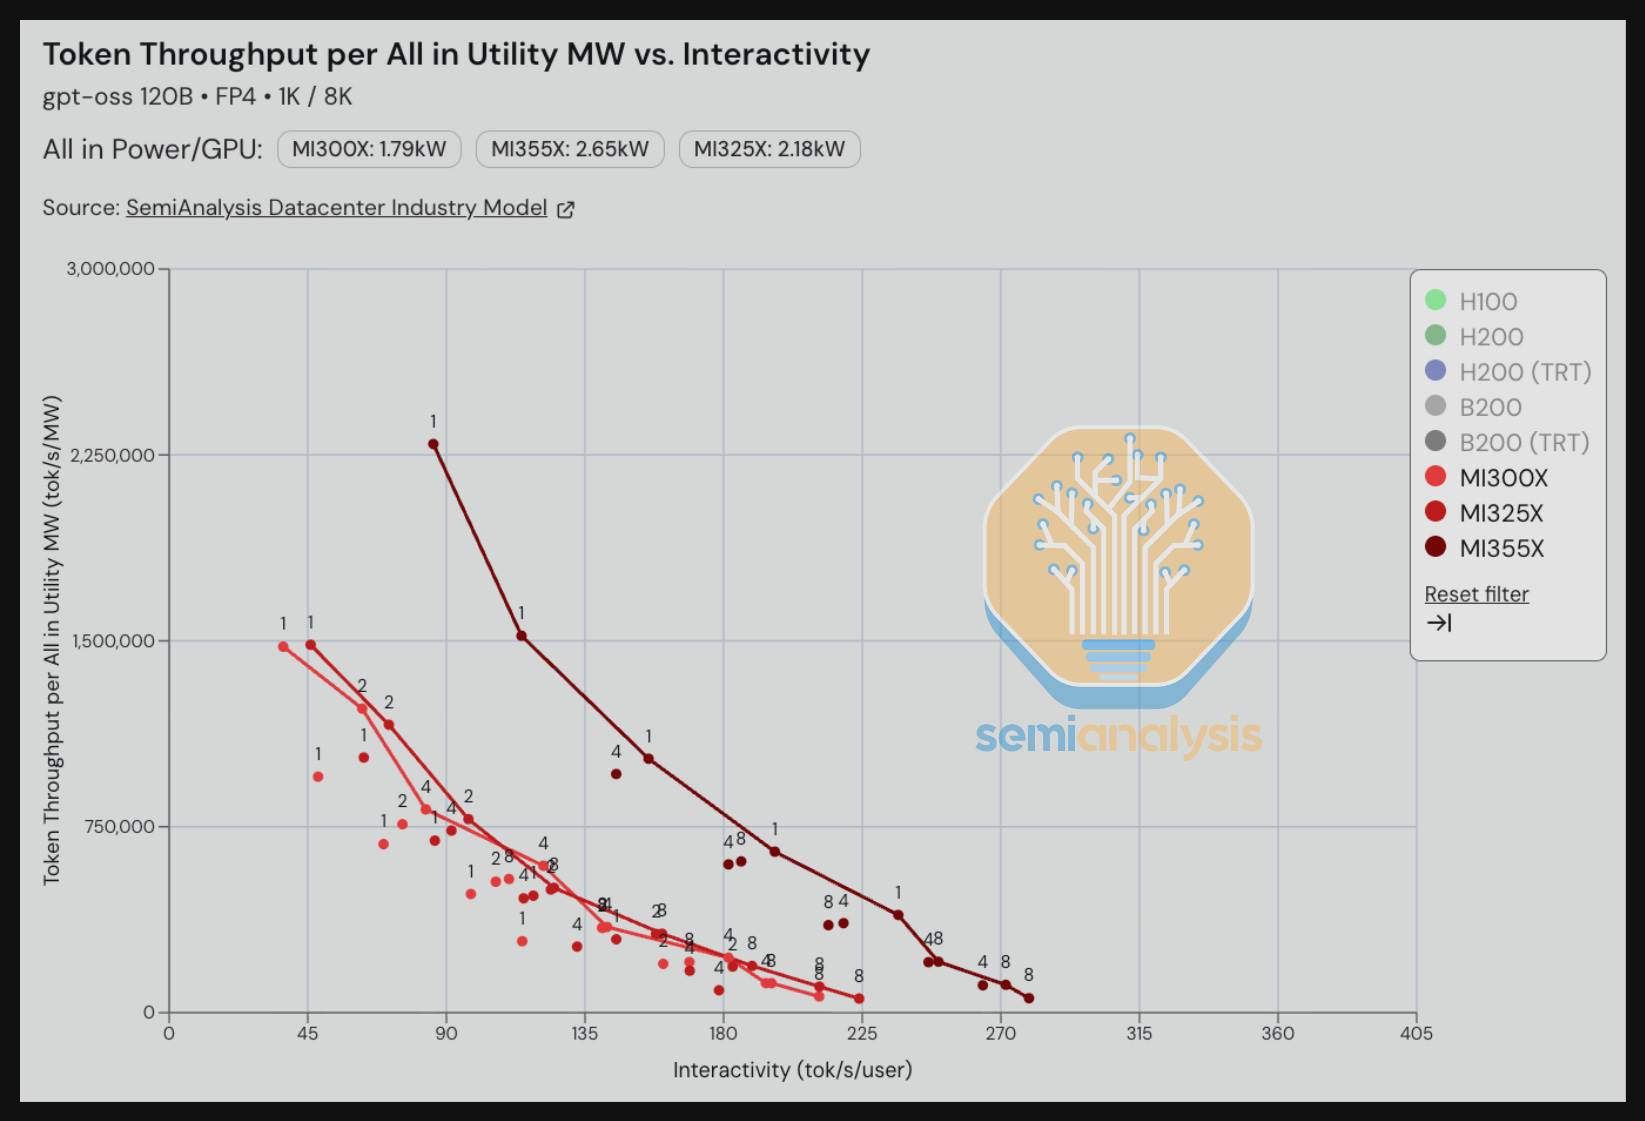
We see that for gpt-oss 120B, using MX4 weights for reasoning scenarios (1K input tokens / 8K output tokens) at the 90 tok/s/user interactivity level, the MI300X is able to process 750,000 token/s per all in provisioned MW (again this is measured per utility MW, and not per MW of Critical IT Power) while the MI355X is able to process 2,550,000 token/s per all in provisioned MW. This represents a ~3x improvement in power efficiency from the CDNA3 generation to the CDNA4 generation.
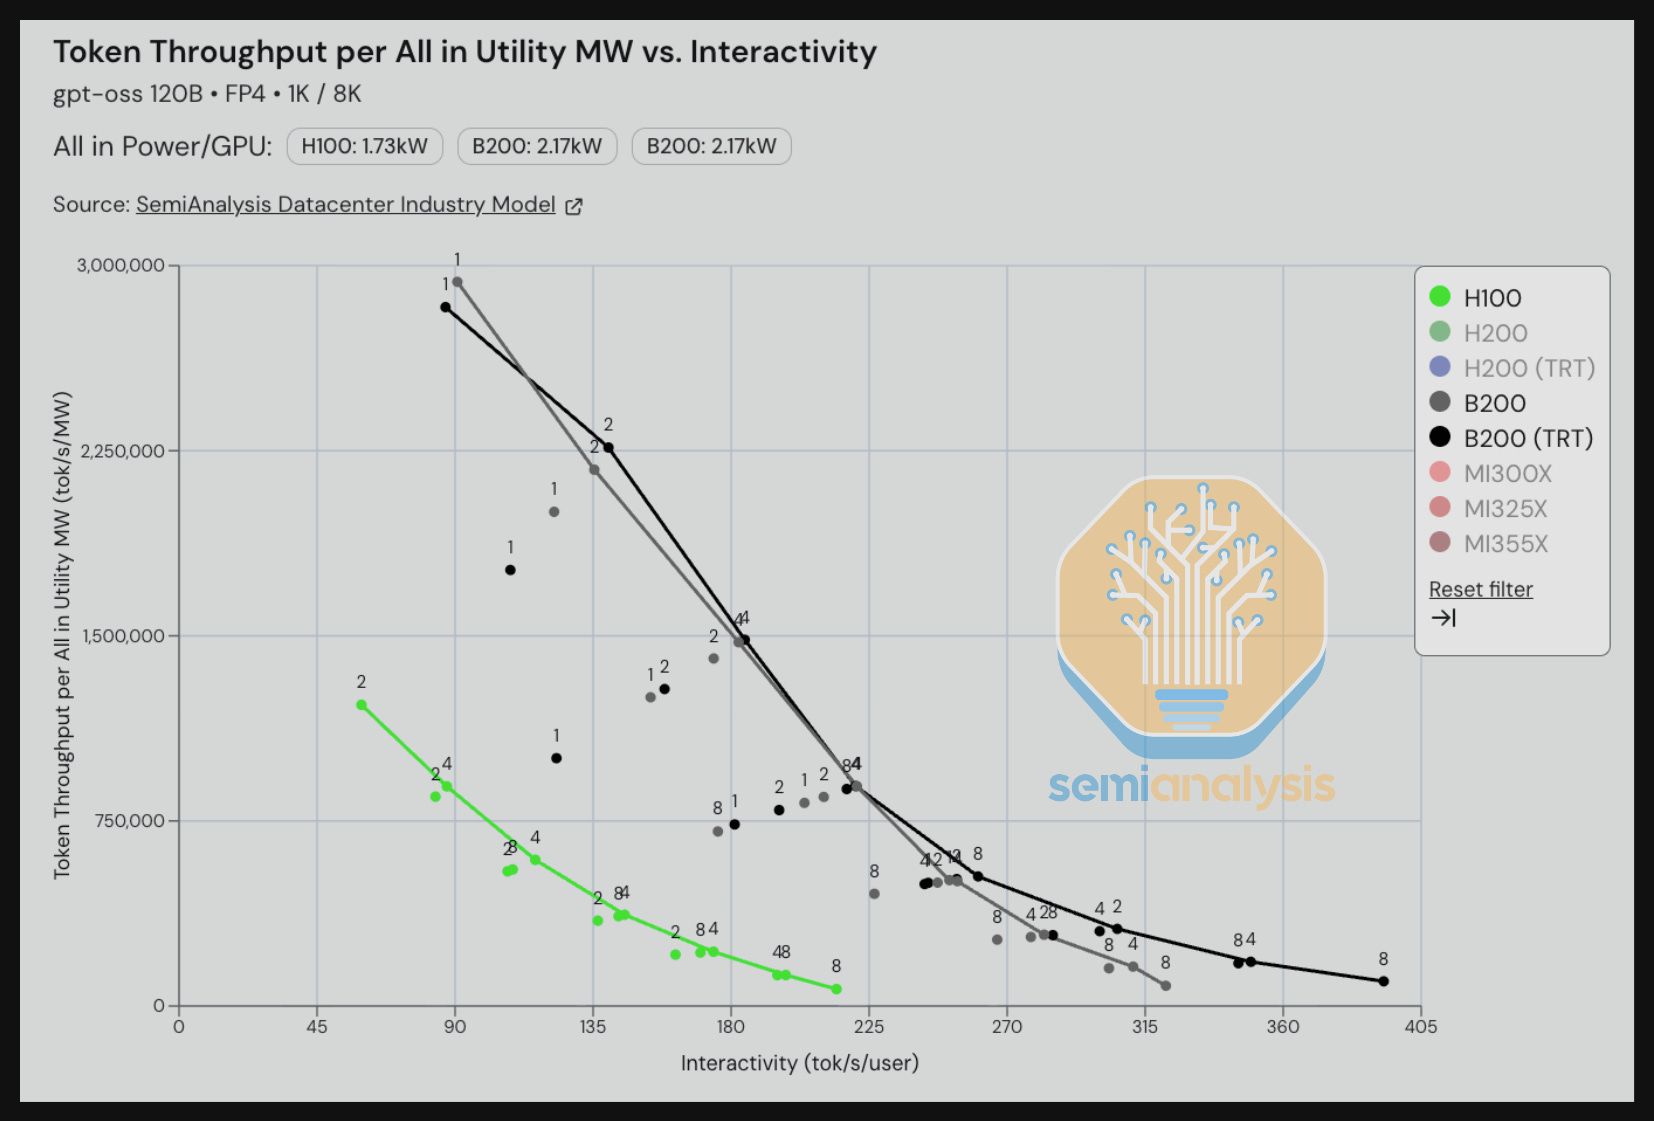
We see a similar trend when comparing across generations for the Nvidia camp. Looking at the HGX H100 vs the HGX B200 for gpt-oss 120B using FP4 weights, an H100 can process 900,000 token/s per MW while a B200 can process 2.8M token/s per MW ~3x better power efficiency on a B200 vs an H100. When we look at even higher interactivity levels of around 180 tok/s/user, the B200 delivers an eye-popping 7x power efficiency gain.
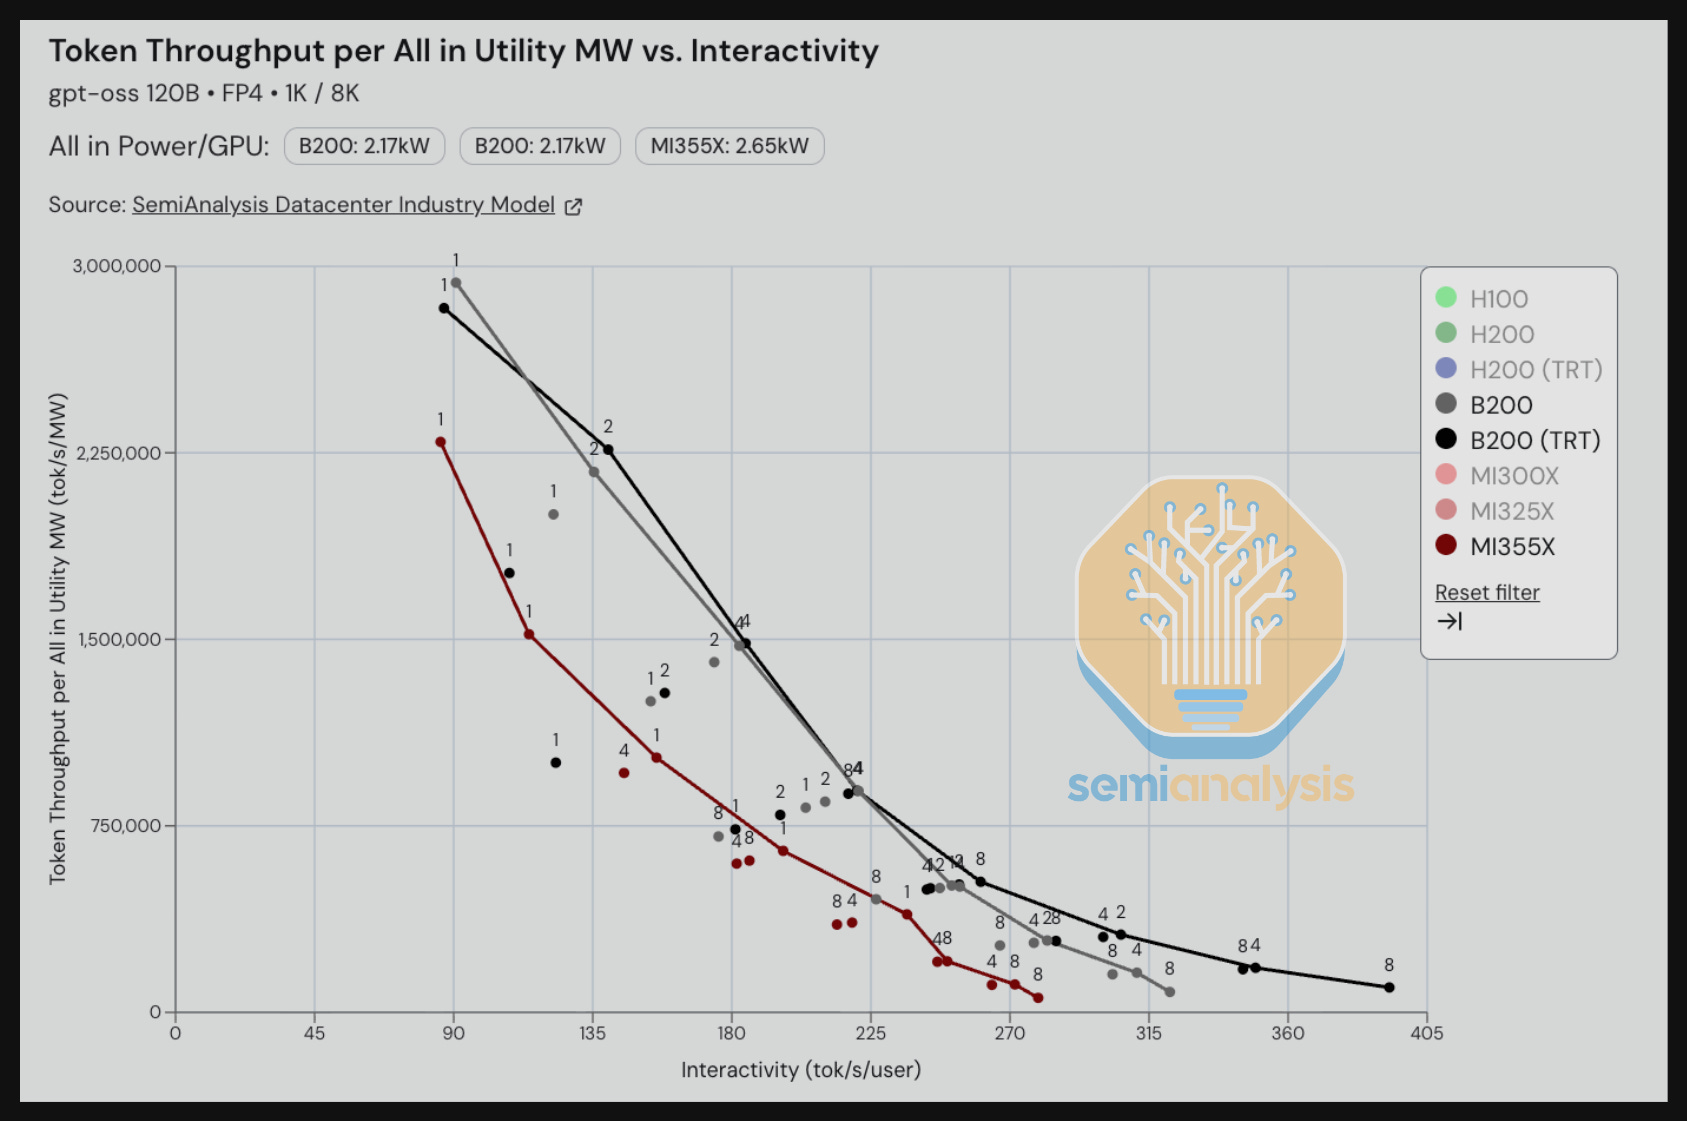
Let’s compare power efficiency for GPUs of the same generation across AMD and Nvidia. We will first look at tokens/s per provisioned all in utility MW for GPTOSS 120B. Based on our initial InferenceMAX™ result snapshot below, we see that Blackwell is 20% more energy efficient compared to the CDNA4 architecture when measured by this throughput per power metric. A large factor in this divergence is the fact that the MI355X has a much higher TDP for the GPU alone at 1.4kW/GPU vs 1kW/GPU for the B200.
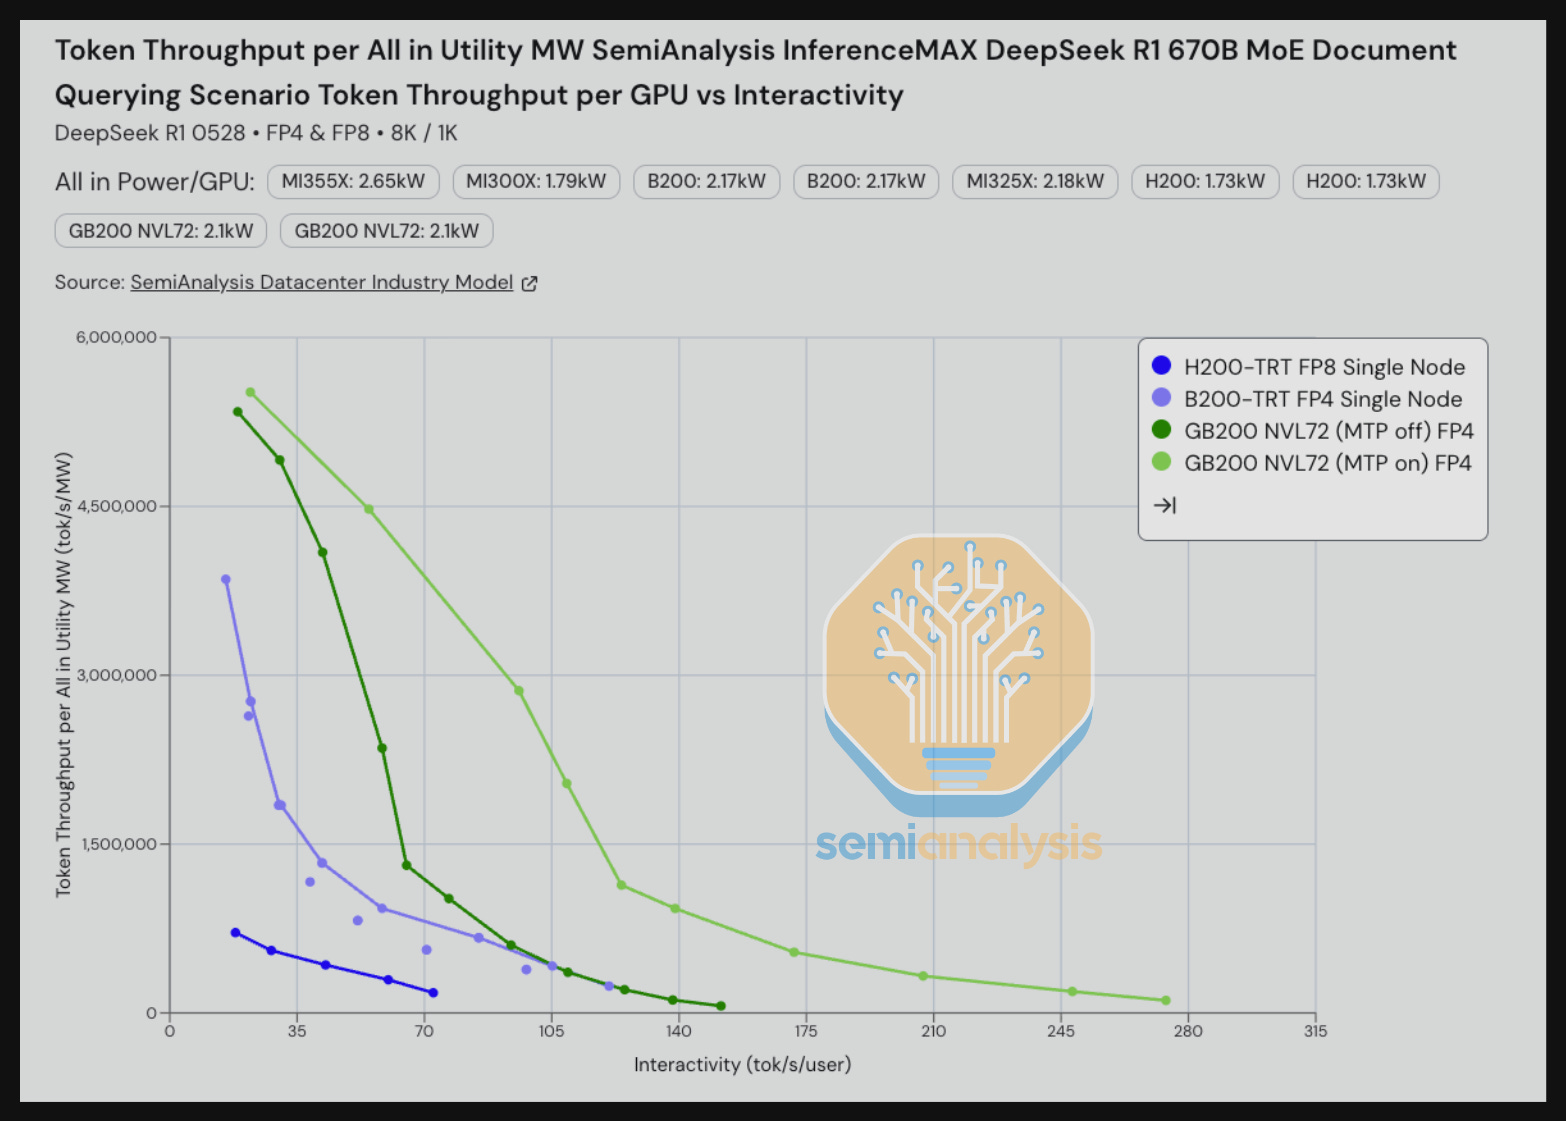
In our next benchmark, we look at tokens per power at an interactivity level of 30 tok/s/user for DeepSeek R1. When comparing a single node H200 FP8 vs a GB200 NVL72 FP4 (without Multi Token Prediction), the GB200 NVL72 delivers an ~8x improvement in token/s processed per all-in provisioned MW. Note that both the H200 and B200 results are for single nodes. We will explore the potential for greater token throughput per MW for the B200 and H200 that can be unlocked by implementing disaggregated prefill and wide expert parallelism over SpectrumX as well as InfiniBand. SGLang’s GB200 NVL72 analysis shows that 8-GPU systems can indeed achieve strong performance gains through implementing wide expert parallelism. However, the SGLang blog also shows that GB200 NVL72 still beats Hopper even when both implement disaggregated prefill and wide EP.
Staying on DeepSeek, but turning to FP8, we see that the GB200 also dominates all the single-node systems on tok/s/gpu vs tok/s/user. We note that there are some nuances here – the B200 and the MI355X are both running single node SGLang even though for DeepSeek, vLLM could deliver better results than SGLang on MI355X. We will explore adding DeepSeek on vLLM for the MI355X and/or adding SGLang multi-node wideEP to all of the 8-GPU servers as well. Furthermore, as we called out earlier, note that the Dynamo team has only had time to implement optimizations sufficient to achieve a shift lower in the parallelism pareto frontier up to around 30 tok/s/user. Further optimization can be done to push the pareto frontier lower, and thus lift the throughput per power up on GB200 NVL72 FP8 for higher interactivity levels.
AMD Bugs and NVIDIA Blackwell Bugs
There were a few Blackwell bugs that were quite interesting to troubleshoot. The first bug was that the Blackwell vLLM image we started using back in July 2025 would lead to the instance stalling for up to 30 minutes on our bare metal B200 machines. This was especially challenging to replicate and debug as other people tried using the exact same image on their Blackwell cluster without encountering any hanging issues.
The first tool we turned to in order to debug this hanging issue was py-spy, a python profiler, to collect a trace. We noticed is that it was stuck on ncclCommInitRank which is strange - as many ML performance engineers know, this function should be run very quickly on a single node. Another to note was that vLLM was using their own custom FFI bindings to NCCL due to various technical reasons.
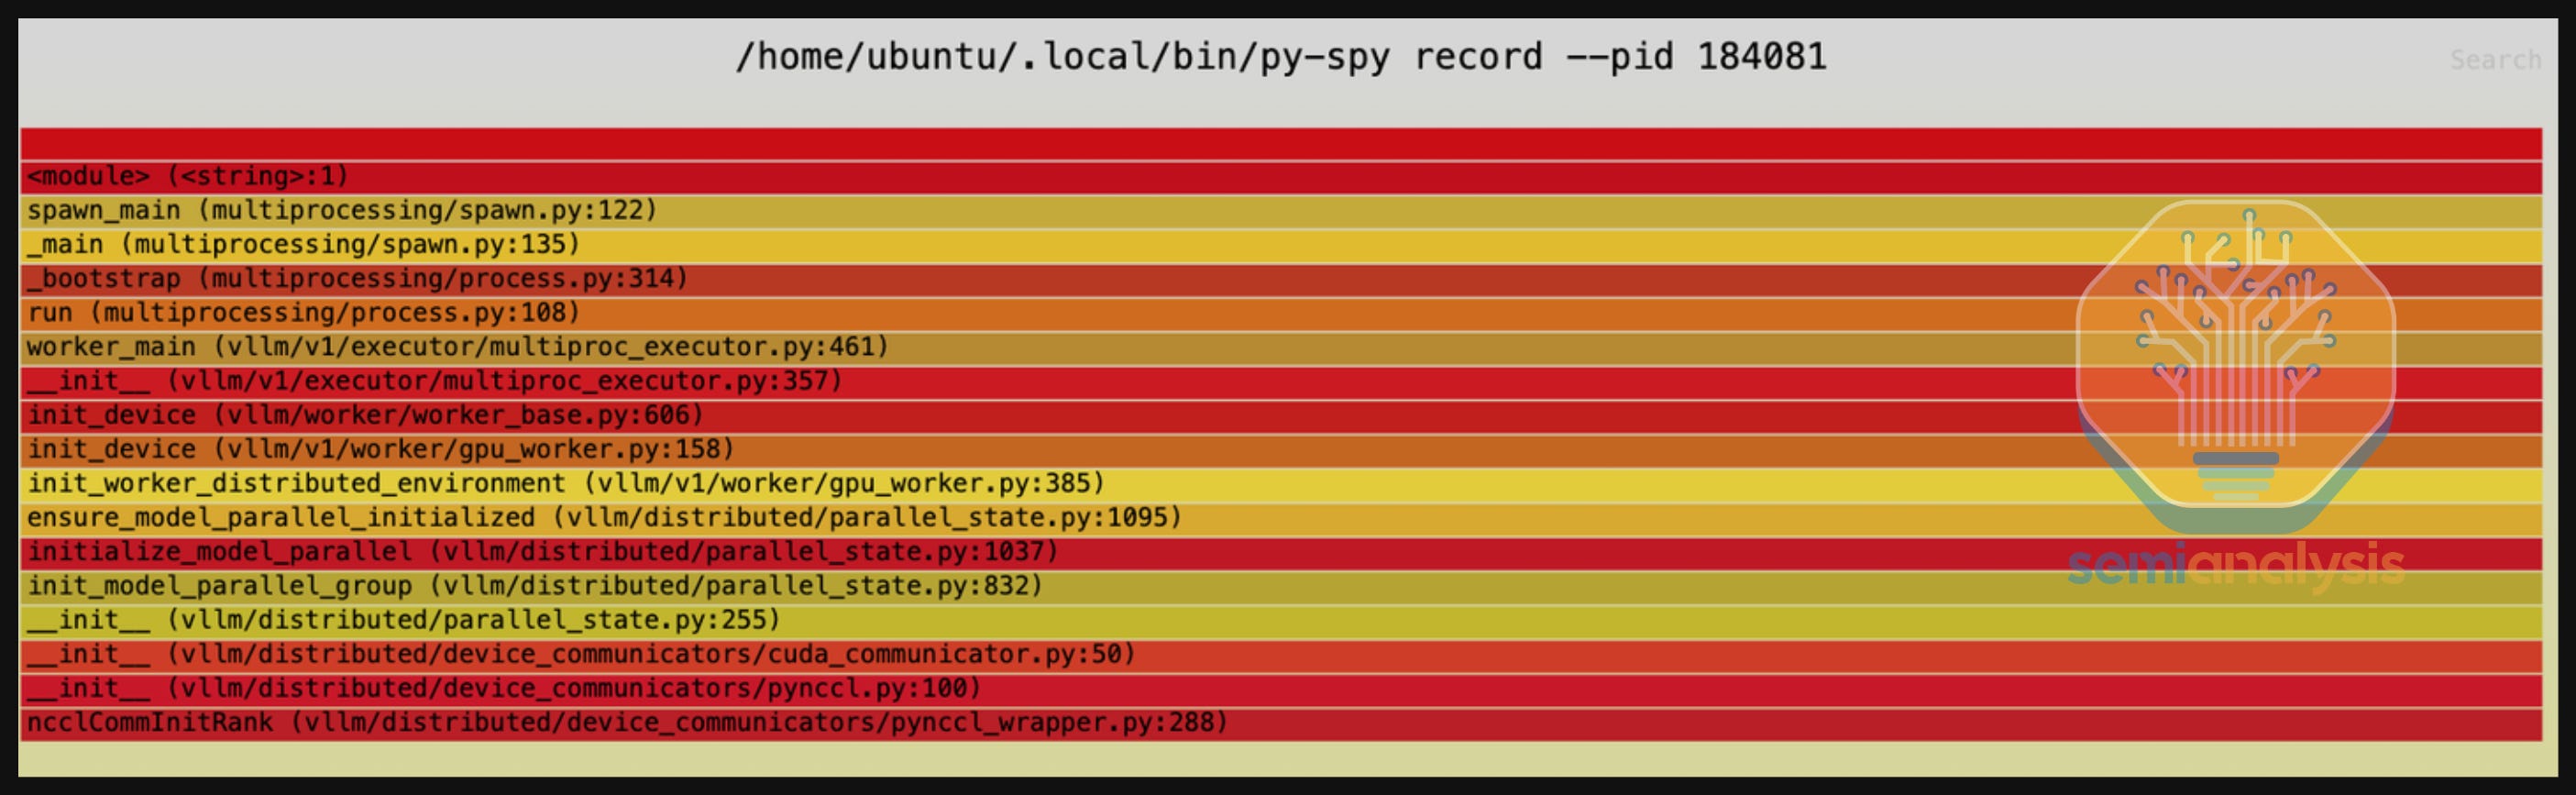
Reading through vLLM’s NCCL bindings, we weren’t convinced that the FFI binding was the root cause of issue. Running nvidia-smi, we saw that the GPU_UTIL was not at 100% but instead at 0% - indicating that no kernels were running on the GPU, leading us to conclude this was not a device side NCCL deadlock.
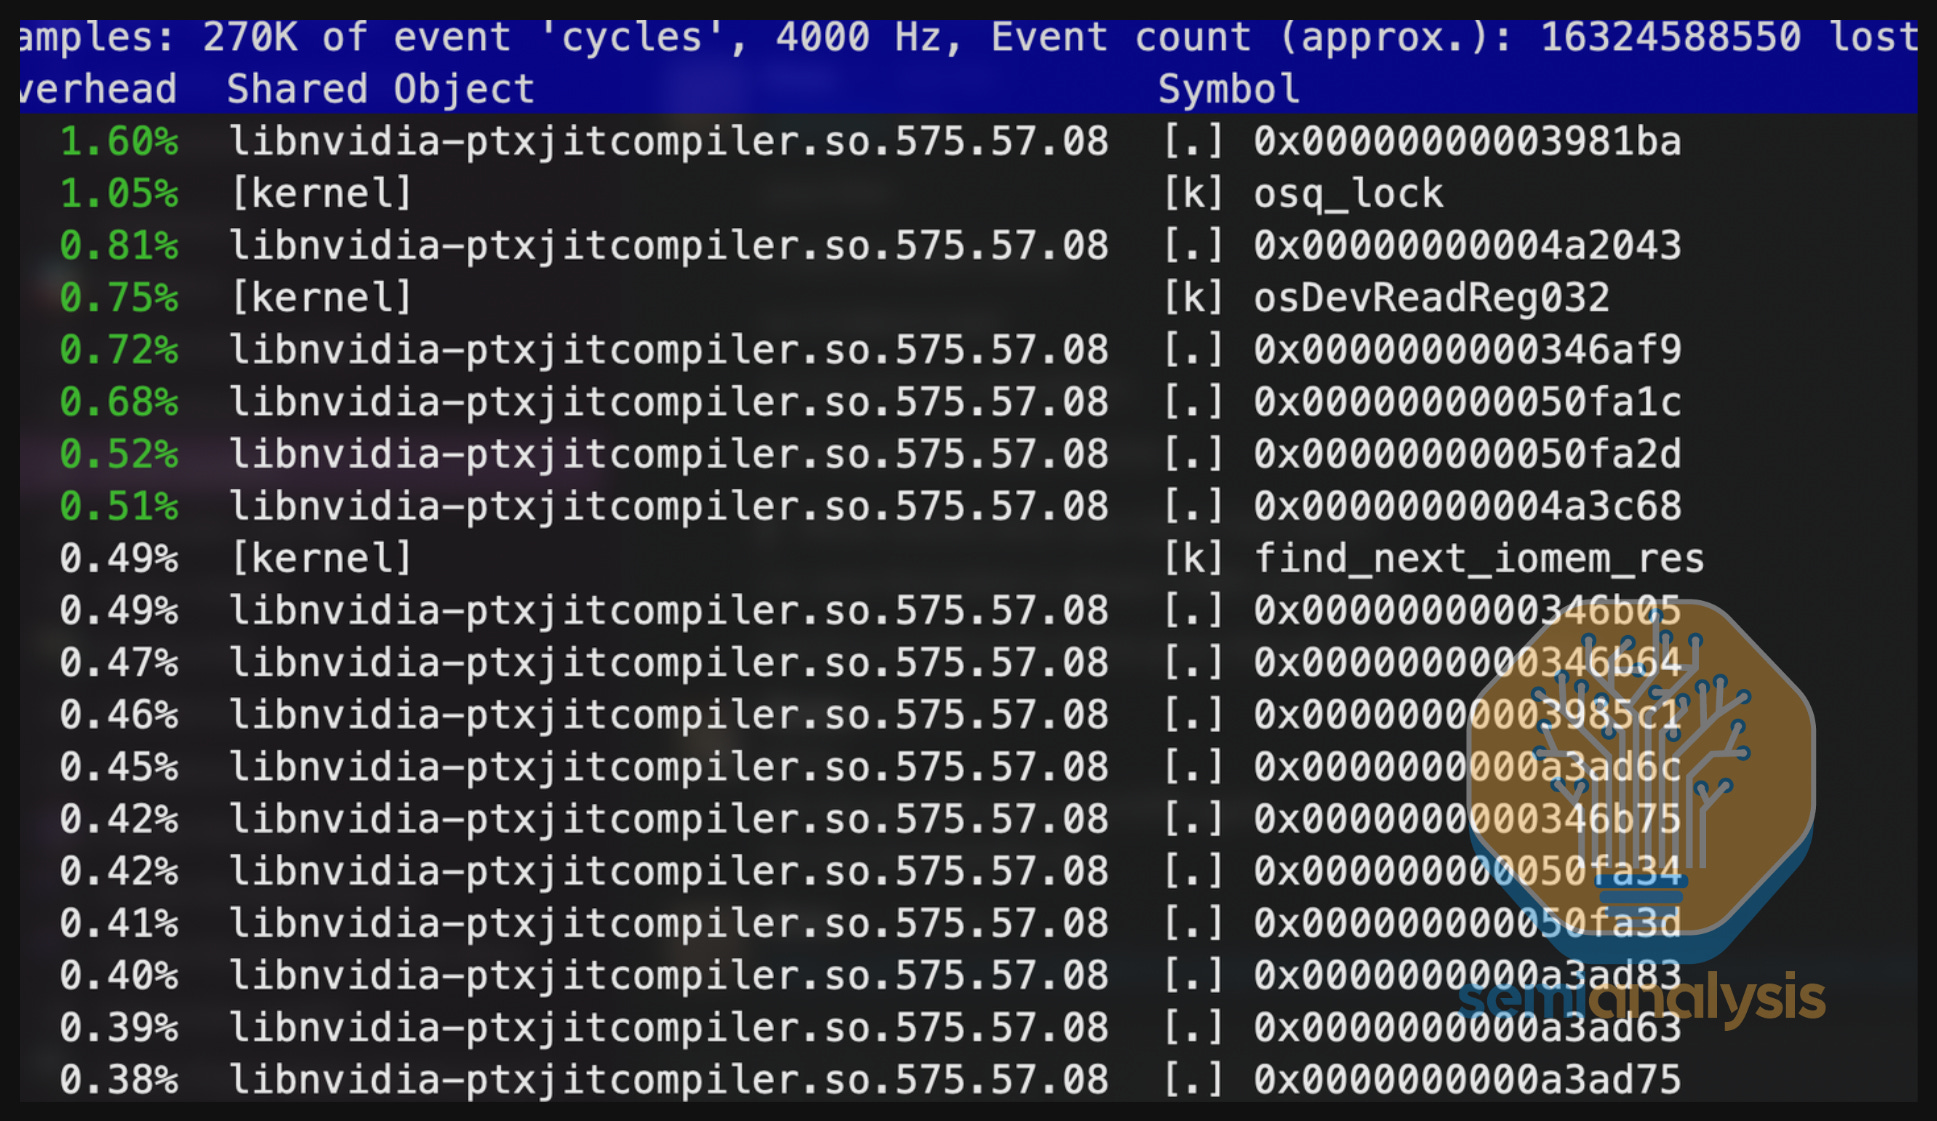
Next, we used linux perf top profiler to look beneath the python layer and try to gain more insight into what specific shared library could be triggering this issue. We noted that most of the CPU cycles for this process (and sub processes) were running on “libnvidia-ptxjitcompiler.so”. Reading the docs on “libnvidia-ptxjitcompiler”, we came across a description that reads: “The PTX JIT Compiler library (/usr/lib/libnvidia-ptxjitcompiler.so.575.57.08) is a JIT compiler which compiles PTX into GPU machine code and is used by the CUDA driver”. This is extremely strange as we are not sure why this is calling the PTX compiler on init given that there are no just in time kernels to compile because typically all the NCCL kernels are prebuilt at build time.
We were too lazy busy to rebuild the whole container image to compile NCCL from scratch with debug symbols enabled. Thus, we next used strace to figure out what syscall calls ptxjitcompiler was making in order to dive one layer deeper into which functions are being called. We see that ptxjitcompiler was creating and adding files to ~/.nv/ComputeCache/ inside the container.
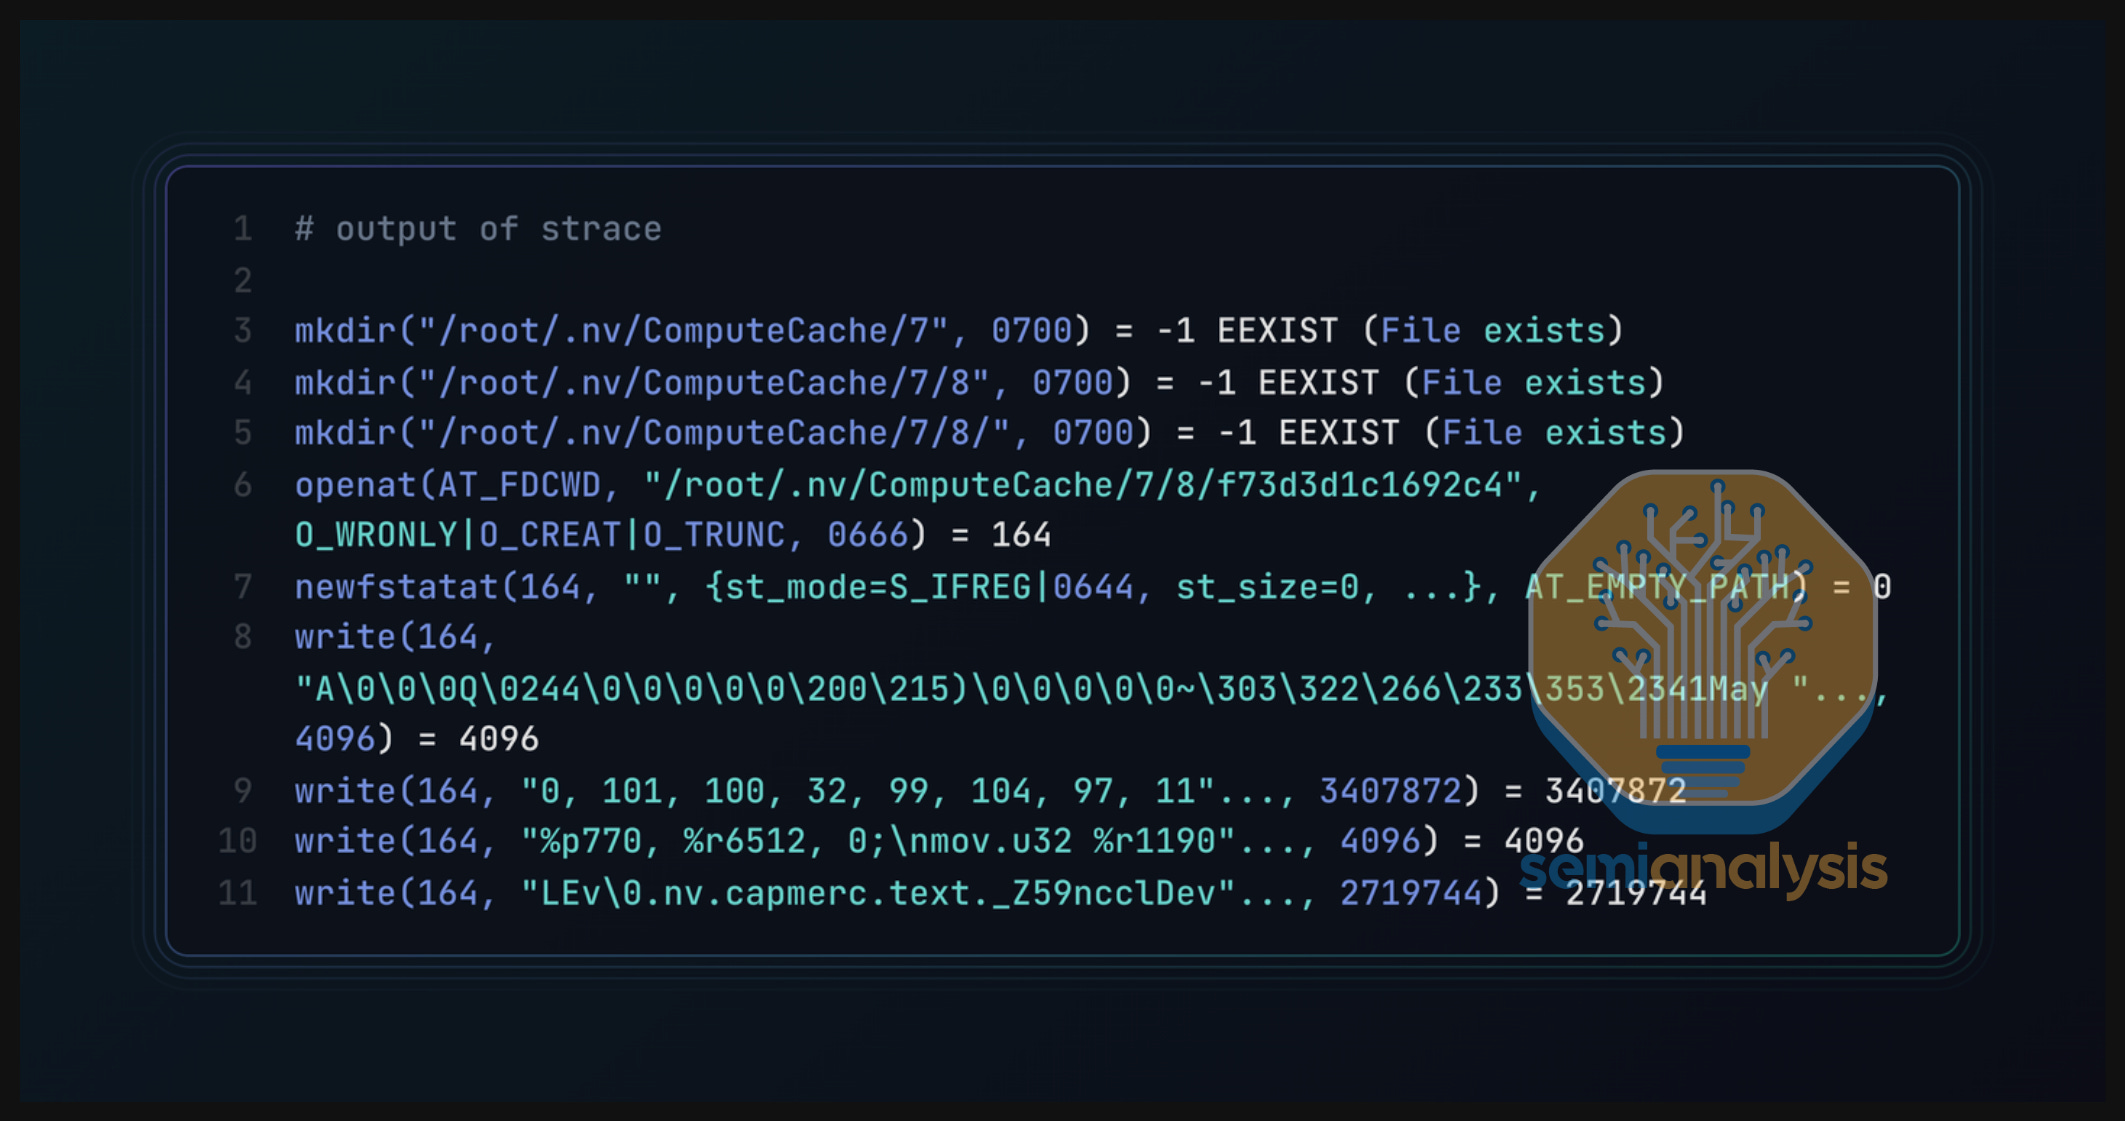
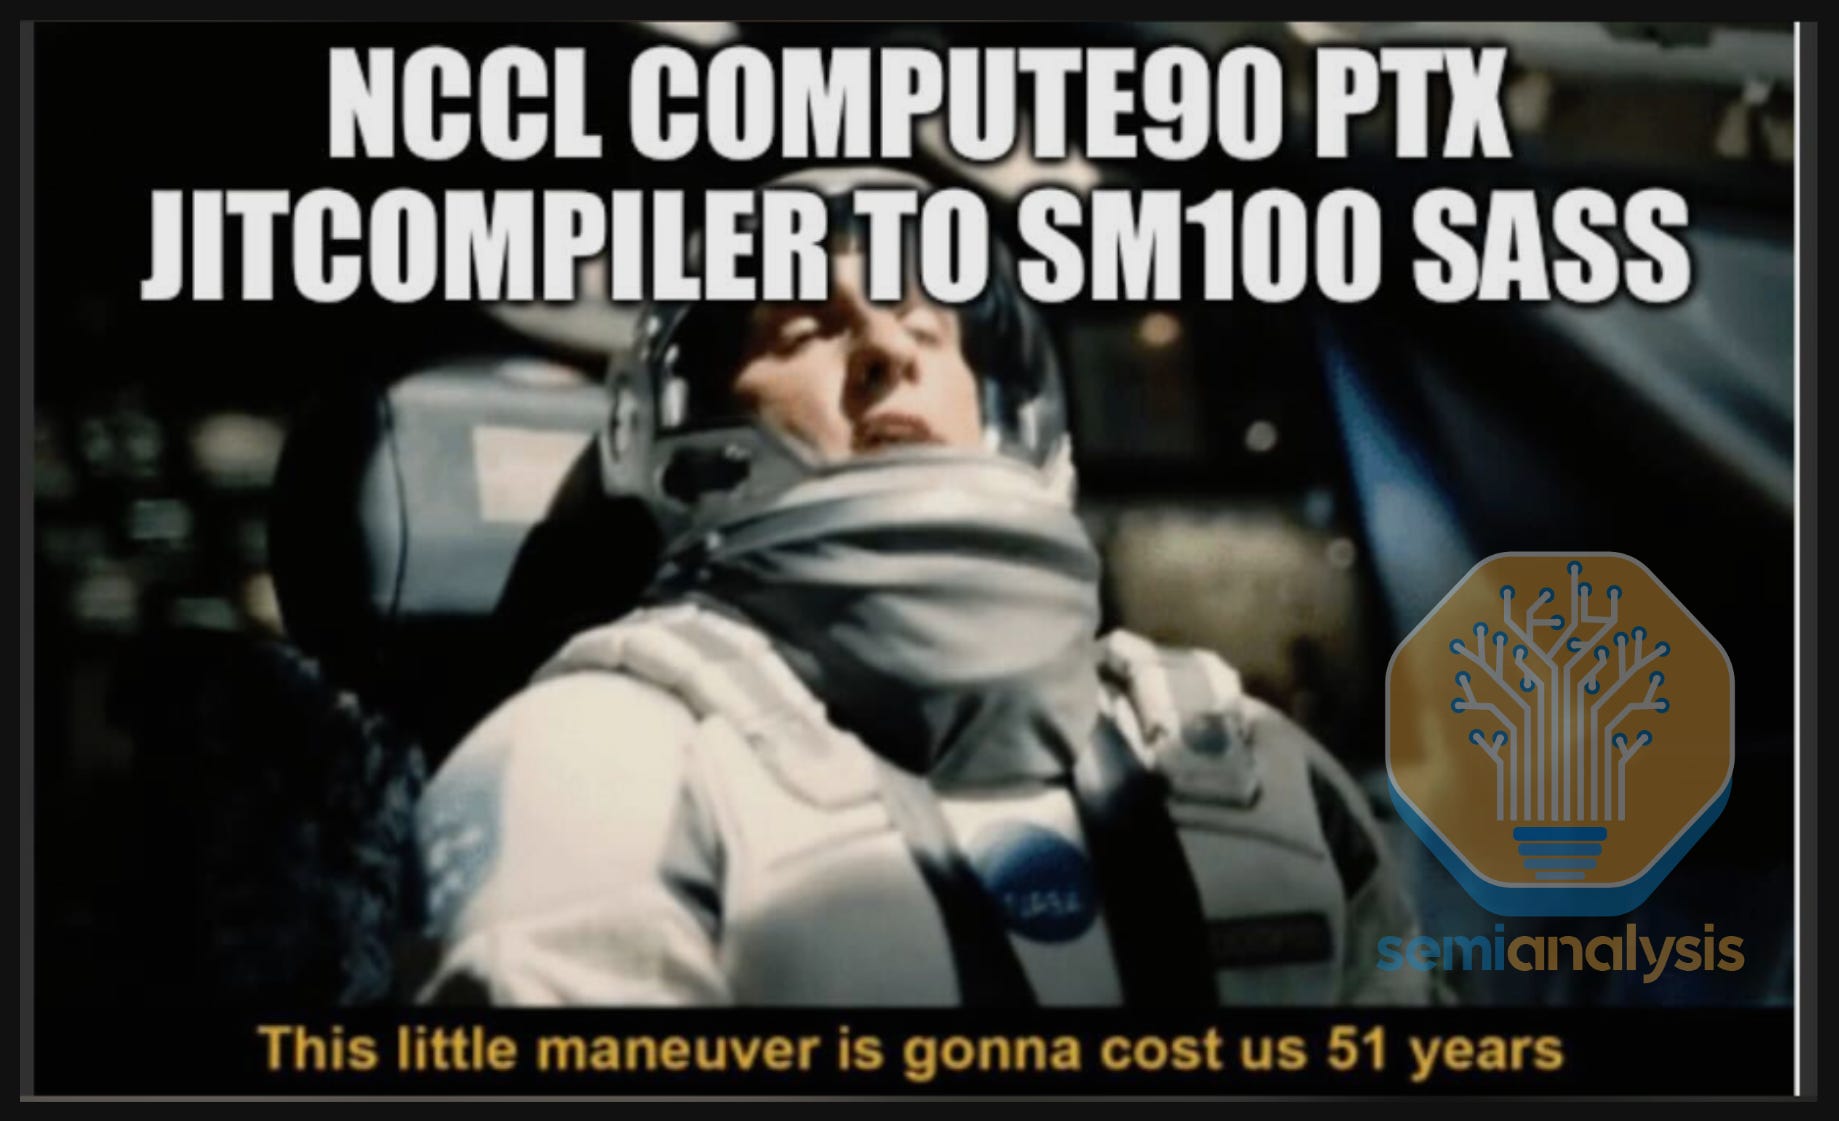
Peeling back yet another layer of the onion, we read up on what ~/.nv/ComputeCache/ does. According to documentation, it is the cache to convert PTX virtual ISA to SASS machine code. This was also very puzzling to us as typically NCCL is built with the machine code already bundled in addition to the PTX virtual ISA. We started reading the NCCL build scripts and we noticed that SM100 (Blackwell) wasn’t enabled for CUDA 12 which was what we were using and found out that they had only enabled it for the upcoming CUDA 13. This means that SM100 SASS was not bundled in and we were JIT converting compute_90 (hopper) PTX to SM100 SASS resulting in the process taking an extremely long time. The reason why other people didn’t see this bug when he ran it was that he was using an internal cluster using slurm with a setting that manually mounted his home directory. Since the SASS JIT cache is stored in the home directory, ~/.nv/ComputeCache/, the SASS was already cached!
It turns out that the vLLM July container image was based on the pytorch container image which used a version of NCCL that didn’t have Blackwell SM100 prebuilt. The fix is to use a post fix version of 2.26.2 that has Blackwell bundled such that we don’t waste 30 minutes compiling virtual ISA to machine code. This bug has since been fixed in the latest vLLM container images. Thank you to simon-mo, youkaichao, mgoin, Robert-shaw, ptrblck, and Kedar Potdar for helping implement the permanent fix and immediate action on the quick resolution.
Another Blackwell issue we ran into is that a sub-dependency of vLLM/SGLang, Flashinfer, was running into file lock race conditions. For whatever reason, Nvidia decided that instead of bundling compiled kernels into the container image, they were going to download them at server launch time. Since we have up to 8 processes per node (1 process per GPU), if the code was not process safe, we would run into race conditions while downloading these compiled kernels.
It turns out that this race condition was introduced due to in an attempt to prevent race conditions from happening! Instead of relying on the builtin FileLock python package’s lock cleanup, flashinfer manually cleans it up which results in a race condition. This has been patched in Flashinfer but has not yet been upstreamed to vLLM/SGLang Blackwell release container images yet. Huge thanks to the Flashinfer team and Kedar Potar for jumping in and helping debug and patch this in record time - all within 4 hours of getting connected with the team.
There is another Blackwell bug with respective to Flashinfer changing an build environment flag name to FLASHINFER_CUDA_ARCH_LIST but the Nvidians did not inform the vLLM/SGLang maintainers or contribute their own PR thus for a couple weeks, vLLM and SGLang did not support AOT for flashinfer.
We were seeing that every so often, our Nvidia container toolkit would completely error out and display this message:
“docker: Error response from daemon: failed to create task for container: failed to create shim task: OCI runtime create failed: runc create failed: unable to start container process: error during container init: error running prestart hook #0: exit status 1, stdout: , stderr: Auto-detected mode as ‘legacy’
nvidia-container-cli: initialization error: driver rpc error: timed out: unknown”
Trying to use the nvidia-smi in CLI would trigger a stall as well. This indicates that the entire Nvidia driver has actually crashed. After a detailed debug session with the Nvidia firmware/driver team and the Nvidia NCCL team, we found out that there is a slow resource leak bug around since NCCL 2.26 given that we are using CUDA graphs and launching over 500 Blackwell containers per night.
Because we are stopping and starting so many Blackwell containers, all of these starts and stops accumulate until they eventually crash the driver. The specific cause of the resource leak bug stems from that fact that when CUDA graph is enabled, NCCL will by default enable user buffers. If it wasn’t for the resource leakage bug, the NCCL user buffer feature would have reduced the data movement between the application level buffer and the internal NCCL buffer by having NCCL use the application buffer enabling zero-copy. The temporary fix is to not enable NCCL user buffer in the interim period until the bug fix can be rolled out. The ETA for the fix is around Oct 20th, and it is expected to ship as part of a minor update to NCCL 2.28. Thank you to Kedar Potar and the numerous Nvidia team members for promptly identifying the root cause and fixing the bug with incredible speed and support.
On the AMD front, we ran into fewer bugs while developing InferenceMAX™, and these bugs were easier to fix. One such bug was that that AMD’s CUDNN equivalent, AITER, was crashing in a helper function due to it not accounting for the fact that “/opt/rocm/llvm/bin/amdgpu-arch” not only returns the compute architecture (i.e. gfx942) but also would return gfx942 whilst including a suffix. AITER is meant to pattern match to figure out which architecture it is working with, but it did not account for a suffix being present. It was easy enough to craft a temporary fix, but there will be a permanent fix coming into AITER in the next couple of weeks. Thank you to Quentin for helping patch this one!
We also encountered a bug when benchmarking MI355X, where the benchmark runs crashed and dumps 1TB of files named gpucore.XXX. After investigation, we found out the root cause was chunked prefill size in the server configs was set too high. Lowering it from 196608 to 32768 fixed the issue (PR link).
AMD recently added pyxis support, which has resulted in a good UX for using containers in SLURM, especially when it comes to multi-node training or multi-node offline batch inference jobs. However, we ran into one bug related to their ROCm 7.0 SGLang image “rocm/7.0:rocm7.0_ubuntu_22.04_sgl-dev-v0.5.2-rocm7.0-mi30x-20250915” which caused a hard crash when trying to run this image through pyxis SLURM. The root cause of this stems from how permissions are handled with the some of the layers that make up that docker image causing permission conflicts between layers. The AMD team is looking into how to permanently fix it and prevent such errors from happening again.
Back in July, When we tried to enable AITER on SGLang for AMD GPUs, the process took 10x longer than normal (~30 minutes in total) given a slow process to finish compilation for DeepSeek V3 (GitHub issue here). This issue was eventually resolved in future releases and is currently fixed.
GitHub Action CI/CD Bugs
GitHub Actions’ self-hosted runner support provides a straightforward solution for the benchmarks we wanted to run with InferenceMAX™. The integration was quick to set up and allowed for running reproducible workflows on various GPU clusters without building custom infrastructure. However, as InferenceMAX™ began to scale up to include more jobs, some limitations of GitHub Actions were uncovered.
Each benchmark variation runs as an individual job. For each model, we benchmark different combinations of the following: different GPUs, input/output sequence lengths, precision, tensor parallelism, and concurrency. This creates a combinatorial explosion in the number of jobs per workflow as more configurations are added.
To illustrate: InferenceMAX™ currently benchmarks 3 models across up to 7 GPU types, 3 distinct ISL/OSL pairs, 2 precision settings, and roughly 4 concurrency and tensor parallelism options. Not every model uses all possible configurations, but this worst-case estimate gives us 3 * 7 * 3 * 2 * 4 * 4 = 2016 distinct jobs. At this scale, the GitHub Actions workflow visualization hits a limitation: the server times out after ten seconds when attempting to render the DAG, resulting in an error message. This makes it extremely difficult to debug the run. Our workaround for this involved splitting up the single nightly workflow into three, splitting by ISL/OSL pairs. This reduced jobs per workflow from approximately 1500 to 500, which the server appears to handle reliably.
Another bug involved a hard limit when using the download-artifacts@v5 action. At the end of each full sweep workflow, a job runs that collects and aggregates the performance results from all jobs, which are stored as artifacts of the workflow. As part of the collection process, the download-artifacts@v5 action is called. This initializes an artifact client, which in turn invokes a list artifacts function (needed to list all artifacts and then pattern match to find the requested one) that enforces a hard limit of 1000 for “performance reasons.” There allegedly should have been a warning printed when the client tries to list more than 1000 artifacts, but we never observed this behavior.
We would like to thank Scott Guthrie for connecting us with the right people at GitHub, and thank those team members for helping us implement temporary workarounds for these bugs. We look forward to continued use of GitHub Actions to create one of the largest GPU CI/CD fleets in the open-source world.
Recommendations to Nvidia and AMD
Even though a great number of users and GPUs are running on SGLang and vLLM, Nvidia has been allocating most of their inference engineers towards working on TensorRT-LLM and have relatively few engineering resources dedicated towards supporting SGLang and vLLM. We recommend that Jensen allocate more inference engineering resources toward supporting and contributing to popular inference engines like vLLM and SGLang. This will allow Nvidia to better fulfill their mission of accelerating workloads no matter which inference engines users select.
Furthermore, the ML community would benefit from a surge of additional time and resources from Nvidia for QA’ing their Blackwell software to minimize the number of bugs that end users encounter as they ramp applications on these new platforms. When developing InferenceMAX™, we ran into many bugs that are only encountered in Blackwell and are not present on Hopper or other platforms.
On the AMD front, we have suggested that they reduce the number of ROCm specific flags that need to be manually enabled to achieve reasonable performance. AMD has recognized this and has already commenced work on ensuring that optimized configs are set by default. In fact, many changes that act to reduce number of flags needed have already merged into master.
We recommended the same for Nvidia’s Blackwell platform and also suggest that Nvidia work on reducing the number of flags needed to get reasonable performance by moving towards enabling performance optimizations by default.
InferenceMAX™ Next Steps
Over the next couple months, we’re expanding InferenceMAX™’s hardware coverage by integrating Google TPU and Amazon Trainium and we plan on going live within the next two months. This will enable unified, apples-to-apples comparisons across AMD, NVIDIA, Google, and AWS accelerators. This marks an important step toward making InferenceMAX™ a fully cross-vendor open benchmarking platform for the entire industry.
Furthermore, another initiative we’re also introducing is doing nightly evals including MATH-500 and GPQA-Diamond on FP4 models, allowing the community to measure throughput vs. quality trade-offs in a consistent, transparent way. This will help highlight how low-precision inference affects accuracy across diverse model families and deployment scenarios. In addition, we will be tracking output token throughput too to create more extensive insights.
On the NVIDIA & AMD systems front, several exciting initiatives are underway. We’re working on DeepSeek’s disaggregated prefill + multi node expert parallelism configurations on MI300- and MI355-series GPUs & B200 GPUs too, testing how these advanced parallelism optimization scales across inference workloads. At the same time, we are exciting to test both HGX B300 Blackwell Ultra & GB300 NVL72 Blackwell Ultra to see what is the performance gains over GB200 NVL72.
InferenceMAX™ is not perfect but it is our strong belief that we are heading in the right direction of having an benchmark that matches the pace of AI software progress & will continue to integrate feedback from ai chip vendors, frontier labs & major consumers of accelerators.
Next, we will deep dive into breaking down the the different components that make up the TCO of the GPUs we are currently used in InferenceMAXv1, such as, H100, H200, B200, GB200 NVL72, MI300X, MI325X, MI355X.