

Memory Mania: How a Once-in-Four-Decades Shortage Is Fueling a Memory Boom
Prices are doubling again, Supercycle is bigger, and could last longer than you think
Prices of memory are going crazy. SemiAnalysis has been calling this out for over a year since late 2024. The scariest thing is that we aren't even close to the peak. We go through fab by fab production and expansion versus detailed end market demand by memory type to forecast memory revenue, pricing, and margin better than anyone else. This has all been detailed in the SemiAnalysis memory model for a while, but we will share it more publicly today. First some background.
The Inevitability of Memory Cycles: A History of Booms and Busts
Since its commercial introduction in the 1970s, DRAM has benefited from the two scaling laws that defined the semiconductor industry: Moore’s Law and Dennard scaling. The 1T1C DRAM cell, with one access transistor and one storage capacitor, scaled for decades. Shrinking transistors reduced cost per bit, while clever capacitor engineering preserved sufficient charge to maintain signal integrity.
For much of the industry’s history, DRAM density scaled faster than logic, doubling roughly every 18 months instead of 24 months and driving dramatic cost reductions. As a commoditized product, manufacturers needed to sustain cost-per-bit declines to stay competitive. Suppliers who couldn’t compete on cost fell into a downward spiral: low sales left them short on cash to finance next-generation nodes, which in turn left them further behind on cost-per-bit. Many DRAM producers fell victim and went into bankruptcy, resulting in consolidation to just a few major players today.
For more details on the industry and DRAM basics, check out our technical deep dive:

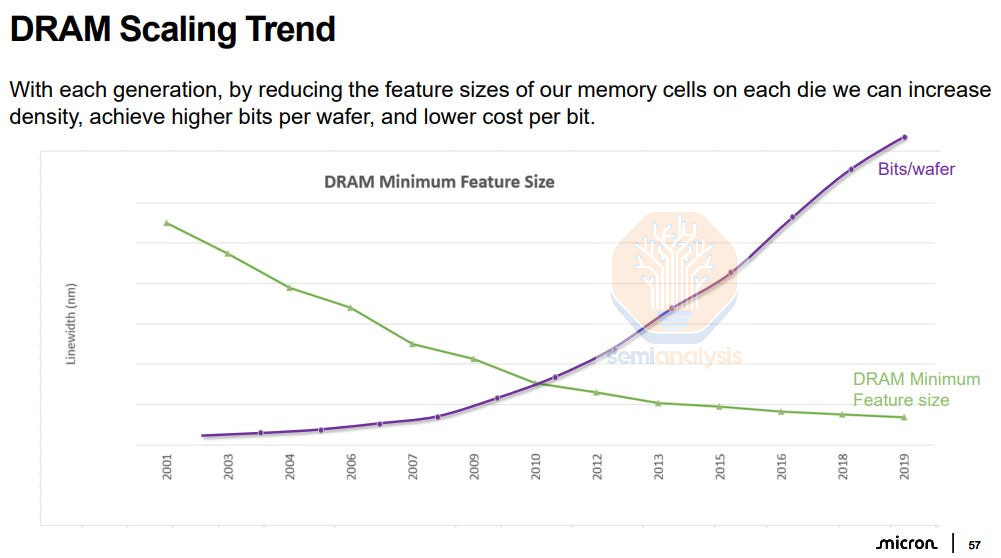
Yet DRAM scaling has slowed significantly over the past few decades, and density gains over time have shrunk. Over the past decade, DRAM density has increased by only ~2× in total, versus roughly ~100× per decade during the industry’s peak scaling era. Capacitors are now extreme three-dimensional structures with aspect ratios approaching 100:1, storing just tens of thousands of electrons. For comparison, a small static shock when you touch a metal doorknob might involve the transfer of billions of electrons. The static charge on just a speck of dust might be 10,000x what is stored in a modern DRAM cell.
Bitlines and sense amplifiers, once secondary concerns, are now dominant constraints. Every incremental shrink reduces signal margin, increases variability, and raises cost.
An easy way to understand the technical challenge in DRAM scaling is to think of a DRAM cell as a tiny bucket that holds electricity instead of water. Each bucket stores a bit of data by holding a small electrical charge. Over the years, engineers made these buckets smaller to fit more memory on a chip. At first this worked well. But today, those buckets are not just tall they are tall and narrow, each is like a tiny drinking straw standing upright. Because of the size each bucket now holds very very few electrons.
This is a problem. When the system tries to read the data, it has to detect this very faint electrical signal and distinguish it from noise. The wires that connect these cells (the “bitline”) and the tiny sensors that read them (called sense amplifiers) are now the main bottleneck. The signal is so weak that even small variations in manufacturing or temperature can cause errors.

Together, these constraints explain why DRAM density has stagnated and why DRAM scaling has slowed down significantly over the years. The collapse of DRAM scaling has far-reaching consequences across cost, architecture, and industry structure.
As density gains slow, cost per bit reductions have slowed down. DRAM pricing is now more dependent on capacity additions and cyclical supply-demand dynamics rather than technology-driven cost reductions which have been a powerful deflationary force.
Memory Cycle Part II: Key Features of a Cycle
The memory industry has been defined by commoditization, which comes with cyclicality. This outcome reflects a combination of industry-wide competitive behavior, recurring lapses in capital discipline, and the nature of DRAM scaling we explained earlier.
At its core, memory’s cyclicality is driven by timing mismatches between demand changes and corresponding supply responses. Aside from the buffer of short-term inventories, DRAM supply is not very flexible. It can take years to bring meaningful new DRAM supply online, trying to meet demand that fluctuates daily.
Memory manufacturing, much like logic, is among the most capital-intensive industries in the world. Building leading-edge DRAM and NAND fabs requires multi-billion-dollar investments (which have steadily increased over the past few decades), multi-year construction timelines, extended yield-learning curves across successive process nodes, and lengthy ramp-up periods before meaningful volume production is achieved.

These heavy capital investments mean that suppliers need to operate with high utilization rates to generate cash profits to earn a payback. However, utilization rates ultimately depend on market demand, which is influenced by a range of external factors (macroeconomy, end market sentiment, product cycle, etc). In practice, utilization can swing dramatically across cycles, ranging from roughly 95% in a supercycle to as low as 50% in significant downcycles.
Still, because the majority of the cost is already sunk, the fab is built and equipment purchased, suppliers are better off running wafers so long as they can sell bits above cash operating costs. Where demand is weaker than bit supply, prices go down as you’d expect. Elasticity within the market is always a hot debate.
Memory supply can be expanded by migrating to more advanced process nodes with yield improvements, which increases bit supply without requiring new “greenfield” wafer capacity additions. For example, Samsung’s leading-edge 1c DRAM process node delivers roughly ~70% higher bits output per wafer compared with its 1a node. This means that on a per-wafer basis, a 1c-node DRAM wafer can deliver roughly 70% higher bit output than a 1a-node wafer (assuming the same yield), meaning significantly more memory supply from the same amount of raw material.
The impact of node migration, however, is dynamic over time. When a new node is first introduced, initial yields are typically lower, limiting effective output as well as wafer capacity, given the potential new equipment introduction, replacement, and ramp-up timeline. As yield learning progresses and node migration expands, the bit output per wafer increases materially, resulting in more bit supply even if wafer output is held constant.
Another thing is that node transitions do not halt simply because demand weakens. Consequently, bit supply growth can remain robust well into downturns. This exacerbates oversupply and downward price pressure.
In a downturn, the impact of pricing declines can be existential for memory suppliers. By the time pricing rolls over, manufacturers have already committed and deployed multi-billion-dollar capital investments into fabs and equipment that cannot be economically idled. As demand weakens, utilization rates fall, fixed costs are under-absorbed, and cash generation deteriorates rapidly. The result is a sharp compression in gross margins and an inability to earn an adequate return on invested capital precisely when balance-sheet stress is rising.
The risks inherent in “memory economics” are high. A highly commoditized product with elastic demand versus a capex-heavy, long-timeline, inelastic supply produces a challenging, cyclical market.
During the Windows PC supercycle of the early to mid-1990s, there were approximately 20 meaningful DRAM suppliers. Elevated demand and strong pricing attracted aggressive capital investment and new entrants. Subsequent downcycles systematically eliminated the weaker players. From roughly 20+ players in the mid-1990s, the number of players contracted to the mid-teens in the 2000s and early 2010s, to fewer than 10 relevant suppliers in the 2020s. Today, there are only 3-4 material suppliers.

From a demand perspective, memory consumption is not always linear or predictable. During mature phases of existing product cycles, demand growth can be relatively stable, driven primarily by incremental unit growth or stable increases in memory content per device. However, during “inflection periods,” when new computing platforms or architectures emerge as primary demand drivers, memory demand can shift abruptly. During these periods, memory consumption tends to grow non-linearly if not explosively.
There have been several of these product cycle inflections over the past few decades. New computing platforms like the PC, the smartphone, cloud computing, and now AI accelerators drove abrupt increases in both the number of systems and memory content per system. In prior cycles, these demand inflections often caught memory suppliers off guard, a dynamic we will discuss in the following section.
However, such inflection-driven upcycles have not been sustainable in the long run. Prior memory supercycles have tended to peak and roll into downcycles within one or two years, as elevated profitability drives aggressive capital investment, accelerated capacity expansion, and faster-than-anticipated bit supply growth. These supply responses, combined with the inherently cyclical nature of end demand, have consistently led to oversupply and subsequent market corrections.

From a financial market perspective, participants are forward-looking. Investors anticipate shifts in the supply–demand balance and pricing well before supplier earnings and margins actually peak. We see this almost in every single memory cycle over the past three decades.
There are a few especially interesting examples, worth revisiting in the context of the current memory supercycle: the 1993 Windows PC supercycle, the cloud and mobile upcycle in 2010, the 2017-2018 supercycle from cloud and NAND, and the unexpected upcycle during Covid-19.
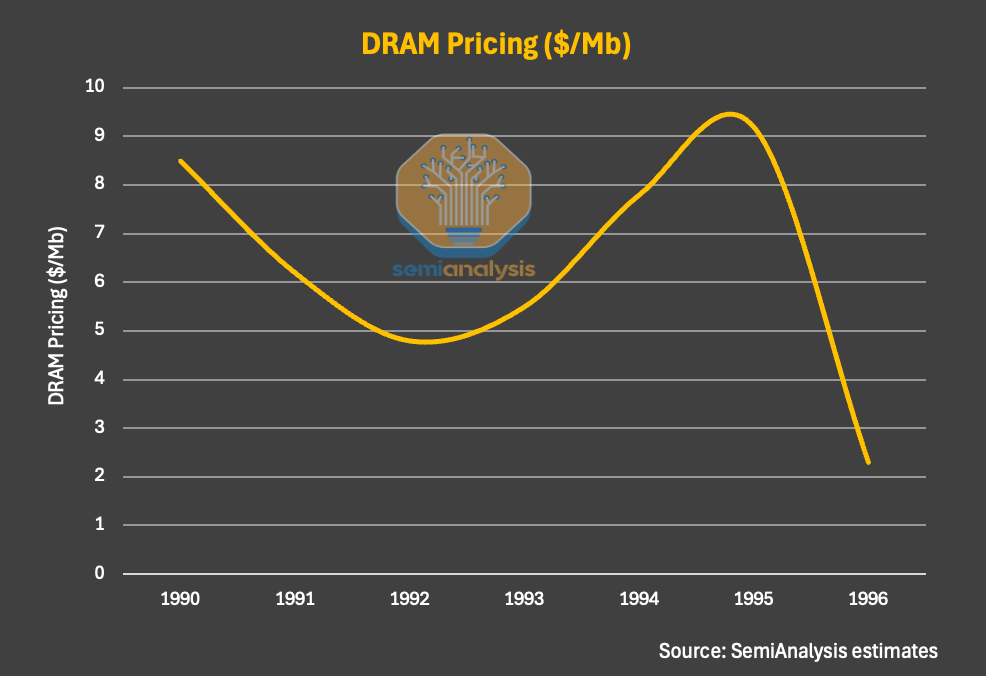
During the 1993 memory supercycle, the DRAM industry entered a strong upcycle driven by the rapid adoption of Windows PCs and the broad implementation of graphical operating systems. Unlike prior generations of personal computers, Windows PCs transitioned from text-based interfaces to GUI (Graphical User Interface)-driven computing, which dramatically increased DRAM requirements per system. Average DRAM content per PC jumped from roughly 1–2MB to 4–8MB, representing an approximate 4× increase in memory content per device. This step-function increase in DRAM intensity coincided with accelerating PC adoption, with unit shipments growing at roughly double-digit rates.

On the supply side, the industry was emerging from a prolonged downturn in the late 1980s because of intensified competition, declining margins, and a significant shakeout among U.S. and European DRAM suppliers. As a result, capacity expansion had been constrained and yields were uneven, leaving the supply suppliers ill-prepared to absorb the sudden surge in demand. With this perfect setup in both supply and demand, an industry shortage inevitably occurred. During 1993 and 1994, DRAM demand outpaced supply despite most fabs running at full utilization. Spot and contract prices for 4Mb and 16Mb DRAM rose sharply, and gross margins for leading suppliers surged well above 50%.
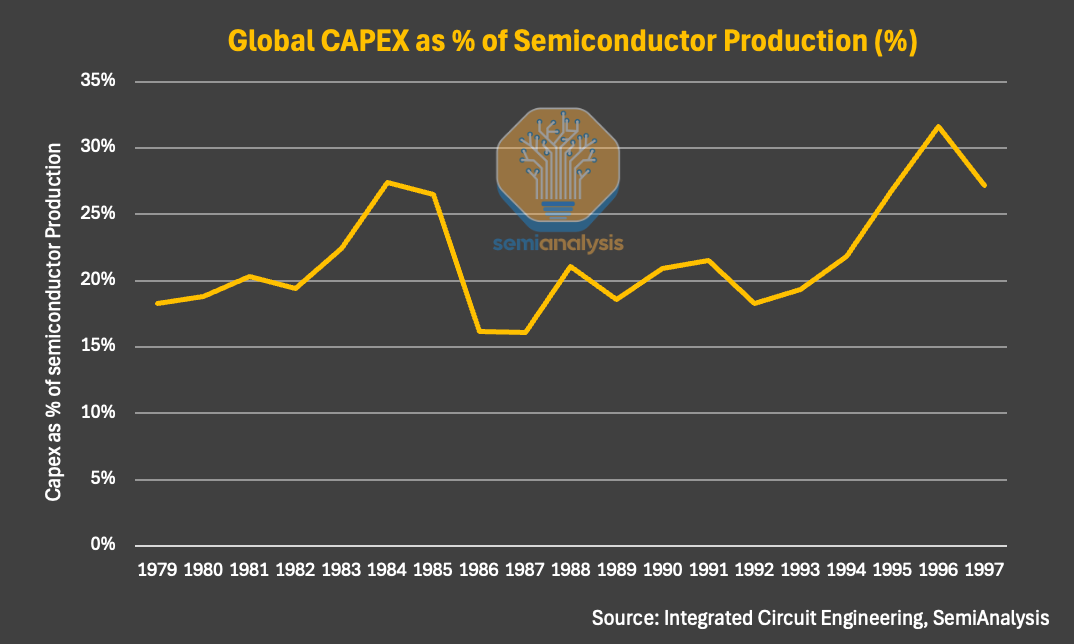
Unsurprisingly, this set the stage for a downturn. Japanese incumbents and then-emerging Korean players responded with aggressive capacity expansion—bringing new fabs online and accelerating process shrinks. This was reflected in global semiconductor manufacturing spend as the supercycle took hold, with capex as a percentage of semiconductor production rising steadily and at one point exceeding 30%. Reinforcing this late-cycle signal, roughly 50 fab construction plans were announced during 1995–1996 alone.
Rapid yield improvements further amplified supply, driving a sharp increase in bits per wafer. By 1995–1996, the market gradually flipped from shortage to oversupply. This led to sharp price declines of more than 60%, forcing widespread exits and accelerating industry consolidation.
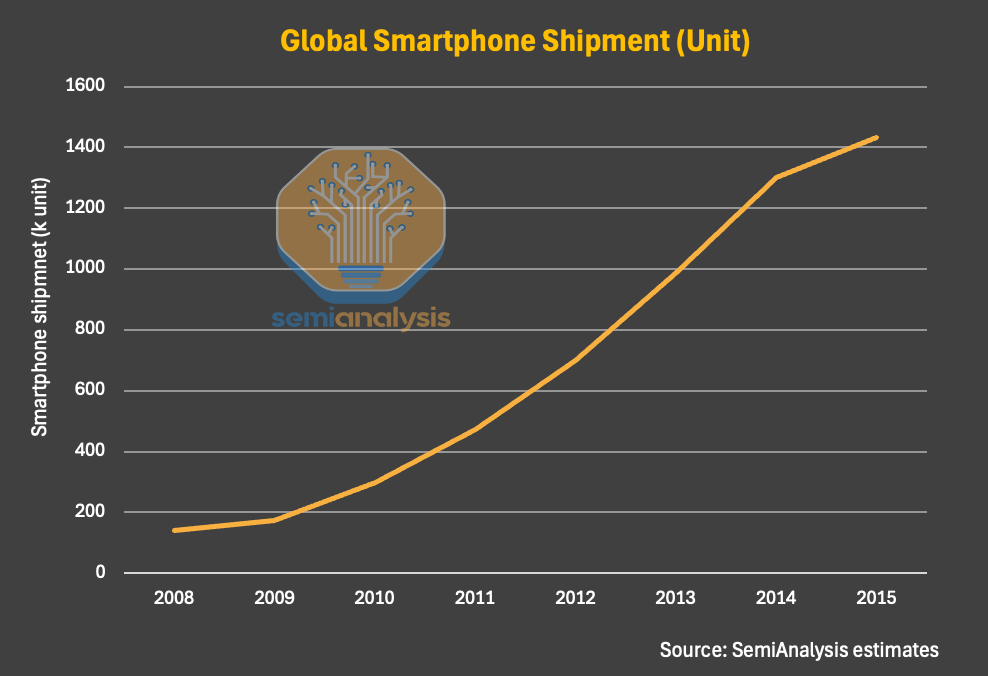
The 2010 memory supercycle started in roughly the 2nd half of 2009, driven by two simultaneous demand inflections: (1) the smartphone rapid adoption globally, led by the iPhone and a rapidly proliferating Android ecosystem, and (2) the early hyperscaler buildout wave (e.g., Google, Amazon, Facebook). Server DRAM intensity increased due to virtualization and scale-out services. Supply growth was muted as suppliers drastically cut investment in the poor macro environment post the Global Financial Crisis.
On top of this, smartphone demand growth was a near-vertical volume step-up. Global smartphonec by broader Android price-tier penetration and iPhone scaling. On the cloud side, while the servers’ shipment growth increased much more slowly compared to mobile during that period, the key change was the DRAM content per server. The industry was shifting toward higher-memory configurations to support consolidation, virtualization density, and early big-data workloads. DRAM content per server increased from single-digit gigabytes (GBs) to tens of GBs, representing a significant step-function increase in memory intensity per system.
Similar to prior cycles, the sudden demand surge combined with constrained supply drove a meaningful increase in DRAM pricing. What differentiated the 2010 cycle, however, was the rapid rise of LPDDR within the overall DRAM mix as mobile demand scaled. Because LPDDR products are mostly more cost- and price-efficient and are sold into more price-sensitive end markets, the resulting pricing uplift was materially less dramatic than prior PC-driven supercycles. The pricing characteristics of LPDDR have remained structurally consistent to this day.
Moreover, DRAM pricing in this cycle peaked earlier and rolled over more quickly than in previous upcycles. Pricing momentum proved difficult to sustain even within the nominal upcycle window. The DDR3 2Gb contract pricing fell ~46% from its 1H10 peak of ~$46.5 to ~$25 by November 2010. By 2011, the correction had broadened further, with a further correction of DRAM pricing.
Another key development of this cycle was the rapid standardization of mobile DRAM which further accelerated commoditization. LPDDR2 was standardized by JEDEC in 2009, pushing mobile DRAM into a tightly specified, consumer-oriented market structure that limited supplier differentiation and therefore pricing power. These factors together only compressed the length of the upcycles and time to reach the downcycle starting roughly in 2nd half of 2010 and following years.
The 2017–2018 memory supercycle is still a fresh memory for many in the industry and is oft-cited as a good analogue for today’s supercycle. On the demand side, the key driver was server upgrades and buildouts, driven by virtualization, scale-out architectures, and increasingly memory-intensive workloads. DRAM content per server increased materially, shifting demand toward higher-capacity configurations. Server DRAM also enjoys higher ASP and margins compared to PC and mobile, and is therefore more profitable for suppliers.
This pricing environment translated directly into record financial performance, peaking in 2H18. Memory suppliers generated unprecedented levels of free cash flow, and gross margins expanded to levels previously thought unattainable for a commoditized industry.
Yet, as with the prior cycles, the fundamental cyclical dynamics of the industry prevailed. A few familiar factors developed in late 2018 and 2019: (1) supply growth re-accelerated as manufacturers responded to elevated pricing with aggressive capacity additions and technology ramps, and (2) demand growth normalized as end markets absorbed excess inventory and hyperscaler purchasing slowed. Oversupply drove pricing down, and the cycle spiraled downwards.
The most recent DRAM upcycle was catalyzed during the COVID-era “chip crisis,” an unprecedented synchronization of demand shock and supply disruption. Global lockdowns caused abrupt shifts in end markets, including work-from-home, remote education, cloud usage, and digital entertainment. These unexpected social changes drove a sudden surge in demand for PCs, servers, networking equipment, and consumer electronics. All of these categories are DRAM-intensive, and no pre-pandemic forecast could have reasonably foreseen the changes.
Beyond surging end-demand, purchasing behavior amplified the cycle, especially from the enterprise side. OEMs, hyperscalers, and channel partners were taking a defensive posture, aggressively placing years’ worth of orders to secure supply amidst uncertainty. This led to widespread double- and triple-ordering across the supply chain.
From the DRAM suppliers’ perspective, it became increasingly difficult to distinguish true end-demand from panic ordering. The result was a rapid drawdown of industry inventories and a sharp tightening of spot and contract markets, pushing DRAM prices materially higher at their 2021 peak.
On the supply side, the industry was structurally constrained. During the pandemic, suppliers faced additional friction from labor shortages, logistics disruptions, and delayed equipment deliveries. Even where capex budgets existed, wafer output could not be ramped quickly. At the same time, most suppliers had entered the pandemic period with a relatively disciplined supply posture following the painful 2018–2019 downturn, limiting their ability and willingness to add more capacity in response to short-term pricing signals.
Capex decisions during this period were therefore cautious and selective. Rather than aggressive greenfield expansion, memory suppliers prioritized node migration and productivity improvements within existing fabs. Advanced-node DRAM transitions were already becoming more complex and capital-intensive, with diminishing bit-growth returns per wafer as scaling challenges increased. This meant that even elevated capex levels translated into less incremental supply than in prior cycles. The pandemic-era upcycle thus reinforced a structural shift: supply growth became increasingly constrained not just by capital discipline, but by physics and process complexity.
Crucially, this cycle reset industry behavior and expectations. Memory suppliers emerged with a stronger appreciation for disciplined capex, tighter inventory management, and the value of prioritizing higher-margin products over pure bit growth. Customers, meanwhile, recognized the fragility of semiconductor supply chains and the strategic importance of securing memory capacity. These dynamics laid the foundation for the current supercycle by creating a structurally tighter supply. In this sense, the COVID-era DRAM upcycle was not just a temporary dislocation, but a formative event that reshaped the memory industry’s supply-demand balance heading into the current cycle.
AI-Driven Memory Supercycle: Bigger, Longer, and a Shortage that is Harder to Solve
For those who have lived through multiple memory cycles, the central question when it comes to this supercycle is the same: when will this cycle peak? It is natural that both investors and the supply chain remain cautious, particularly as memory stocks rally sharply over short periods. In our view, however, while there are clear similarities to prior cycles, this supercycle is shaping up to be both larger and longer in duration, driven by dynamics that are very much unique to this cycle.
Currently, the DRAM industry is operating in a deeply supply-constrained environment, and based on our Memory Industry Model, we believe the supply–demand imbalance is deteriorating rather than normalizing. Total DRAM supply is projected to remain approximately…
Below, we share:
Our forecast for DRAM and HBM supply/demand mismatch from our Memory Industry Model, through 2027
HBM4 qualification: how is each supplier doing, market share % for Rubin
DRAM wafer- and bit-capacity data with HBM broken out
Upgrades forecast: trends in wafer capacity by node with fab-by-fab details
DRAM pricing forecast out through 2027
Last, we discuss the factors and timing for the end of the cycle
As a bonus, we’ve also included DRAM EUV layer trends and WFE capex forecasts