

EDA Market Primer - Market Dynamics, Cadence, Synopsys, Siemens, China EDA Rise
EDA Market size, Share, Business Models, Drivers, Changing Customer Base, Competitive Dynamics, IP, Hardware, CoT, Lock-In Economics, Disruptive Forces
Every advanced chip on earth is designed using Electronic Design Automation (EDA) software from three companies. Synopsys, Cadence, and Siemens EDA bridge the gap between what a chip needs to do and what a foundry can manufacture, translating billions of transistors into manufacturable silicon.
The Big-3 hold over 85% combined market share (Ansys now part of Synopsys), and the industry has posted positive revenue growth every single year for over a decade. Synopsys generated $8B in CY2025 (including Ansys), Cadence $5.30B, and Siemens EDA an estimated $2.2-2.5B, putting Big-3 combined revenue at around $16B across EDA tools, semiconductor IP, emulation hardware, and simulation software. The broader EDA+IP industry totals $18B when including smaller vendors and Chinese EDA companies.
EDA grows at 13% CAGR while semiconductor R&D grows at 7%. That 6-point spread widened after 2018 as hyperscaler AI chip programs, emulation hardware economics, and advanced node verification costs created EDA demand that outgrew the traditional R&D base.
EDA software tools represent roughly 9-12% of total semiconductor R&D spending, depending on how both the numerator and denominator are defined. When including semiconductor IP licensing revenue from EDA vendors (Synopsys IP at $1.7B, Cadence IP at $0.7B+), EDA vendor revenue as a share of semiconductor R&D rises to 12-15%.
Synopsys CEO Sassine Ghazi noted in early 2025 that semiconductor R&D intensity is rising from roughly 6% of industry sales toward 9%, driven by AI workload complexity. EDA vendors benefit twice from this shift. The R&D budget they sell into is growing as semiconductor companies spend more on design, and their share of that budget is expanding through verification intensity, AI tool premiums, and node transition pricing.
Part 1 of our EDA Primer explained the journey from RTL to signoff. Part 2 follows the businesses behind the tools that make that journey possible. Part 3 will examine how AI is beginning to reshape the entire chip design stack.
In this Part 2, we cover:
Market sizing (~18B today, $28-31B expanded TAM), share, and tool-level dominance
The licensing model: seats, tokens, ELAs, hardware, geographic pricing, and M&A impact
Synopsys deep dive: $35B Ansys bet, near-term headwinds, 100% advanced node share
Cadence deep dive: near-death to 44.6% margins, three-horizon strategy, 2026 outlook
Siemens EDA: Release 8.0 lesson, Calibre blocking position, Altair acquisition
Competitive dynamics: Cadence vs Synopsys in 2026, simulation arms race, IP battleground
The competitive moat: lock-in architecture, franchise tools, design starts, and PDK advantage
Design costs from 28nm to 3nm, with customer case studies (NVIDIA $100M+, Apple $170-260M)
Financial profile: margins, growth math, and cycle resilience
The $3B+ IP business of EDA companies: licensing models, ARM CSS, and turnkey ASIC houses
China: vendor financials, export control timeline (2019-2025), capability gap assessment
R-squared lock-in intensity by customer
Disruption risks
What EDA Exists to Do
Reduce time to market. A chip designed in 18 months instead of 24 captures 6 months of protected revenue. For a $200M product, that’s $100M+ in value, because EDA automates placement, routing, and verification tasks that would take human engineers 10-100x longer.
Optimize PPA (performance, power, area). Every chip design is a three-way trade-off between how fast it runs, how much power it consumes, and how much silicon area it occupies. EDA tools run thousands of automated iterations to find the optimal balance across these dimensions for a given process node. A 5% improvement in area means 5% more chips per wafer and millions in manufacturing savings at scale. A 10% reduction in power determines whether a mobile SoC fits within its thermal envelope. PPA optimization is the core technical value proposition of EDA.
Manage complexity that exceeds human capacity. A modern flagship chip contains 50 to 200 billion transistors, and more in multi-die packages. At 3nm, foundries impose 25,000+ design rules, each representing a manufacturing constraint that must be satisfied simultaneously. The number of process-voltage-temperature corners requiring signoff has grown from 5-7 at 28nm to 20-30+ at 3nm. Manual design stopped being possible at 65nm, and automated optimization is the only path to functional silicon at leading-edge nodes.
Prevent silicon failure. A single respin at leading-edge nodes costs $50-100M and delays the product 6-12 months. Proving correctness before committing to a $40M mask set is the highest-ROI activity in the design cycle.
Who Buys EDA Tools
Seven categories of customers account for the ~$18B EDA+IP market.
Fabless chip designers (NVIDIA, Qualcomm, AMD, Broadcom, MediaTek) are the largest traditional segment, spending $80-150K per engineer annually on tools, IP, and verification. These companies design chips but own no fabs, making EDA their core technical infrastructure.
Systems companies now account for 45% of EDA demand according to Cadence. This is the fastest-growing and most consequential category. Hyperscalers (Google, Amazon, Microsoft, Meta) each run multiple custom silicon programs with full EDA tool stacks at advanced nodes. Apple employs 8,000+ chip designers across the M-series, A-series, and modem programs. Tesla designs its own FSD and Dojo chips. Automotive OEMs and Tier-1s (Continental, Bosch, Denso) are entering chip design for the first time. These companies arrived as EDA customers within the last decade, and their spend is incremental to the traditional semiconductor R&D base.
IDMs (Intel, TI, Analog Devices, Infineon, STMicroelectronics) spend less per engineer ($40-80K) but run larger teams across both design and manufacturing. They negotiate enterprise-wide agreements covering thousands of seats and develop some internal IP, reducing external licensing costs.
Memory companies (Samsung, SK Hynix, Micron, Kioxia) use specialized tools for DRAM, NAND, and HBM design. HBM verification now approaches logic-chip complexity as stacking and interposer routing requirements grow with each generation.
Foundries (TSMC, Samsung Foundry, Intel Foundry, GlobalFoundries, Rapidus) are both customers and partners. They co-develop PDKs with EDA vendors 24 months before production and specify which tools their customers must use for tape-out, effectively mandating specific signoff software for the entire ecosystem.
Turnkey ASIC design houses (Broadcom ASIC Group, Marvell Custom Silicon, Alchip, GUC) are among the largest per-customer EDA spenders. They hold EDA licenses on behalf of hyperscaler clients and run multiple concurrent tape-outs at advanced nodes. Broadcom’s ASIC group alone is estimated to spend $200-500M annually on all-in EDA tool, IP licensing, and emulation hardware.
IP companies (ARM, Rambus, Alphawave) license EDA tools to design IP blocks that ship inside other companies’ chips. Their per-engineer spend is lower because they design once and license repeatedly.
What Drives EDA Revenue Growth
Four structural forces push EDA revenue above semiconductor R&D growth rates.
Node transitions. Each new process node adds design rules, verification corners, and tool requirements. 3nm tools cost 3-5x more than 28nm tools, and customers pay because they have no alternative path to leading-edge silicon.
Verification intensity. Proving chips work before manufacturing consumes 60-70% of design time and grows 15%+ annually. Hardware emulation alone is a $1.5B+ market. Every new protocol (PCIe Gen6, HBM4, UCIe) adds verification surface area that compounds on existing workloads.
AI accelerator proliferation. Hyperscaler custom silicon created $15B-$20B in new chip design activity that barely existed five years ago. Google TPU, Amazon Trainium, Microsoft Maia, Meta MTIA, each requires a full EDA tool stack at advanced nodes, incremental to traditional R&D budgets.
Pricing power from lock-in. 95%+ customer retention combined with 3-7% annual contractual escalators means EDA vendors grow revenue from existing customers every year without adding seats. $10M ELAs signed in 2020 renew at $12-14M in 2025 without adding engineers.
The divergence started in 2018. Before that, EDA revenue tracked fab R&D spend 1:1. Hyperscaler AI chip development, emulation hardware economics, and advanced node verification costs all grew faster than design complexity, pulling EDA revenue above R&D trendlines. With Synopsys’s $35B Ansys acquisition, the addressable market expands to $31 billion ($18B EDA+IP + $10B simulation + $3B systems software), meaning the oligopoly just absorbed its only adjacent market.

Source: SemiAnalysis, Company Reports
Synopsys and Cadence revenue (2012-2025). Synopsys: $1.76B to $7.05B (~11% CAGR). Cadence: $1.15B to $5.30B (~12% CAGR). Thirteen years of unbroken growth through every cycle.
What EDA Tools Actually Do: RTL to Silicon in 12-24 Months
EDA tools transform abstract hardware descriptions into manufacturable silicon through a sequential pipeline. Engineers write RTL code (Verilog or VHDL), which synthesis tools (Synopsys Design Compiler, 84-85% share) map onto foundry-optimized standard cells. Place and Route (Synopsys Fusion Compiler or Cadence Innovus) positions gates and routes billions of wires through dozens of iterations over 2-3 months.
Signoff analysis (Synopsys PrimeTime 90%+ share, StarRC, Redhawk) validates timing, parasitics, and power integrity across all PVT corners. Physical verification (Siemens Calibre, 85%+ share) checks DRC against foundry rules and LVS to confirm layout matches the circuit. Foundries mandate these signoff and verification tools for tape-out, as detailed in the competitive moat section. Tape-out delivers GDSII files to the foundry.

Source: SemiAnalysis, Company Reports
Chip design pipeline from RTL to tape-out. Each stage feeds the next; changing one tool re-runs all downstream steps. 12-24 months for 7nm/5nm/3nm.
Verification is where the majority of design time and budget goes, as described in the growth drivers section above. Functional simulation (Synopsys VCS 45-50% share, Cadence Xcelium 40-45%) runs billions of test vectors. Hardware emulation (Cadence Palladium 55-60% share, Synopsys ZeBu 35-40%) maps designs onto physical hardware for full-SoC validation, and a flagship AI chip requires 6-12 months of continuous emulation. The sequential dependency matters more than any individual tool’s merits. Change your synthesis tool and you must re-run place-and-route, signoff, and physical verification. The flow itself is the lock-in.

Source: SemiAnalysis, Company Reports
Design time breakdown. Verification: 65% (8-15 months). Implementation: 30% (4-7 months). Physical verification: 5%. A 7nm chip requires 10-50X more verification compute than a 28nm chip of equivalent gate count.
The EDA Market: Sizing, Share, and Structure
Total Market: $18B (2025), growing to $28-30B by 2030
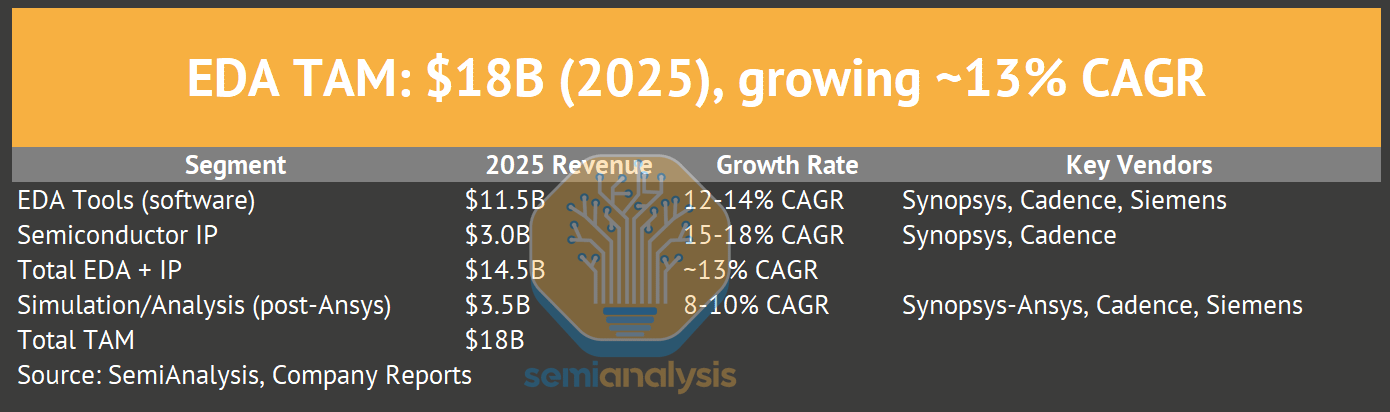
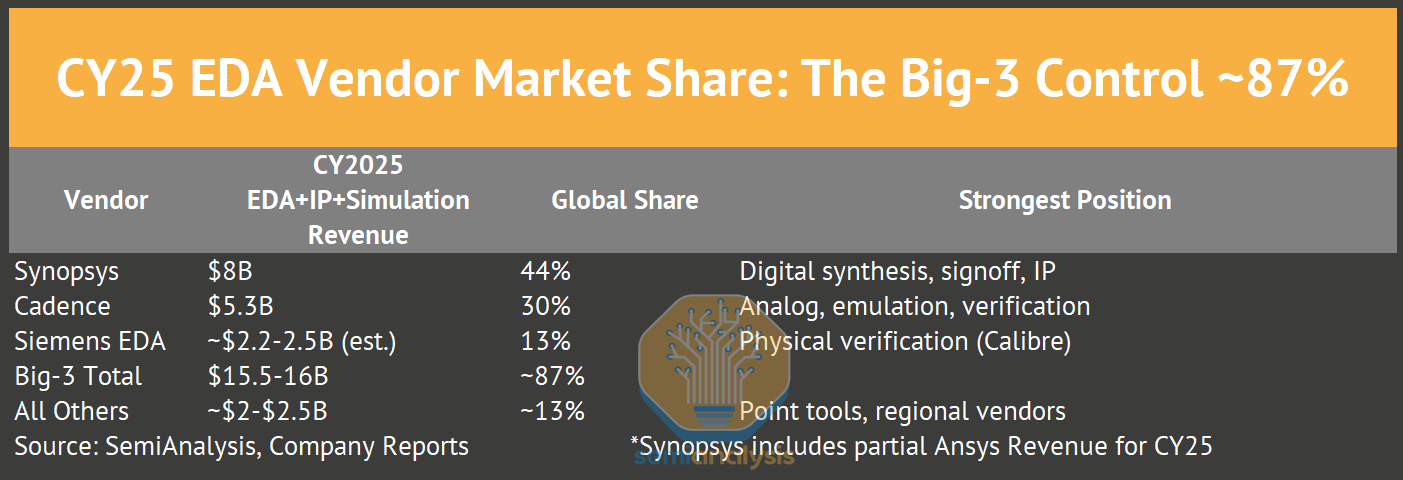
The remaining 10-15% is fragmented across dozens of vendors, with Ansys pre-Synopsys), Keysight ($1.5B, partially overlapping), and Zuken ($500M, PCB/IC packaging) as the largest independents. No vendor outside the Big-3 holds more than 5% in any core EDA category.
Renesas acquired Altium ($5.9B, 2024) to use Altium’s PCB design software for promoting its component portfolio and BoM optimization. Altium generates $280M in annual revenue from PCB design, placing it among the larger independent EDA players in that specific category.
Tool-Level Market Share (Advanced Nodes, 7nm and Below)
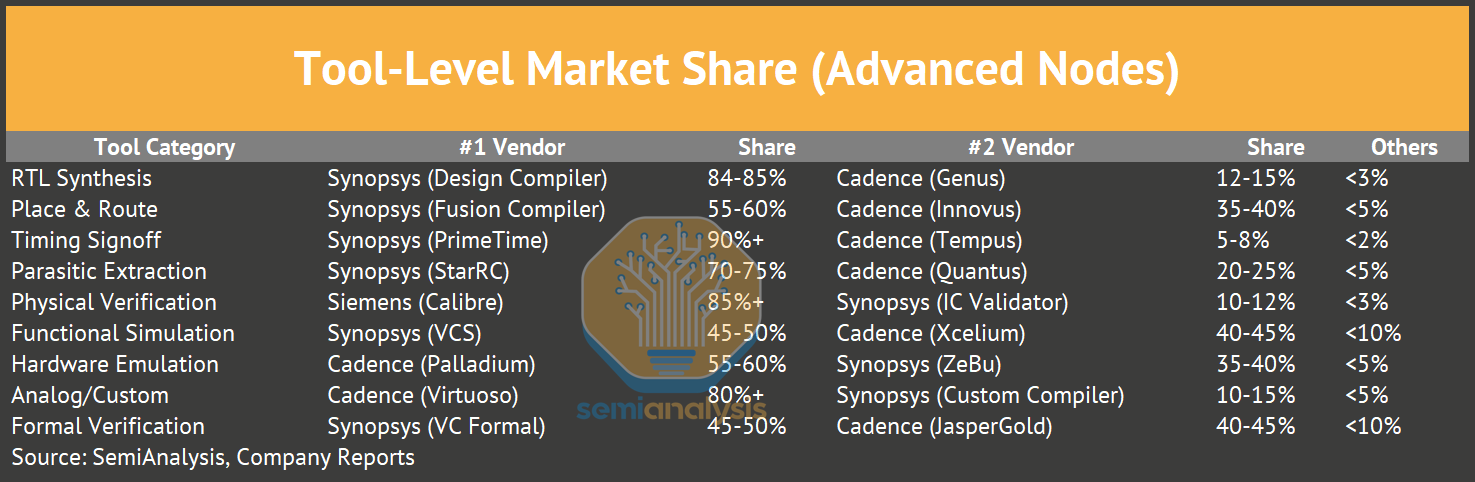
These shares have been roughly stable for a decade. The only category with meaningful movement is Place & Route, where Cadence Innovus gained 10-15pp against Synopsys ICC2 (IC Compiler II, Synopsys’s flagship place-and-route tool) between 2015-2020, then stabilized as Synopsys launched Fusion Compiler. Everything else is locked.

Source: SemiAnalysis, Company Reports
SNPS+CDNS combined market share trending upward as complexity drives consolidation toward the two largest vendors.
How EDA Licensing Actually Works: Seats, Tokens, Hardware, and the Renewal Machine
EDA pricing is opaque by design. Vendors don’t publish price lists, and every deal is negotiated individually.
Model 1: Seat-Based Licenses (Traditional)
One license equals one engineer running one tool at a time, and seat-based pricing is still used for small customers and specific tools.
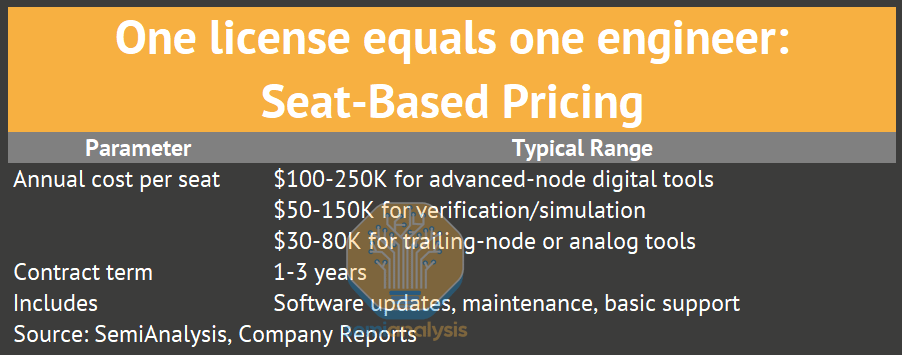
Seat-based pricing scales linearly with headcount, which is simple but limits vendor upside to headcount growth alone.
Model 2: Token/Capacity-Based Licenses (Modern)
Tokens decouple licensing from individual seats. A customer buys a pool of compute capacity, any engineer can use any tool drawing from the shared pool, and peak usage gets throttled or billed at overage rates.
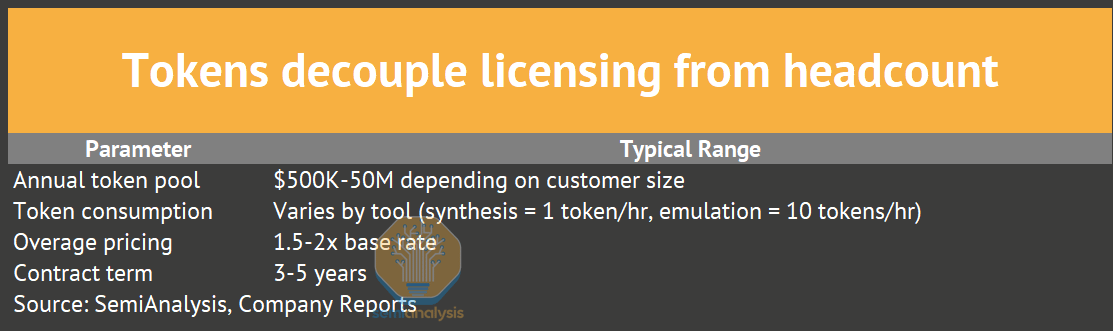
Token licensing is the growth model for EDA vendors, and four dynamics explain why.
Higher total spend - Customers buy tokens expecting peak usage, but average utilization runs 60-70%. The 30-40% slack is pure vendor upside.
Usage expansion is frictionless - No procurement approval to add seats. Engineers just use more tokens, and finance sees the bill quarterly.
AI tools consume tokens fast - Synopsys DSO.ai and Cadence Cerebrus run hundreds of automated design iterations, each burning tokens. AI features can 3-5x token consumption per design project.
Cloud amplifies consumption - Cloud EDA (Synopsys on AWS, Cadence on Azure) meters by compute-hour. Burst workloads during tape-out crunch generate spikes that seat licenses would never capture.
The shift from seats to tokens is the most important pricing dynamic in EDA. Synopsys stated at its 2024 Investor Day that AI-enhanced tool renewals generate ~20% revenue uplift over baseline contract values. That uplift comes from token consumption growth while headcount stayed flat.
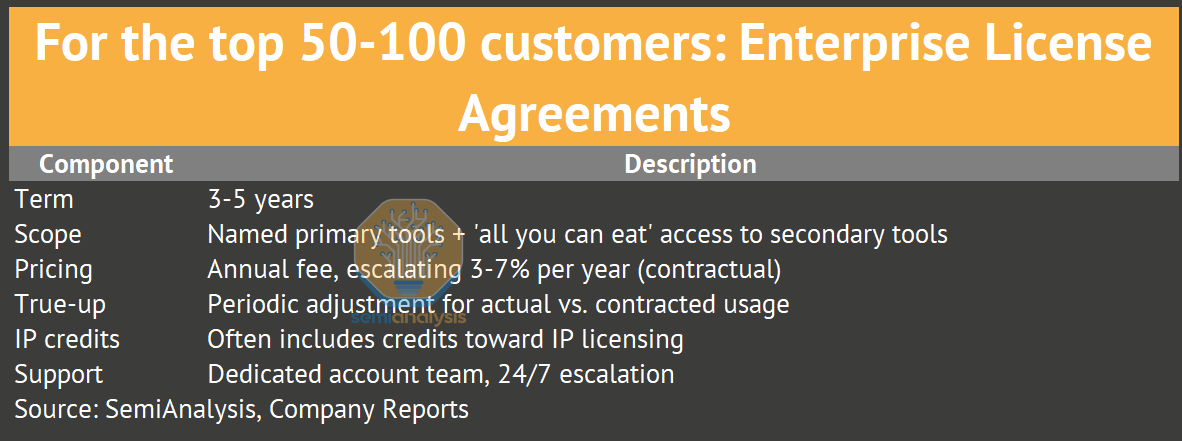
Model 3: Enterprise License Agreements (ELAs)
For the top 50-100 customers, the actual unit of sale is the ELA, a multi-year contract bundling broad portfolio access.
These licensing structures are reconstructed from vendor disclosures, customer interviews, and quarterly earnings call commentary, as neither Synopsys nor Cadence publishes pricing details.
ELAs create four dynamics that entrench the oligopoly.
Bundling power - Free access to secondary tools eliminates incentive to evaluate competitors. If synthesis, P&R, and signoff are in the Synopsys ELA, there is no reason to evaluate Cadence Genus.
Usage opacity - Finance sees one annual payment, making per-tool ROI analysis impossible. Nobody knows what synthesis “costs” inside a $50M ELA.
Switching cost amplification - Leaving an ELA means disaggregating a bundle and re-negotiating 20+ individual tools. The administrative burden alone discourages it.
Information asymmetry - Vendors track detailed per-tool, per-engineer usage data while customers usually don’t. The vendor knows exactly which tools are critical, and the customer’s procurement team doesn’t.
ARM uses a similar model with its Flexible Access program, offering customers all-you-can-evaluate access to the full ARM IP portfolio for an annual fee, with per-chip royalties only triggered at production. This model has been adopted by 70%+ of ARM’s new license agreements since 2019.
Hardware Licensing: Emulation Is a Different Business
Emulation hardware (Cadence Palladium, Synopsys ZeBu) follows capital equipment economics, with physical systems that have depreciation schedules, installation teams, and cooling requirements.
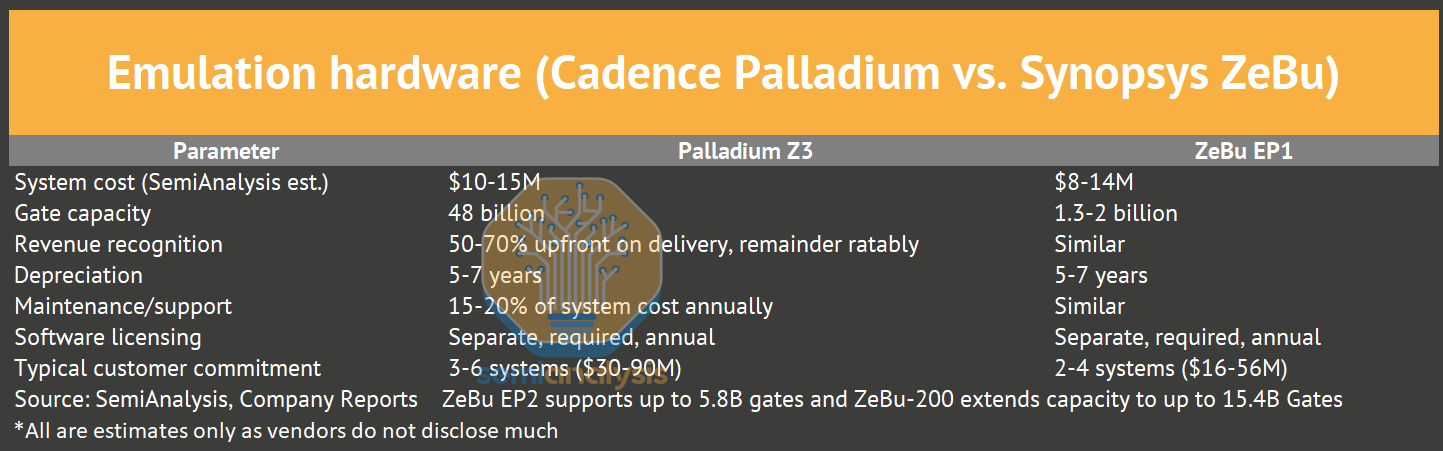
Once a customer installs $50M of Palladium systems, four forces lock them in for the life of the hardware. Testbenches written to Palladium APIs run millions of lines. Engineers specialize in Palladium-specific debug workflows. The 5-7 year depreciation schedule creates a financial commitment. And $3-5M annual software/maintenance fees per system reinforce the vendor relationship. Every Palladium system pulls $2-3M in annual software licensing on top of the hardware investment.
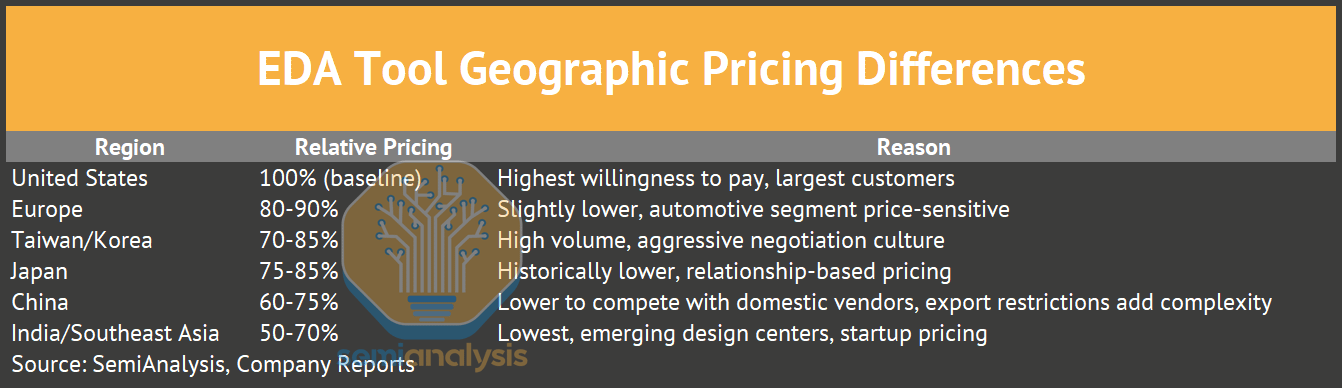
Geographic Pricing Differences
What Happens When Customers Merge: The EDA Licensing Windfall (and Risk)
Scenario 1: Same primary vendor (e.g., both use Synopsys)
The combined entity has two ELAs that get consolidated at renewal. The larger company negotiates better per-seat pricing through volume discounts, and total spend usually declines 10-20% from the sum of the two standalone agreements. This outcome is bad for the EDA vendor in the short term.
Scenario 2: Different primary vendors (e.g., acquirer uses Synopsys, target uses Cadence)
The acquirer standardizes on its preferred platform, the target’s engineers get retrained, and the losing vendor’s contract gets run off over 2-3 years because teams can’t switch mid-project. The winning vendor gains seats, the losing vendor loses them, and total spend stays roughly flat.
Scenario 3: The transition creates evaluation opportunity
When AMD acquired Xilinx ($49B, 2022), the combined entity had overlapping EDA agreements and the merger forced rationalization. Both Synopsys and Cadence competed aggressively for the combined contract, and the result was that the winning vendor got a larger deal at compressed margins from competitive pricing to win the consolidation.
Recent examples:
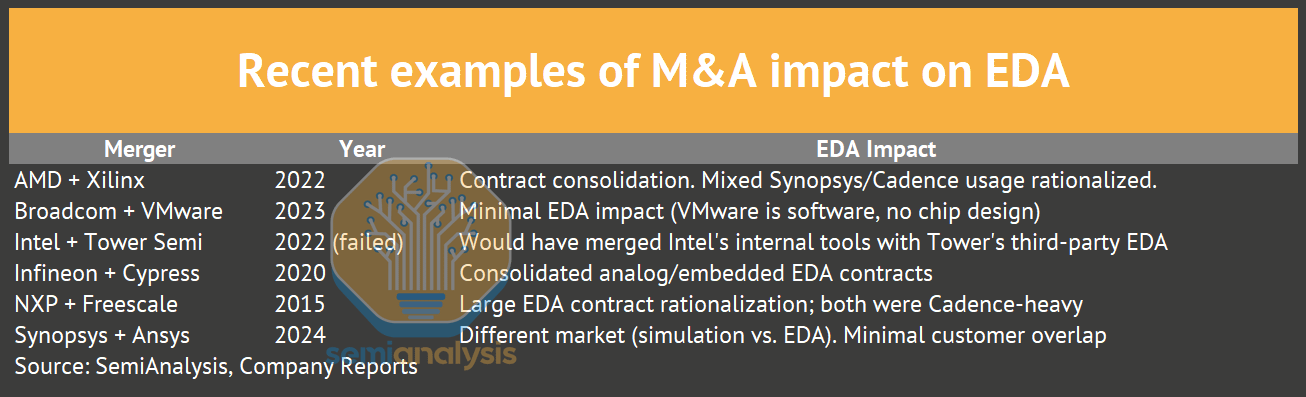
The net effect of semiconductor consolidation on EDA revenue is slightly negative, since fewer independent customers means fewer separate ELAs. But the surviving entities are larger, design more complex chips, and spend more per engineer. Historically, the complexity growth has more than offset the consolidation discount.
What Drives Revenue Growth Beyond Adding Seats
EDA revenue grows at 12-15% CAGR while global semiconductor design headcount grows at 3-5%. The delta comes from six sources.
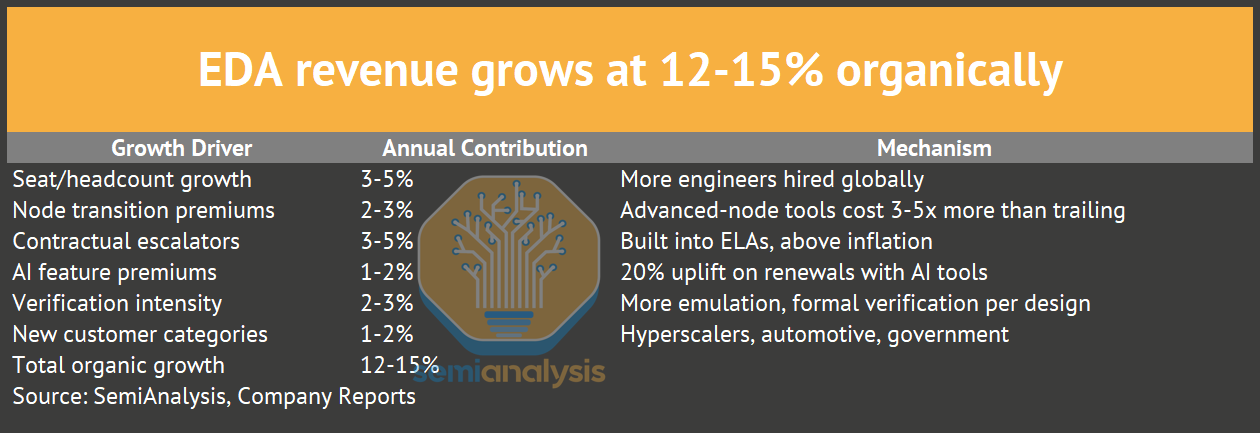
This breakdown explains a critical point. EDA vendors are selling genuinely new capabilities at each node transition - multi-patterning aware routing at 7nm, backside power delivery at 2nm, 3D-IC integration at advanced packaging nodes. Customers get new functionality and also pay more for it. The pricing is justified at the tool level, but the monopoly dynamics determine how much of the value the vendor captures versus the customer.
Do Customers Pay for Updates?
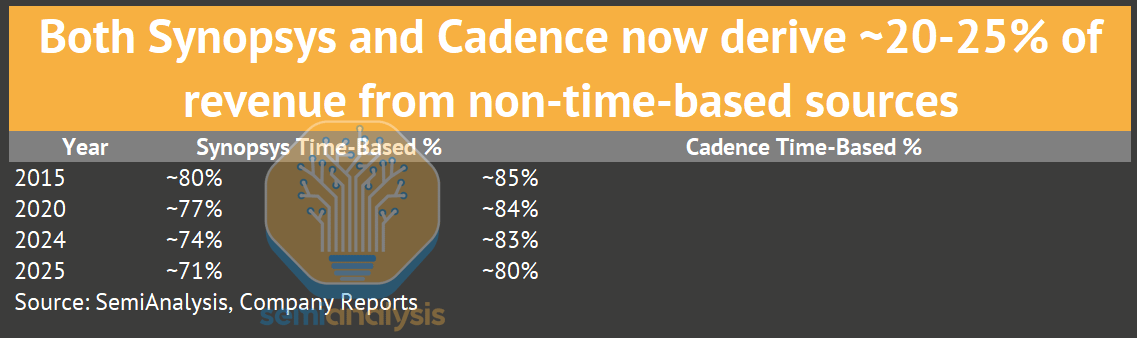
Under the old perpetual model, customers paid 15-20% annual maintenance for updates, and they could skip updates and coast on old versions (many did during downturns). Under the current time-based model, updates are included in the annual fee with no separate charge. Customers always run the latest version, and stopping payment means losing access entirely. This is why the perpetual-to-TBL transition was so important for vendors, because it eliminated the “maintenance holiday” that customers used during downturns.
Both Synopsys and Cadence now generate 70-83% of revenue from time-based/subscription arrangements, with the remainder from upfront hardware deliveries, IP milestones, and perpetual licenses. The upfront share has actually grown in recent years as emulation hardware sales expanded. The transition from perpetual to time-based took a decade (roughly 2005-2015) and permanently improved business quality.
The Renewal Machine
EDA revenue is a self-reinforcing renewal engine, and the renewal math is straightforward.
$11.4B Synopsys backlog / $7.05B annual revenue = 1.6 years of revenue already booked (FY2025)
$7.8B Cadence backlog / $5.30B annual revenue = 1.5 years already booked (FY2025)
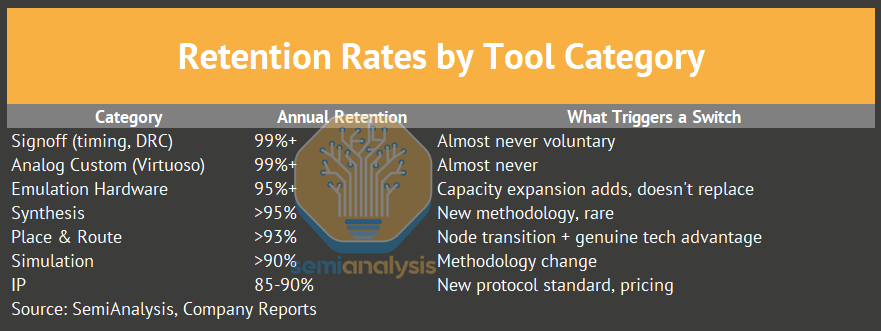
Customer retention: 95%+ annually for core tools, 99%+ for signoff and analog
Contractual escalators: 3-7% per year
Renewal uplift from AI tools: ~20% on top of escalators
A customer who signed a $10M/year ELA (Enterprise License Agreement) in 2020 renews at $12-14M in 2025, driven by contractual escalators, AI premiums, and verification expansion. A customer renewing a $10M ELA in 2025 pays $12-14M for the same headcount but upgraded tools, AI features, and expanded verification capacity. Management frames it as value creation while procurement teams see annual inflation, and both are correct.

Source: SemiAnalysis, Company Reports
EDA pricing power index. Contractual escalators, AI premiums, and verification expansion compound on a captive base.
Competitive Pricing Dynamics
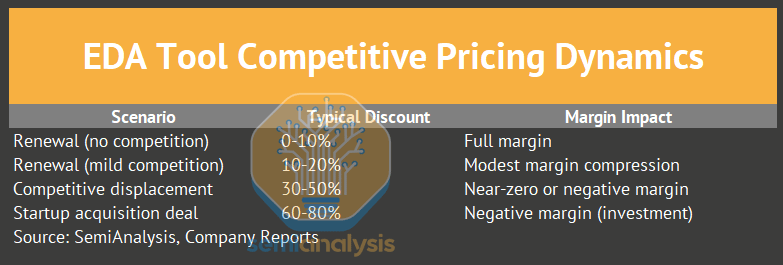
Most EDA competitive evaluations serve as negotiating leverage rather than genuine switching attempts. The typical pattern is that a customer announces an evaluation, the incumbent responds with a 15-25% discount offer, and the customer accepts without completing the evaluation. Sales teams at both Synopsys and Cadence have learned to distinguish real evaluations, where the customer allocates a dedicated engineering team and provides actual design data, from pricing negotiations disguised as technical assessments.
Retention Rates by Tool Category
Synopsys: The $35B Platform Bet
“Fusion Compiler is the embodiment of what happens when you break down the walls between synthesis, place and route, and signoff. That unified data model is what gives us structural advantage. Competitors can bolt tools together, but they can’t replicate a unified architecture.” - Sassine Ghazi, President & CEO, Synopsys Investor Day 2024
Synopsys’s strategy is platform maximalism, owning every tool in the design flow, cross-selling IP, and expanding into adjacent simulation domains. The $35B Ansys acquisition (completed July 2025) extends this logic from chip design into system-level simulation covering thermal, structural, electromagnetic, and CFD (computational fluid dynamics, for cooling analysis) analysis.
Modern chips don’t exist in isolation. A 700W datacenter GPU must dissipate heat through complex cooling, and an automotive SoC must meet EMC (electromagnetic compatibility) requirements on a vibrating engine block. Traditional EDA stops at the package boundary. The Synopsys-Ansys combination creates a device-to-system simulation stack covering TCAD (Technology Computer-Aided Design, for device physics simulation) for device physics, EDA for chip design, Ansys for package thermal, system EMC, CFD, and structural stress. No competitor offers this breadth.
The synergy math (from the 2024 Investor Day) projects $400M run-rate cost synergies by year 3 and $400M run-rate revenue synergies by year 4, with long-term revenue synergies of $1B+ annually. At the Morgan Stanley TMT Conference in March 2026, Ghazi indicated synergy realization is tracking ahead of the original plan. Combined company targets include non-GAAP operating margins in the mid-40s%, unlevered free cash flow margins in the mid-30s%, and high-teens EPS growth. Ansys adds end-market diversification at 31% semiconductor/high-tech, 22% aerospace, and 18% automotive.
Risks include integration complexity (different customers, sales motions, cultures), leverage (~3.9x at close, targeting <2x within two years), valuation ($35B is 12x revenue), and management distraction from core EDA competition.
The Margin Staircase: From 14% to 37.3% (FY2006-FY2024)
This is the financial proof of deepening lock-in.
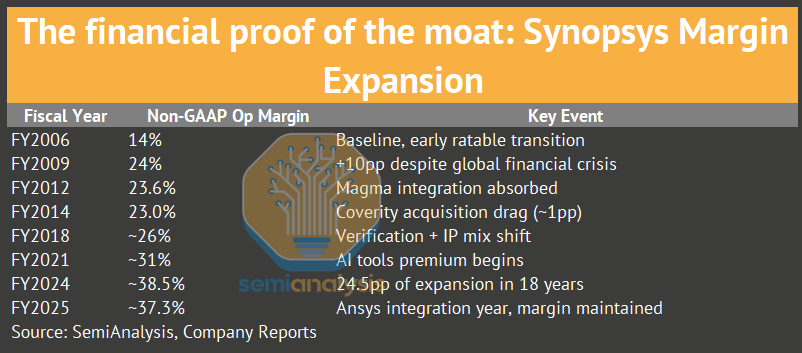
The pattern is consistent across two decades. Major acquisitions (Magma, Coverity, Black Duck) temporarily compress margins by 100-200bp, followed by systematic recovery. Management told analysts in 2011 that “If we see the opportunity to grow the top line a little bit more, we want to do that. If we see that, for whatever reason, the top-line growth is more difficult, we will immediately revert to a higher pressure on the operating margin.”
23pp of margin expansion came from four structural factors: (1) shift from perpetual to time-based licenses, (2) verification/IP mix shift toward higher-margin products, (3) AI tools commanding 15-25% premiums with minimal incremental cost, (4) platform cross-selling reducing customer acquisition costs.
The CEO Transition: Founder to Operator
Aart de Geus (CEO 1986-2023, now Executive Chair) handed the company to Sassine Ghazi (CEO from January 2024), and the tone shift is subtle but material.
De Geus spoke in vision statements. “I see our purpose to be a key catalyst enabling the smart everything world.”
Ghazi speaks in financial frameworks. “We position the company’s portfolio with one strategic end in mind, maximizing the value that we deliver to customers in the era of pervasive intelligence.”
Two major moves in Ghazi’s first year demonstrate the pivot. The Software Integrity Group was divested for $2.1B (“compelling investment opportunities in design automation and Design IP with much higher expected growth and return profiles”), and Ansys was acquired for $35B. The “tale of two markets” framework, distinguishing AI infrastructure customers from traditional semis, is distinctly Ghazi’s analytical approach, signaling operational rigor over visionary expansionism.

Source: SemiAnalysis, Company Reports
Synopsys acquisition timeline. The buy-over-build strategy accelerated with Ansys ($35B) in 2024.
The Backlog Fortress
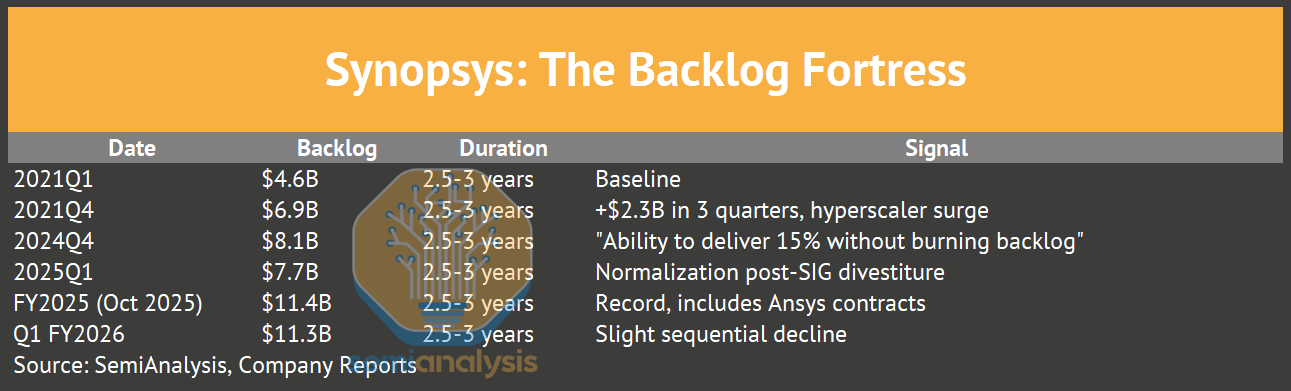
$11.3B in backlog provides extraordinary forward revenue visibility for a software company.

Source: SemiAnalysis, Company Reports
Synopsys vs Cadence backlog. $11.4B and $7.8B respectively (FY2025 year-end), providing 1.5-1.6 years of forward revenue visibility.
100% Advanced Node Market Share, Verified
The historical arc from quarterly earnings transcripts shows steady accumulation over more than a decade.
2013Q1: “Synopsys has been investing in FinFET enablement for half a decade, and we have at least 1 year head start.”
2014Q3: 150+ FinFET designs, >95% share
2016Q1: 286 active FinFET designs, 95% share. “100% of the 10nm and 7nm tape-outs completed thus far utilized Synopsys design tools.”
2019Q2: “100% market share at 12nm and below.”
2023Q1: 3nm. “roughly two-thirds of designs exclusively using Synopsys flows.” Still claimed 95% by design starts.
2025Q1: 2nm. “a U.S. hyperscaler tape out a 2-nanometer test chip exclusively using Synopsys design flow.”
The full design start data supporting these claims is presented in the competitive moat section below. The absence of post-2019 design start disclosures doesn’t signal share loss. The data became an antitrust liability, and the consistent revenue growth since then supports the same conclusion by different means.

Source: SemiAnalysis, Company Reports
Synopsys Revenue by Segment. IP revenue grew from $200M (2011) to $1.91B (2024), a 9.5x increase in 13 years. The IP business now represents 31% of FY2024 revenue pre-Ansys, dropping to ~25% of the larger FY2025 base.

Source: SemiAnalysis, Company Reports
Synopsys revenue by segment. IP revenue grew from $200M (2011) to $1.91B (2024), IP share fell from 31% (FY2024) to ~25% (FY2025) as Ansys revenue diluted the denominator.
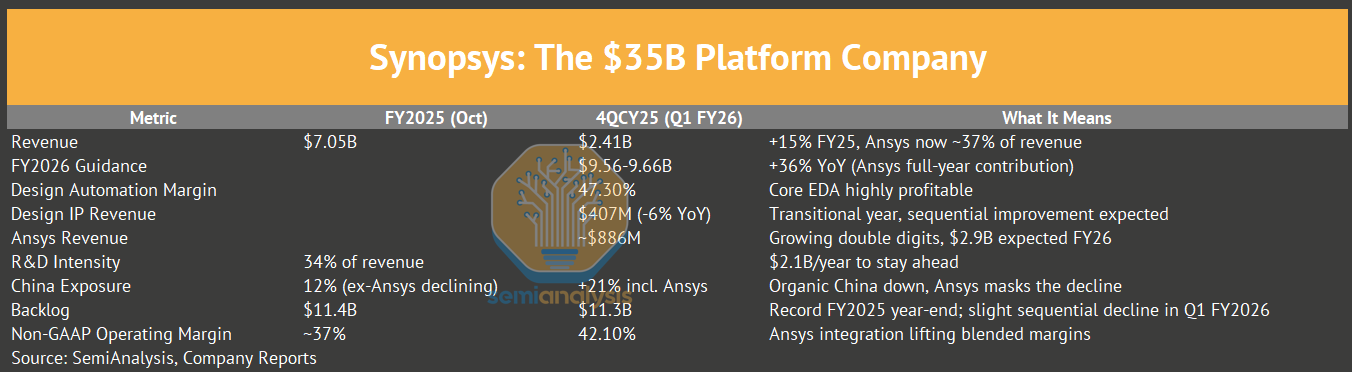
Near-Term Headwinds: The FY2026 Transition Year
Underneath the Ansys-inflated headline numbers, Synopsys’s organic business is decelerating. The Ansys merger masked a slowdown in the standalone EDA+IP business in FY25, with organic revenue growing only ~3% YoY ex-Ansys compared to 15% reported. In FY26, the same dynamic persists, with organic growth of roughly 7-8% ex-Ansys versus 36% reported. The gap between reported and organic growth rates is the widest it has ever been.
The primary drag is IP. Design IP revenue declined quarter-over-quarter for 3 of the 4 quarters in FY25, breaking from a historic 13% CAGR (FY20-FY24). Two specific gaps drove the decline. First, Intel moved the goalposts on its external foundry node. Synopsys built IP to baseline 18A, but Intel has pushed external customers to 18A-P (and beyond that, 14A), pushing out the ramp window Synopsys was sized for. Sassine confirmed the IP was available to the node they built it to, but with external 18A volume deferred to the 18A-P retune, third-party IP monetization was delayed. Second, the company had a coverage gap in HPC IP titles that it expects to fill in 2HFY26.
Management guided IP growth as “muted” (low-single-digit %) in FY26 with sequential improvement, far below the company’s mid-teens long-term IP target. The processor IP solutions business is being divested to GlobalFoundries, sharpening focus on interconnect and foundation IP but creating a near-term revenue air pocket. Design IP adjusted operating margin dropped to 16.2% in 4QCY25, well below the 30%+ margins IP generated at scale.
China compounded the organic weakness. Excluding Ansys, China revenue declined 22% in FY25 as export restrictions tightened and local EDA companies captured share at mature nodes. Management acknowledged directly that “the companies we cannot sell to are looking for alternatives, and these alternatives are typically local EDA or IP companies.” China exposure dropped from 16% of revenue in FY24 to 12% in FY25, and management expects further deceleration below corporate average growth in FY26.
Core EDA (ex-IP, ex-Ansys) grew 8% in FY25, below the company’s long-term double-digit targets. Management guided core EDA for only 9% growth in FY26. Hardware (ZeBu/HAPS) posted a record year driven by AI silicon demand, but this business remains well behind Cadence’s Palladium in both market share and revenue scale. Cadence is aiming to gain traction at Intel, historically a Synopsys stronghold.
Synopsys is attempting to restructure its IP business model from flat NRE-plus-usage charges to a model that includes royalties, responding to hyperscaler customers who increasingly demand custom IP. This model transition creates near-term revenue headwinds as legacy contracts roll off and royalty streams take time to build. The first joint Synopsys-Ansys physics solutions are expected in 1H26, which could drive pricing upside, but the integration risk remains real. The key catalysts to watch through FY26 are IP revenue stabilization by mid-year, evidence of the royalty-based IP model gaining traction with hyperscaler customers, and organic EDA growth re-accelerating toward the double-digit target.
Intel Customer Concentration: A Two-Decade Dependency
Intel has been Synopsys’s largest customer for over two decades. At peak concentration in FY2017, Intel represented 17.9% of total revenue ($363M on a much smaller revenue base). By FY2024, Intel’s share had moderated to 12.6% ($772M), reflecting Synopsys’s revenue diversification more than any reduction in Intel spending. In FY2025, for the first time in Synopsys’s history, no single customer exceeded 10% of revenue, though this milestone owes more to Ansys dilution expanding the denominator than to Intel spending declining.
Intel remains the single largest account. Cadence is now aiming to gain traction at Intel, a historically weak position for Cadence relative to its strength at TSMC and Samsung. Intel Foundry’s restructuring and leadership turnover have created evaluation opportunities across the EDA stack that did not previously exist. Every foundry transition opens a window for competitive re-evaluation, and Intel’s current transformation is the largest such window in a decade.

Source: SemiAnalysis, Company Reports
Synopsys Intel customer concentration over 20 years. Intel peaked at 17.9% of revenue in FY2017 and declined to below 10% in FY2025 as Ansys expanded the revenue base.
Cadence: From Near-Death to the Highest Margins
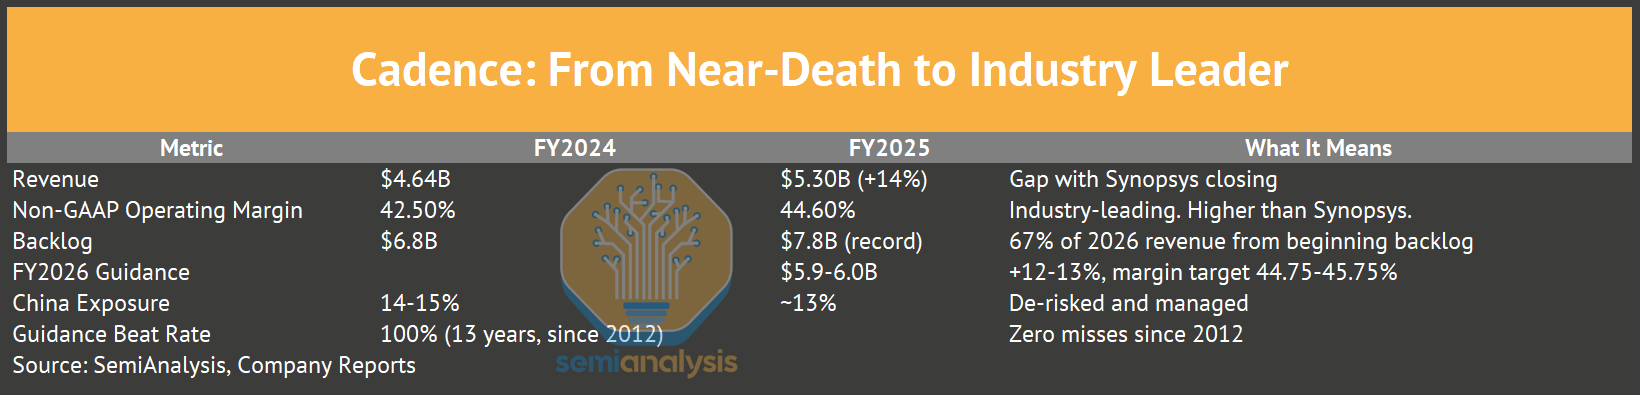
The IP segment is the growth engine. SDA growth includes the BETA CAE acquisition ($1.24B, Q2 2024), which brought structural analysis to top 10 global automakers and F1 teams. Hardware backlog entering 2026 is at record levels.
2026 Outlook: Implied Upside Across the Board
Record backlog of $7.8B (+11% q/q) covers 67% of FY26 revenue before a single new booking. Hardware is derisked with H2-weighted delivery schedules locked in. China is guided at 12-13% of revenue with H2 prudence baked in, the same conservative framing that proved overly cautious in FY25 when China grew above guidance. The Hexagon Design & Engineering acquisition (~$200M annualized revenue) is excluded from the $5.9-6.0B guide entirely. Incremental margins are guided at 51%, well below the 59% Cadence actually delivered in FY25. Every assumption embedded in guidance tilts conservative, creating multiple paths to upside.
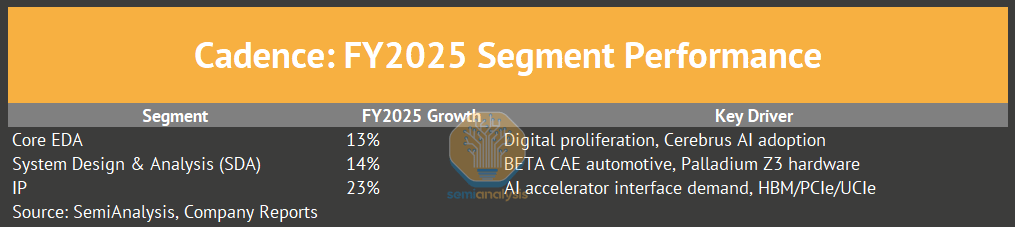
System companies now account for 45% of EDA demand at Cadence, up from 40% two years ago. A marquee hyperscaler adopted the Cadence digital full flow for its first full COT (Customer-Owned Tooling) AI chip tape-out, a milestone that validates Cadence’s digital competitiveness at the most demanding customers. Cadence added 25 new digital full flow logos in 2025, extending the trajectory from 10 wins per year in 2014 to consistent double-digit annual additions. The IP portfolio hit critical mass with HBM4, 224G SerDes, and LPDDR6 as key titles. IP revenue grew nearly 25% in 2025, now in its third consecutive year of strong growth. The multi-foundry dynamic across TSMC, Samsung, Intel, and Rapidus is a structural tailwind that Cadence is better positioned to capture than Synopsys, which has acknowledged FY26 IP will be a muted year.
Hardware posted another record year with 30+ new customers and substantially higher repeat demand from AI and hyperscaler programs. Seven of the top 10 hardware customers were Dynamic Duo (emulation + prototyping) customers, embedding Cadence across the verification workflow. Management stated they are taking share in all major product segments. CFO John Wall laid out the agentic AI monetization framework in three tiers. Subscriptions serve as the anchor revenue base, usage-based pricing captures AI-driven compute intensity, and a virtual engineer tier prices agents as additive headcount equivalent. Full monetization takes two contract renewal cycles, making this an FY27-28 revenue story, but the architecture is already in place.
The Hexagon Design & Engineering acquisition (~$200M annualized revenue) closed in February 2026, adding physical AI and automotive simulation capabilities that compete directly with Synopsys-Ansys in the systems simulation space. Cadence also expanded its TSMC collaboration for N2 and A16 process flows, deepened its partnership with Broadcom on agentic AI workflows, and formalized a new partnership with Rapidus, the Japanese government-backed foundry. Each foundry relationship adds IP porting revenue, tool certification fees, and long-term design ecosystem stickiness.

Source: SemiAnalysis, Company Reports
Cadence revenue by segment. SDA grew from $500M (2019) to $1.5B+ (2024), driven by Palladium hardware and BETA CAE.
The Near-Death Experience That Defines Everything
Under CEO Mike Fister (2004-2008), Cadence pursued aggressive adjacencies and attempted a hostile bid for Mentor Graphics, and the result was catastrophic.
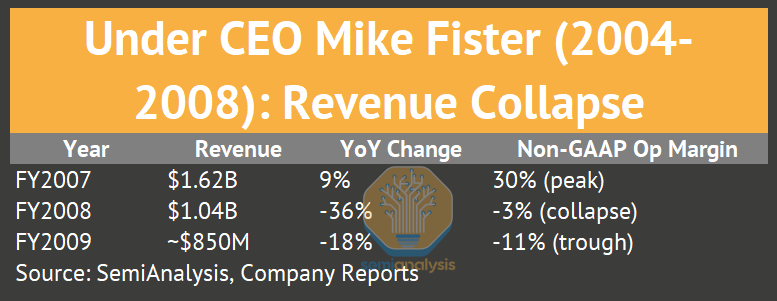
Revenue fell 36% in a single year, producing a GAAP loss of $6.57 per share and a $200M goodwill writedown.
The Lip-Bu Tan Turnaround (2009-2024)
Lip-Bu Tan became CEO in January 2009 at the absolute trough. In 2014 he summed it up on the earnings call. “From 2009 to 2013, revenue grew 71%. Non-GAAP operating margin expanded from near zero to 24%, and operating cash flow grew from just $26 million to $368 million.”
The margin staircase from -11% to 42.5% took 15 years.
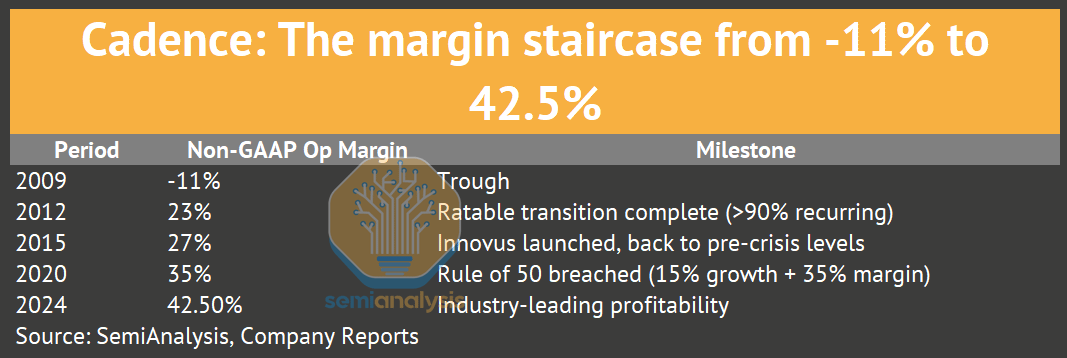
53pp of margin expansion in 15 years, powered by Tan’s operating rule that “50% of incremental revenue drops through to operating income.” Cadence achieved that target for 7+ consecutive years.
Virtuoso: The Tool No One Can Kill
Cadence owns analog design through Virtuoso, a tool with no credible competitor because analog methodology evolved inside Virtuoso over four decades. The tool embeds tribal knowledge about matching, noise, and linearity that can’t be replicated by writing better algorithms, because it requires decades of customer feedback layered into the product.
2008Q4: 45 customers in production, 70 tapeouts, ALL top 50 semiconductor companies using Virtuoso
2016Q3: 100+ customers at FinFET nodes
2024Q4: 450+ total customers, the largest analog customer base in the industry
2024Q1: Virtuoso Studio launched; 18 of top 20 semiconductor companies migrated within first year
450+ customers, and no major customer defection on record. The absence of competitive losses over decades of public earnings disclosures confirms what the market share numbers suggest.
Palladium: The 10-Year Hardware Lead
2007Q3: “Yet to have a competitive loss.” 100M gates shipped in upgrades in a single quarter.
2012: Palladium XP installed base 4x prior two generations combined
2014Q3: 15 of top 20 semiconductor companies, 9 of top 10 application processor companies
2020: Record year. 40% of hardware business from system companies (hyperscalers, automotive OEMs)
2024Q1: Palladium Z3 launched. 48 billion gate capacity, custom ASIC, liquid-cooled. Management said the “nearest competitor is Palladium Z2”
2024: Almost 200 repeat customers. 30 new logos.
2025: “Well over 1,000 AI-enabled tapeouts.” Cadence claims a “10-year lead in custom emulation silicon.”
200 repeat customers annually, with a custom ASIC architecture that creates a development moat requiring a competitor roughly a decade to cross.
The Digital Gap That Keeps Closing
2014: 10 digital full-flow wins per year
2015: Innovus launched. “10-20% PPA improvement, 10x turnaround time reduction.” ARM Cortex-A72 endorsement.
2019: 50 wins, a major inflection, 2x prior year
2022Q4: ALL top 20 semiconductor companies using Cadence digital software
2024: 36 new digital full-flow customers (17 in Q4 alone)
2025Q1: Core EDA revenue grew 16% YoY
From 10 wins in 2014 to 36 wins in a single year by 2024. Cadence never directly counters Synopsys’s “95% advanced node” claim, and instead cites TSMC Partner of the Year awards while letting the revenue numbers carry the argument.
Cerebrus AI: 1,000+ Tapeouts in 8 Quarters
2023Q1: 180 tapeouts
2024Q4: 750 tapeouts (300 in Q4 alone)
2025Q1: 1,000+ tapeouts. “Nearly 50 new logos in Q1.”
5.6x increase in under 2 years with 100% penetration of top 10 digital customers. Cadence focuses on proliferation first and pricing capture later through ACV growth.
Named customer results tell the technical story. MediaTek achieved 5% die area reduction and 6%+ power reduction. Renesas saw 75% improvement in total negative slack on advanced-node CPU. Samsung SARC got 4x productivity boost, and Samsung India (SSIR) achieved 8-11% PPA improvement. IBM is deploying Cadence AI-enabled digital implementation. The JedAI (Joint Enterprise Data and AI) Platform underneath Cerebrus aggregates waveforms, coverage reports, timing analyses, and physical layouts into a unified training data repository, creating a compounding data moat that makes Cadence’s AI tools improve with each deployment.

Source: SemiAnalysis, Company Reports
Cerebrus AI tapeout trajectory. 180 to 1,000+ in 8 quarters, with 100% penetration of top 10 digital customers.
CEO Transition and the Three-Horizon Strategy
Anirudh Devgan became CEO in December 2021 and reframed Cadence as a “computational software company” with three expansion horizons.
Horizon 1 (present - 3 years): Datacenter AI. Core EDA, IP, and emulation for AI accelerator designs, already the largest revenue driver.
Horizon 2 (3 - 7 years): Automotive and “Physical AI.” BETA CAE ($1.24B, Q2 2024) brought structural analysis serving top 10 global automakers and F1 teams. MSC Software ($3.25B, September 2025) added mechanical simulation. Combined with Cadence’s existing CFD capability (NUMECA, acquired 2021) and Pointwise (mesh generation, 2021), Cadence now has a full multi-physics stack for automotive. The acquisition sequence was deliberate, with small bets first (NUMECA $189M, Pointwise $31M) followed by scale when proven (BETA CAE $1.24B, MSC $3.25B).
Horizon 3 (5 - 10+ years): Life Sciences. OpenEye Scientific ($500M, September 2022) provides computational molecular modeling used by 19 of the top 20 global pharmaceutical companies. The thesis is that the same algorithms that optimize transistor placement can optimize molecular docking, with TAM estimated at $2B growing at ~15% CAGR. This is Devgan’s most non-consensus bet, and if it works, Cadence transcends the EDA category entirely.
When Lip-Bu Tan explored returning to the company in 2024, the board confirmed Devgan, and Lip-Bu departed to become CEO at Intel. The transition was unusually public, signaling governance strength and conviction in Devgan’s strategy.

Source: SemiAnalysis, Company Reports
Cadence acquisition timeline. NUMECA, Pointwise, OpenEye, BETA CAE, MSC Software - systematic expansion beyond core EDA.

Source: SemiAnalysis, Company Reports
The Margin Reversal. Cadence: from -11% (2009) to 42.5% (2024). Synopsys: from 14% (2006) to 37% (2024). Cadence is now the more profitable company despite being smaller. The turnaround story is one of the great comebacks in enterprise software.
The Blocking Position: Siemens EDA
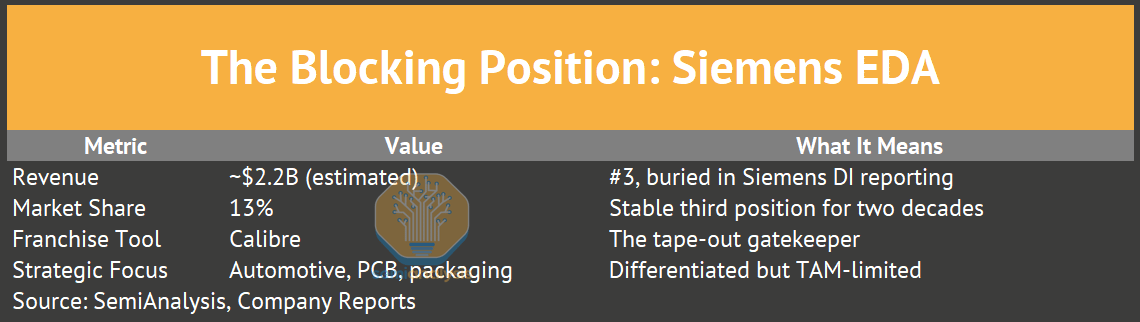
Calibre physical verification is the industry standard. TSMC specifies “Calibre-clean” DRC/LVS for tape-out, Samsung and Intel do the same, and this single tool ensures Siemens EDA’s permanent relevance in the market regardless of what happens in other tool categories.
How Mentor Became #3: The Release 8.0 Catastrophe
Mentor Graphics was the largest EDA vendor in the late 1980s with $380M revenue in 1989 and $44.8M net income. Then management attempted a complete ground-up rewrite of the entire software suite (”Release 8.0”), and it spiraled out of control. The project missed deadlines by years, and Cadence surged past Mentor in software revenue during the chaos. Mentor reported its first quarterly loss in April 1991, followed by a $61.6M annual loss and 15% workforce cuts. When Release 8.0 finally shipped in 1992, it was slow and riddled with bugs.
This is the canonical cautionary tale in EDA, and it explains three enduring realities. First, it explains why Mentor fell from #1 to #3 and never recovered. Second, it explains why all three Big-3 vendors acquire rather than build from scratch (Synopsys-Ansys, Cadence-BETA CAE, Siemens-Altair). Third, it explains why no startup can replicate an EDA platform by rewriting from zero. The codebase complexity defeats clean-sheet approaches every time.
CEO Wally Rhines (1993-2017) rebuilt Mentor through M&A instead, assembling Calibre, PCB tools, embedded software, and automotive electronics into a coherent portfolio. Activist pressure from Carl Icahn (2011) and Elliott Management (2016) eventually pushed Mentor toward a sale, and Siemens acquired it for $4.5B in 2017 before rebranding it as Siemens EDA in 2021.
The Siemens ownership is double-edged.
Advantages include cross-subsidization from an industrial conglomerate, bundling EDA with Teamcenter PLM and Opcenter MES, and the fact that Siemens supplies automotive OEMs while Siemens EDA serves the chip designers who supply those OEMs.
Disadvantages are real. EDA is <5% of Siemens revenue, there is no independent stock for acquisitions, reporting is opaque because it’s buried in Digital Industries Software, and investment competes against automation, healthcare, and energy priorities for parent company capital.
The Simulation Arms Race: Siemens Acquires Altair
All three Big-3 vendors simultaneously acquired simulation/CAE companies in 2024-2025 in a move-for-move escalation.
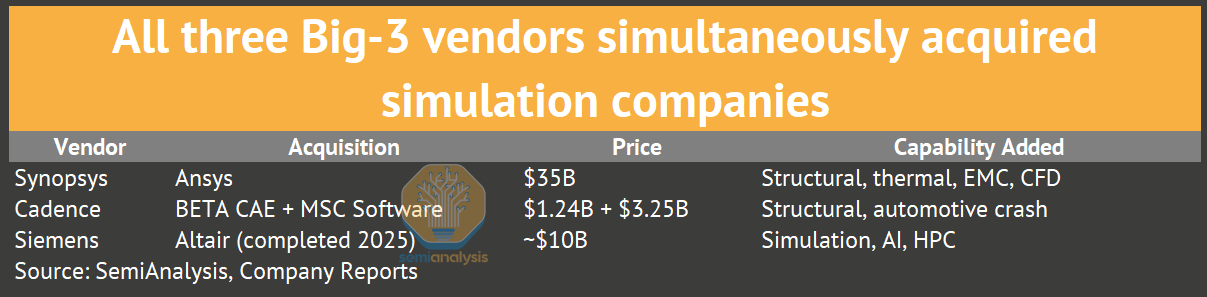
The EDA-CAE boundary is permanently dissolving, and Siemens’ Altair deal is the third leg of a three-way race to own the “silicon to systems” simulation stack.
Siemens AI Products: Catching Up
At DAC 2025, Siemens launched three AI product families: Aprisa AI for digital implementation, Calibre Vision AI for DRC violation clustering (cutting debug time in half), and Solido AI for custom/analog design. These target Siemens’ 85%+ Calibre installed base and represent the company’s first serious AI-driven push into domains that Synopsys and Cadence have led. A partnership with NVIDIA uses NIM microservices for EDA-specific AI inference.
PAVE360: The System-Level Digital Twin Play
Siemens’ differentiated response to chip-level competition is PAVE360, which provides full vehicle simulation, software-hardware co-verification, and production vehicle integration testing. Partnerships with AMD, Elektrobit, KPIT, TIER IV, and Qt create an end-to-end workflow from system requirements to production validation.
The TAM for system-level automotive verification sits adjacent to EDA ($800M-1.2B opportunity by 2030) but targets different buyers, specifically vehicle integration teams and Tier-1 suppliers. Siemens can capture this adjacent opportunity without directly competing for chip-level sockets against Synopsys and Cadence.
Q1 FY2026 Update (February 2026): EDA Outgrowing the Portfolio
Siemens’s Digital Industries software business grew 11% in Q1 FY2026, with EDA and simulation specifically driving healthy double-digit growth within that segment. The Altair integration is progressing well, and the NVIDIA partnership for chip design software continues to expand. PLM (excluding simulation) grew 7%, meaning EDA and simulation are outgrowing the broader Siemens software portfolio by a meaningful margin. This bifurcation matters because it signals that semiconductor design complexity and automotive simulation demand are pulling Siemens EDA faster than the industrial PLM base, reinforcing the strategic rationale behind both the Altair and Mentor acquisitions.

Source: SemiAnalysis, Company Reports
R&D Intensity: Synopsys at 34%, Cadence at 30%, Siemens EDA estimated at 25-28%. The spending gap explains the technology gap, but Siemens’s lower intensity reflects Calibre’s entrenched position requiring less R&D to defend.
In the full report, subscribers get access to competitive dynamics analysis (Cadence pulling ahead of Synopsys organically in 2026), the six-layer lock-in architecture with franchise tool and PDK moat evidence, design cost breakdowns for NVIDIA Blackwell and Apple Silicon, China vendor financials and export control forensics from earnings transcripts, our proprietary R-squared lock-in intensity matrix ranking 20+ fabless companies by EDA dependency, AI disruption risk assessment with CEO quotes from February 2026 earnings calls, and catalysts. All data is available in our interactive EDA Dashboard, updated quarterly.