

From Tokens to Burgers: A Water Footprint Face-Off
A different perspective on the datacenter water debate, forget tokens/watt or tokens/dollar, it's about tokens/burger, how many In-N-Outs is equivalent to the world's largest datacenter
Tokens and burgers are not two ideas you often see paired in the same title. If you’re wondering what they could possibly have in common, stick with us for this short piece, because today we’re putting them face to face in a duel over a hot topic - datacenter water usage. If you want a different perspective on what a datacenter actually consumes, plus a couple of new cool metrics to use in your Friday evenings (did you hear about tokens per burger?), stay tuned. This one’s a meaty post.
What the Numbers Overlook
Datacenter water usage is under increasing scrutiny, with projects even paused or canceled. See recent discussions in Arizona. We think the debate is overstated, as the numbers are often misleading and key variables are frequently ignored. By this we mean the cooling architecture (one of the main drivers of water usage), power source, location and local water scarcity or water source, among others. In addition, datacenter water consumption is often taken at face value and rarely put in perspective versus other everyday industries.
Besides, there’s no standard for water accounting, which makes comparisons messy. Do you include training runs and embedded supply-chain water, or only onsite evaporation and consumption? A lot of nuances that makes the “datacenters are choking the world” headline hard to assess.
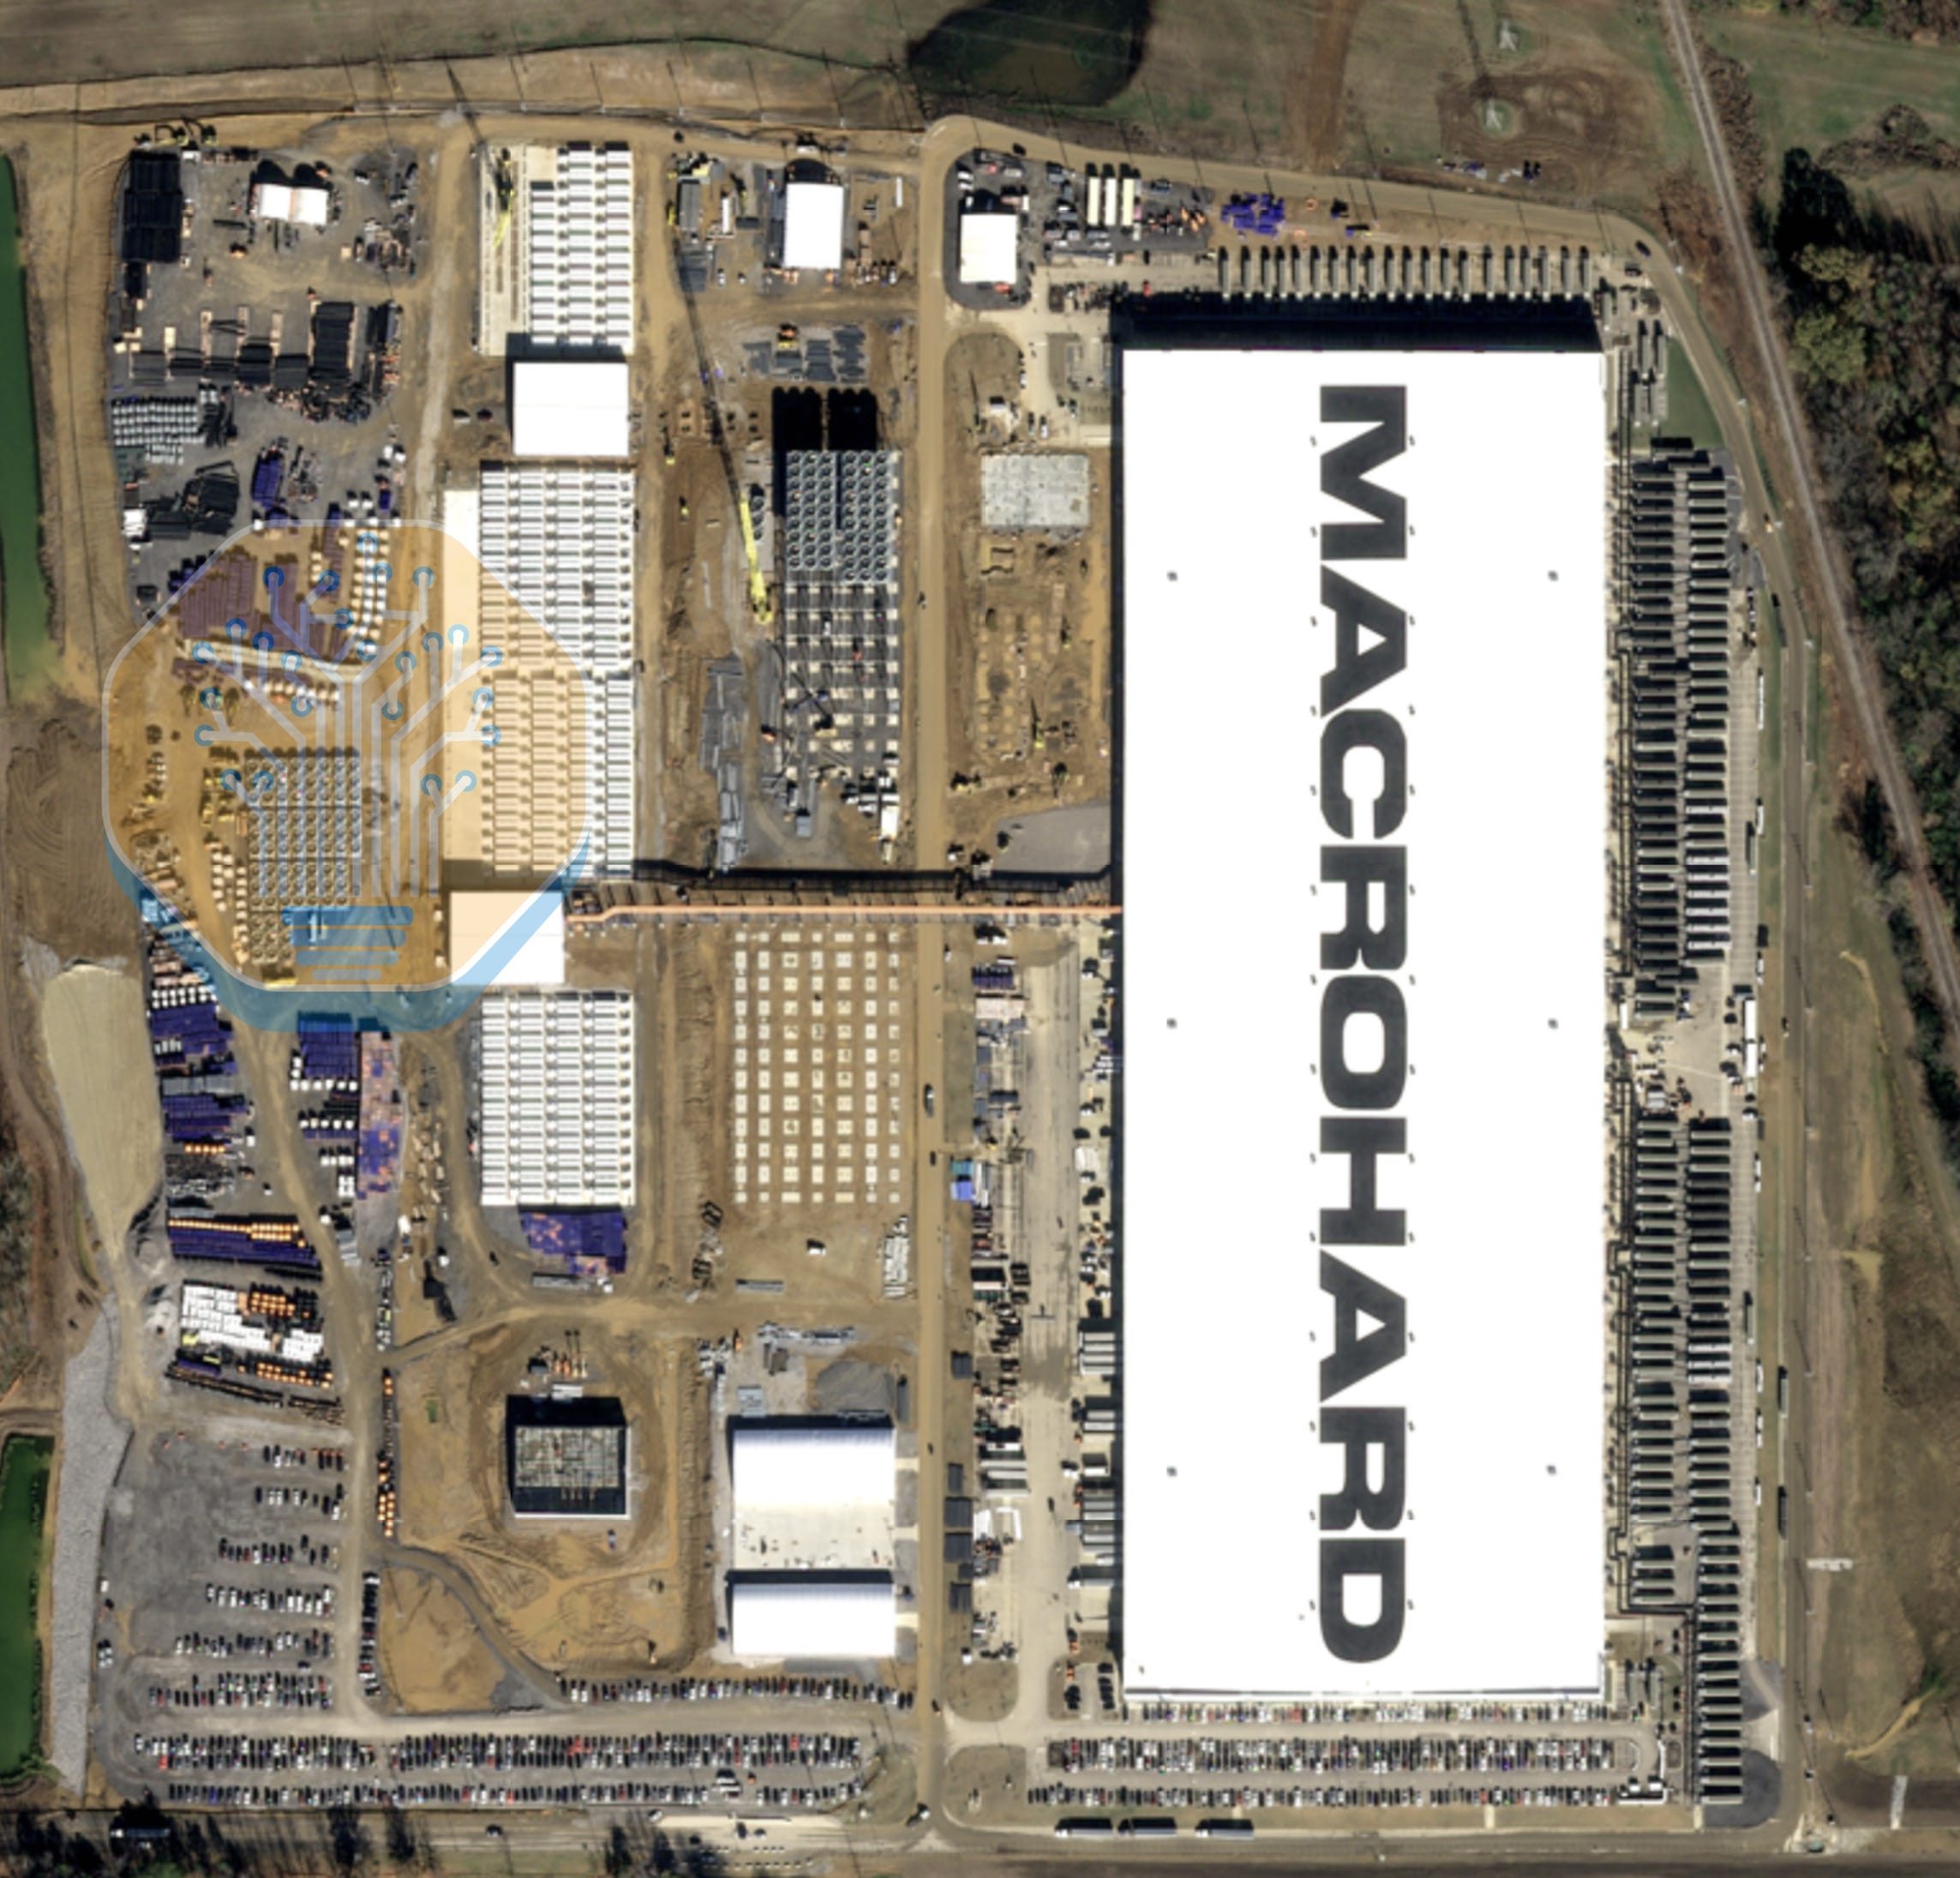
To contribute a different angle to the debate, we decided to put face to face one of the world’s biggest datacenters (want to know which place? Watch our latest Youtube video!) and one of the most loved elements in humanity, burgers. More specifically, we’ll calculate and compare the overall water footprint of Elon Musk’s Colossus 2 Memphis datacenter, the Macrohard one, and an average In-N-Out store. Does Macrohard’s beat an In-N-Out store? Let the duel begin.
Round 1: Colossus 2
Let’s start with Colossus 2, xAI’s datacenter that will power future generations of Grok. As we covered in our report on Colossus 2 and recent media posts, based on our satellite footage and the cooling equipment in the facility, the datacenter is in near term progress to get to a Critical IT Capacity of 400MW. Although it is expected to expand to more than 1GW, for now we’ll calculate the water footprint in its current state.
What can we expect initially? A quick search gives the first hints: “Colossus 2 could consume as much as 1 million gallons of water per day”. That sounds like a lot, but when you try to see how that figure is derived, you rarely get much detail. That’s why we decided to do run some numbers and see what we get.
Let’s first define what we mean by water footprint, and what we will consider in our calculation. When studying a datacenter’s overall water usage, we can consider both direct and indirect water footprint sources. More specifically, we will split water usage into direct (primarily cooling, initial loop fill and power generation) and indirect (water usage embedded in the supply chain, mainly chip manufacturing, although you could also consider construction water, etc.). For simplicity, we will focus on the three most materials components: cooling, power generation, and chip manufacturing.
You are all aware that chip power translates into heat that needs to be dissipated to guarantee good performance, and different cooling architectures can be used, as we’ve covered in previous articles. The most relevant point for our analysis here is the distinction between dry, wet and adiabatic cooling systems. Dry cooling is largely closed loop (there’s an irrelevant amount of tiny evaporation in the pipes) and uses little water beyond the initial fill. Wet cooling uses evaporation in open-loop systems and can consume significant water. A hybrid solution are adiabatic cooling systems, which use a controlled water mist to pre-cool intake air, improving heat rejection during hot conditions and using less water than 100% wet evaporative cooling.

What’s interesting about Colossus 2 is that it uses both dry and adiabatic cooling units. In a recent social media post, we indicated how the 400MW Critical IT capacity will be supported by a hybrid cooling system with around 130 dry coolers and around 135 adiabatic cooling units. Let’s see how this translates into gallons of water consumed.
Source: SemiAnalysis Datacenter Industry Model
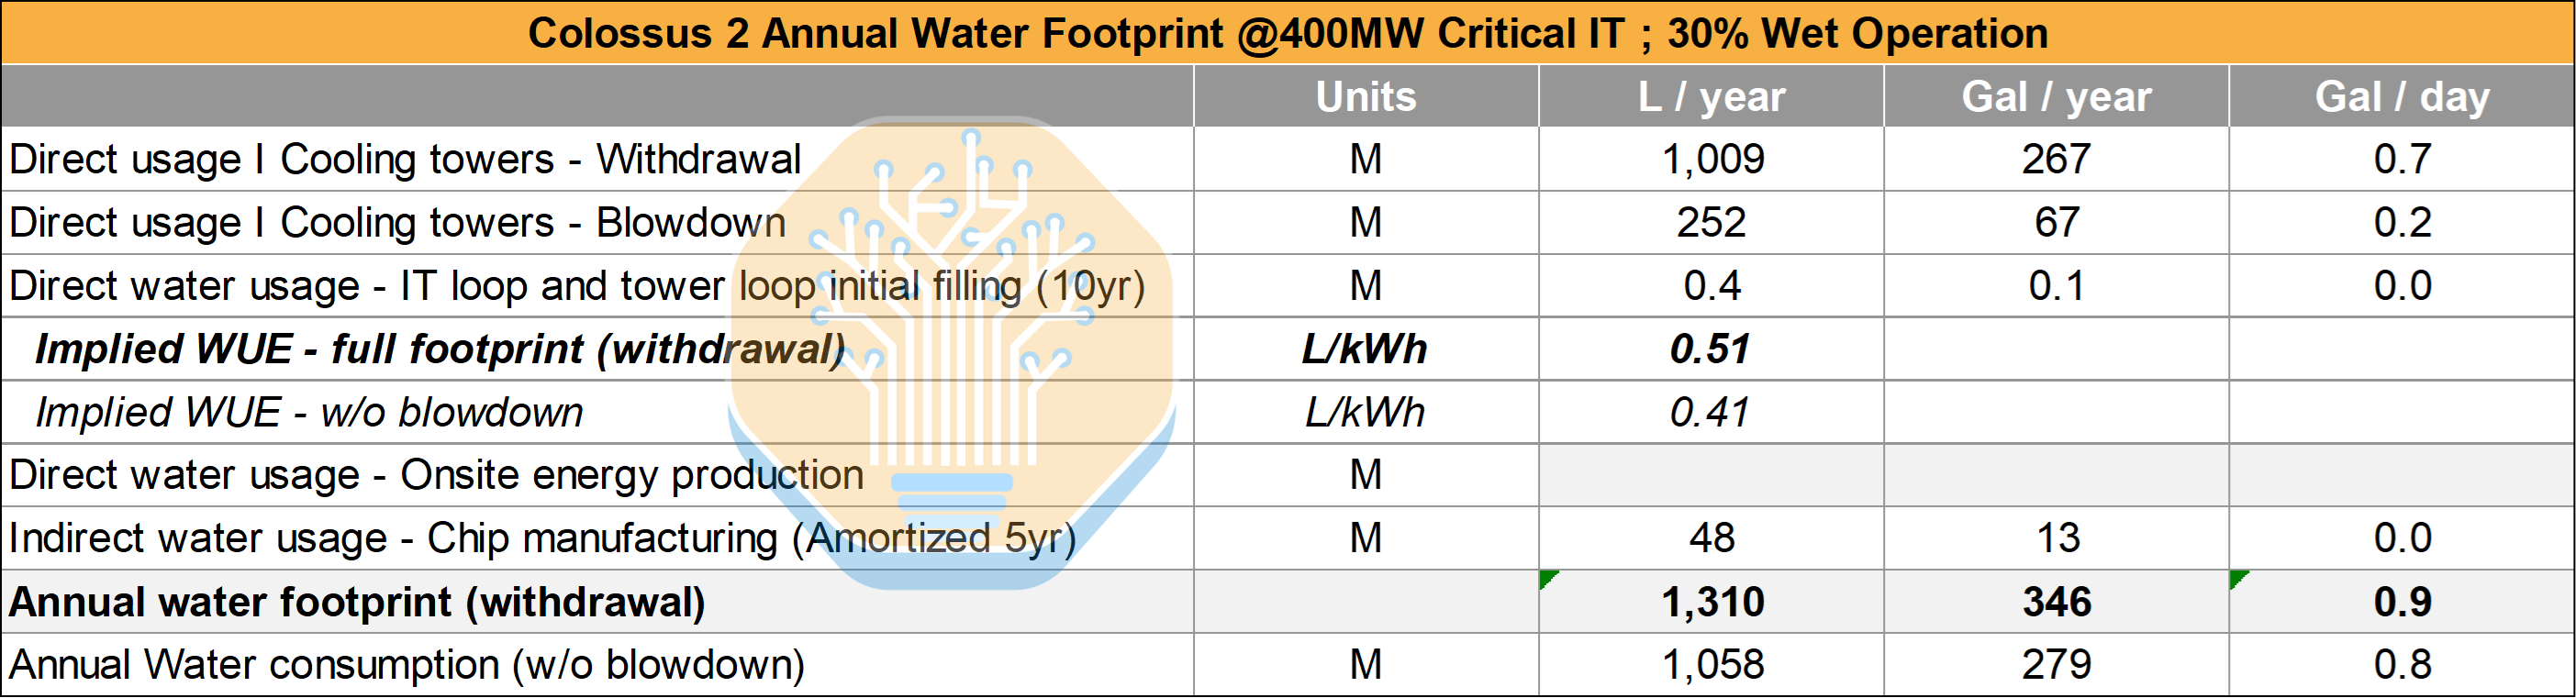
We will assume a Critical IT capacity of 400MW, a PUE of 1.15, and a utilization rate of 70%. This translates into 2.8 TWh of generated heat per year that must be rejected. Let’s also consider a wet operation time with adiabatic assist of 30%, given the cooling layout and Memphis climate, an evaporation rate of 0.45 gal/kWh and a adiabatic share of 70%, reflecting the heat that is actually handled via evaporation during adiabatic-assist operation. This leads to 267 million gallons of water evaporated during the cooling process in a year. Besides, tower-like blowdown cycles may be reduced or replaced by flush or discharge behavior depending on whether the adiabatic equipment is once-through (no basin) or recirculating. In our example we assume an additional flush rate of 25% of evaporation, which translates into 66 million gallons withdrawn - not evaporated or consumed - annually.
Note wet chillers are significantly more power efficient than dry which is why the US should strive to make sure all regulations allow and encourage wet chillers rather than dry.
Then we have water used during power generation. In the case of Colossus 2, the datacenter currently uses aeroderivative simple-cycle turbines from Solar Turbines with no steam or combined cycle, which means no water is consumed during the power generation process. The water profile could change if future CCGT turbines are included, but for now let’s keep the current layout.
An additional one-off direct water consumption source is the initial filling of the cooling loops, and although this is not very material, we will account for it in our numbers too. For the IT loop filling, we consider around 40 gallons per rack, a 2x ratio for the out/return of the pipes, and some buffer tanks. For the initial cooling tower fill, we consider the previous wet operation rates and a 10 minute fill inventory of the overall required flow.
Finally, we get to the water footprint embedded in the nucleus of every datacenter - the chips. During the chip manufacturing process, ultra-pure water (obtained after several water purification stages) is used for wafer cleaning and conditioning. To determine implied wafer count for Colossus, we will consider that 90% of the overall IT capacity is allocated to compute. Assuming all GB200 NVL72 equivalent racks with an energy consumption of 130kW/rack, we get 2,769 racks. For simplicity, we will focus on the GPUs, CPU, and HBM here - reaching ~200k GPUs/100k CPUs/1.6 million HBM3e stacks. To turn these into die numbers we’ll consider 300mm2 wafers, some die sizes and yield assumptions, and apply factor correction for edges, getting a total of more than 32k wafers used. At 1,800-2,200 gallons per wafer, that’s around 64 million gallons, which we amortize over 5 years.
Everything considered, we obtain an annual water footprint of 346 million gals/year (1,310 million liters/year) or 0.9 million gal/day, which is close to our initial expectations, and implies a WUE of 0.51L/kWh. Now that we have our first fighter in the ring, let’s leave the semiconductors for a moment and turn to the burgers.
Source: SemiAnalysis
Round 2: In-N-Out
Public estimates put burgers at ~650-700 gallons each (around 2,650 liters), but as we did with Colossus, we wanted to ran our own estimate.
First, let’s distinguish between green water, blue water, and grey water consumption. Put simply, green water means rainfall that gets absorbed by the soil, blue water is surface or groundwater that can be drinkable or usable in industry, and grey water is used water that may contain impurities. For our water footprint calculations, and to keep a fair apples-to-apples comparison with Colossus, we will stick only with blue water footprint levels.
Now we want to calculate the annual water footprint of an average In-N-Out store. For simplicity, let’s assume a burgers-only scenario, ignoring the water footprint of other menu items and any water used in cooking. More specifically, we’ll calculate the footprint of In-N-Out’s most famous burger, the Double-Double, and then approximate how many of them a store sells in a year.
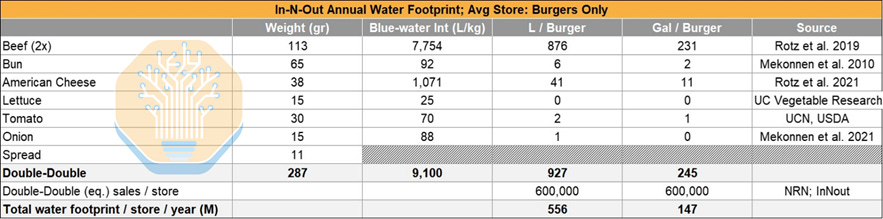
Our methodology is simple, break down each ingredient of the Double-Double, calculate the water intensity (L/kg) for each one, and weight it by its mass to get the burger’s total footprint. Again, we dug deep, and while we don’t want to bore you with all the research papers we reviewed along the way (see the source of each one in the summary picture), let’s focus on the contributor of 95% of the burger’s footprint - the beef.
Around 95% of the water footprint of the beef patties comes from the water the cattle consumes, mostly indirectly through irrigation used to grow alfalfa, corn, and other crops for feeding and raising the animal. As a result, big differences in beef water footprint can appear across regions. Some benefit from wetter climates where less irrigation is needed, while drier regions have much higher intensity. This is well illustrated in the paper we used as a data point, by Rotz et al (2019), where you can identify the blue water intensity (in L/kg) is substantially higher in the Southwest than in other regions of the US. Given In-N-Out’s West Coast presence and their claim that all beef is fresh and never frozen, we believe it’s reasonable to use these figures in our calculations. For the remaining ingredients we also used West Coast specific blue-water intensity estimates, such as for California fresh tomatoes and iceberg lettuce.
Putting it all together and considering the weight of each ingredient in a Double-Double burger, we get to a water footprint of 245 gals/burger, or 927 liters. That’s lower than our initial expectations, but while we don’t have full support for the calculations behind the public claims, we suspect those figures include green water footprint (a big part of cattle’s total water intensity) and skip nuances like intensity per carcass weight vs boneless beef.
Let’s get to the burger sales. Public sources indicate average store revenues in the order of $5.8M per year. Assuming burgers are 60% of revenue and an average sandwich price of $5.80, we get to around 600k “Double-Double equivalent” burgers sold per year. Multiply that by the water footprint per burger, and we get a total footprint per store of 147 million gals / year!
Source: SemiAnalysis
The Verdict
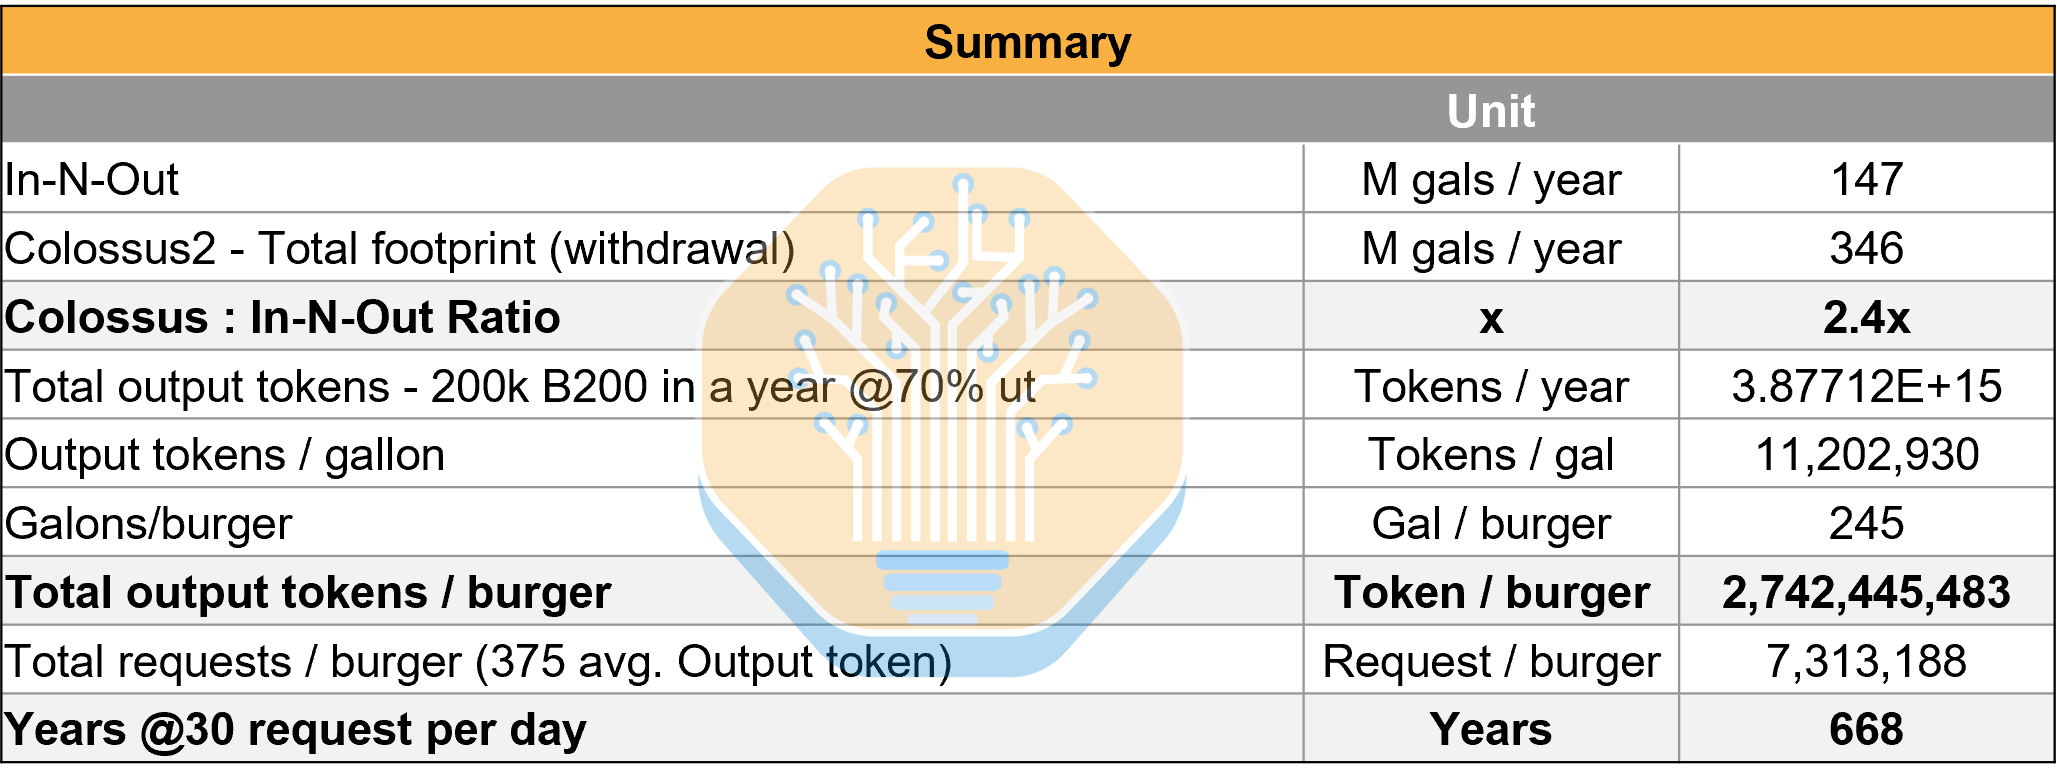
The duel is on. Colossus 2’s blue water footprint is around 346 million gallons per year, while an average In-N-Out store (yes, burgers only) comes in at around 147 million gallons. That’s roughly a ~2.5 : 1 ratio. We’ll let the reader decide what to make of thr important information that one the largest datacenters in the world only consumes as much water as 2.5 In-N-Out’s.
Given there's well over 400 In-N-Out’s and hundreds of thousands of other burger joints the only rational argument is that people clammering for slowing down datacenters because of water consumption are looking at the wrong problem.
We’re sure that at this point many of you are thinking, “Well, yes, but burgers are food, which is a basic need!” To that, we’d respond that we shouldn’t dodge the harder question of assigning an economic value to each token a datacenter can produce. At a time when models are becoming increasingly capable and increasingly intelligent, the value of a token, as a basic unit of intelligence, can be very high.
Before we wrap up, let’s run a few more numbers. Using the same assumptions on Colossus as before, plus a few additional technical assumptions on prefill/decode throughput and input/think/out token sequences, we estimate up to 3.9 quadrillion output tokens could be generated per year. This translates into 8.9 million tokens per gallon of footprint. At 245 gallons per burger, that’s 2.7 billion output tokens per burger (!). Even more, if we assume a daily request number of 30 queries per day and an average output length of 375 tokens, we get to the conclusion that a single burger’s water footprint equals using Grok for 668 years, 30 times a day, every single day.
Source: SemiAnalysis
Oh, one last thing - Elon’s ace up his sleeve - the water treatment plant. xAI is already building a water recycling plant to provide water for the tower cooling process by recycling municipal wastewater from T.E. Maxson that otherwise would be discharged into the Mississippi River. The plant is expected to more than exceed the cooling water needs, so Colossus 2 could even be considered a net zero water datacenter.
This was nothing more than our lighthearted, researched take on an important issue. Water usage matter, but we think the debate is often overstated and needs to be put into context. Next time you hear about datacenter water consumption, think about that last hamburger.
This post is in no way anti-beef propaganda, and has no relation to SemiAnalysis being founded and owned by an Indian man who was raised Hindu.