

How Much Do GPU Clusters Really Cost?
Calculating Cluster TCO, The Real Impact of Downtime, The Grand Unifying Theory Of Goodput, and a ClusterMAX 2.1 Update
Introduction: Rethinking the Total Cost of a GPU Cluster
Modern GPUs are unbelievably expensive. A single Blackwell GPU costs more than the average car, and uses more energy than a single family home. It is now common for unicorn startups to have thousands of these GPUs working for them, day and night. Many foundation model companies now spend an order of magnitude more money on GPUs than they do on employees. We know multiple companies spending over 80% of their initial funding on GPUs. Startup founders now have four important categories of spending to consider when building a financial plan for their company:
1. GPU clusters
2. Tokens
3. Employees
4. Everything else
Traditionally, when deciding where to get a cluster to solve that first category, companies evaluate neoclouds on a cost-per-hour basis, focusing on the most expensive line item: the GPUs. However, focusing solely on the price per GPU-hour a provider offers can be misleading. In practice, two cloud offerings with identical pricing per GPU-hour can have very different TCO, once you account for everything that goes into training a model or building inference endpoints. Factors such as downtime, setup time, debugging time, and required performance tuning of networking and storage can dramatically impact how much useful work users can do per dollar spent. Additional costs for non-GPU expenses such as CPU compute, networking, storage, orchestration software, and support can also be hidden and not considered. In other words, what appears to be a cheaper cluster can in many cases end up being more expensive.
Source: SemiAnalysis Cluster TCO Calculator
The central premise of SemiAnalysis ClusterMAX™ research is that cluster quality varies significantly across GPU cloud providers, and that these differences have a meaningful impact on end user experience, productivity and as a result, TCO. Many of these factors are not captured in hardware specs, reference architectures, or one-time performance benchmarks. Differences in reliability, networking behavior, storage performance, and support affect the only metric that matters: time-to-research-objective.
In this article, we introduce a methodology for calculating the TCO of GPU clusters that goes beyond raw price per GPU-hour. We define a framework that incorporates direct costs such as compute, storage, networking, and support, as well as indirect costs related to reliability, debugging, and setup. Using this framework, we compare three classes of ClusterMAX rated providers: a gold tier neocloud provider, a silver-tier hyperscaler, and a silver-tier neocloud. We apply this methodology to three representative cluster configurations, covering Large LLM Pretrain, Multimodal RL Research, and Inference Endpoints.
In order to conduct this comparison we use our GPU Cluster TCO Calculator and our Goodput Calculator, which we release for free on our ClusterMAX website. Anyone reading this can plug in their own values for custom scenarios and see the results. We explain the formulae behind this calculator later in this article and introduce our Grand Unifying Theory of Goodput.
These calculators are supported by input data from our GPU Rental Pricing data series, hands-on experience testing 80+ neoclouds, and interviews with over 150 end-user customers of neoclouds which were conducted during the research effort for ClusterMAX 1.0, ClusterMAX 2.0, and continue to this day for ClusterMAX 3.0.
Our findings demonstrate why providers in the ClusterMAX gold-tier command a pricing premium, (or win deals at equal price). Specifically, we find that when we hold GPU pricing constant, the TCO of a gold-tier provider is lower than a silver-tier provider by roughly 5-15% across a representative set of large training workloads, but the difference is reduced to near zero when considering fault tolerant workloads like single node inference clusters. In other words, we put real dollar values behind the intuition that users have built when understanding the benefits of fault tolerance.
Definitions and Key Terms
To evaluate GPU cloud offerings on equal footing, we break down the TCO of a GPU cluster as follows.
1. GPUs [$/GPU-hr]: The headline rental price for a GPU cluster. This starts from the provider’s list price, then factors in any discounts due to term length commitments or volume, planned use of spot/preemptible instances, and the orchestration premium. Orchestration premium refers to pricing increases beyond basic instances, for example if using Kubernetes or Slurm through SageMaker Hyperpod Slurm in AWS, customers typically pay a premium for the SageMaker instance type vs the standard EC2 instance type even though the underlying GPU machine is the same. We account for such discounts and premiums to derive an accurate per GPU-hour cost. Critically, the data used in this report is informed by two of our institutional products: our AI Cloud TCO Model and GPU Rental Pricing Data Series. Our default pricing for GPUs is a historical snapshot from August, 2025. We described how things have changed since then in a recent article. Please contact sales@semianalysis.com for access to our GPU pricing data series.

Source: SemiAnalysis GPU Rental Price Dashboard
2. Storage [$/GB-mo]: The cost of storing data. This includes high-performance “hot” storage (e.g. NVMe-based parallel file systems), lower-tier “warm” or object storage for less frequently accessed data, and “cold” archival storage. We also include any data access costs: for instance, API call costs on object storage or data egress charges if data leaves the cloud. These can be substantial during training when moving around large datasets and model checkpoints, and during inference when considering storing logs and metrics (now including image, video, and audio data). Based on customer surveys, we adjust our assumptions across different cluster scenarios from a low point of 2TB/GPU to a high point of 25TB/GPU. We also track the public pricing (standardized to per GB, per month) across various providers and release this data for free as a dropdown menu in the Cluster TCO Calculator. Notably, storage performance can vary massively even between different offerings even from the same provider. For example, AWS FSx for Lustre has 4 different throughput tiers (ranging from 125 MB/s/TiB to 1,000 MB/s/TiB) and charges about 3x more for 4x more throughput at list price. We allow for a consideration of this difference during inputs (e.g. for job init time) in goodput calculations discussed later.

Source: SemiAnalysis Cluster TCO Calculator
3. Networking [$/hr or $/GB-mo]: The cost of frontend/N-S networking features. Networking services include public IPs, firewalls/security groups, load balancers, data egress, and data transfer. For example, transferring training data or model weights out of AWS or between AWS regions can incur significant fees. For the backend/E-W network, we make a simplifying assumption that all clusters eventually perform at a similar level with a high bandwidth interconnect (i.e. InfiniBand, RoCE, EFA, etc.) after setup. As a result the cost differences are considered later in Setup Expense and Debugging Expense.
4. Control Plane [$/hr]: The cost of managing the cluster. In terms of the orchestration software control plane, nodes for login, code development, and job submission. Extra CPU-based nodes for data processing and environments for RL rollouts can be considered here too.
5. Support [% uplift]: The cost of support. For example, on AWS, this is an extra charge on the entire cloud bill, with three different options that range anywhere from an initial 10% to a final 3% of the bill as the monthly spend graduates to higher tiers. Of course, different tiers of support mean better response in the event of an outage or performance issue.

Source: SemiAnalysis Cluster TCO Calculator
6. Goodput Expense [% uplift]: The first item that is not showing up on a monthly bill and is an implicit cost associated with using lower-tier providers. We use this percentage to build in an additional cost of downtime on the cluster in the form of more rental time required, or less useful work being completed. In practice, the actual amount of downtime, or number of job interruptions depends on the provider, the individual datacenter, hardware, and workload. Inputs used to calculate this expense include the total number of interruptions/failures, time to identify the failure, and the time to repair/replace a node. The impact of a single failure/interruption also depends on the cluster design, e.g. the blast radius of the failures, training initialization time, average job size, checkpoint frequency and/or use of fault tolerant software frameworks. The inputs to this piece of the calculator is also an opportunity for users to price in the risk of a bad SLA from a risky provider, on a total % basis. For example, a 95% cluster uptime SLA commitment from the provider allows for 5% downtime with no response and not credits. Since this input is so complicated we have an entire second tab with multiple scenarios covered. More on this later.

Source: SemiAnalysis Goodput Expense Calculator
7. Setup Expense [$/hr]: The cost of having engineers setup the cluster, and tune performance. For example, on AWS, POC’s are not free, and users report that tuning NCCL + EFA parameters in order to reach the same level of performance as InfiniBand or RoCE networks can take weeks to months of effort by multiple engineers. Since in many cases this requires an entire cluster to be dedicated to this work, the additional line items of expense includes both engineering hours and the cluster time spent on performance tuning.
8. Debugging Expense [$/hr]: The cost of having engineers debug the cluster over time, i.e. the cost of engineering headaches. For example, on AWS, users report that debugging NCCL + EFA issues involves 4 or 5 layers of indirection from their pytorch code, through the driver stack and into the NIC/switch firmware/hardware recipe. In other words, these line items of expense include the engineering time spent on an ongoing basis, and the cluster time spent on failed jobs.
Next, we describe how both calculators work.
Our Proposed TCO Formula for GPU Clusters
The following formula is used to calculate the Total Cost of a GPU Cluster on a monthly basis:
Where…
Note: setup is amortized over the contract term (3mo to 3yr). in other words, spending time setting up a cluster you will use for 3 years is not a big deal. Spending weeks setting up a cluster you will use for 3 months is.
Next, we define G_chkpt-hot, G_chkpt-cold, and G_tolerant, i.e. the different ways to calculate goodput expense.
The Grand Unifying Theory Of Goodput
First, what is goodput?
In the context of training, goodput is defined as the amount of useful work users can perform on their cluster. Goodput plays on the term throughput to mean that not all throughput is “good”. Lots of training throughput can be “bad” if a GPU fell of the bus, NCCL is stalling, or there is an OOM hiding around the corner during the next checkpoint save.
These issues are much more pronounced at scale. As we demonstrate below, larger jobs on larger clusters are much more impacted by individual failures or interruptions. If 80% of your cluster is running one job, and that job has to restart (a process that can take 10-15 minutes depending on storage, networking, CPUs, caching setup, etc.) this is costing you all of those 10-15 minutes of cluster time for job initialization time, plus all the wasted compute you did from the last checkpoint to the time of the failure/interruption/crash.
As we explained in ClusterMAX 2.0, cluster-level MTBF also plays a role here. Since all GPUs eventually fail, the bigger your job, the less time you have to do useful work (goodput) in between failures.
Here we use a convenient table to illustrate the concept. As node failures get more common (moving down the y-axis of the chart) and cluster size gets bigger (moving to the right across the x-axis of the chart), the time between failures (MTBF) gets smaller and smaller.

Source: AWS
As a result, we really need to know which providers are:
Running clean datacenters with talented ops teams
Capable of identifying failures quickly (or even predicting them before they occur)
Able to recover from failures quickly (e.g. running hot spare pools of nodes with capacity guarantees)
We summarize all of this in our TCO Calculator as “Goodput Expense”, where the following formulae are used to calculate Goodput Expense under three scenarios:
Where…
G_chkpt-cold = goodput expense when jobs restart from a checkpoint via a spare node that is “cold” (typically, provider managed). In other words, the jobs wait until a repair/replace happens. This is the worst case scenario, since these kinds of repairs typically take hours or days.
G_chkpt-hot = goodput expense when jobs restart from a checkpoint via a spare node that is “hot” (typically, customer managed but can also be from top-tier providers). In other words, the jobs (depending on defined priorities) can restart immediately on idle nodes (customer managed), pre-empt lower-priority jobs (also customer managed), or restart on a node that gets brought into the cluster from a spare pool (provider managed). Of course, a provider-managed spare pool also depends on some capacity guarantee from the customer (i.e. if one of your machines fail and you report it for repair/replacement, there needs to be spares available). Top-tier providers that are experienced running multi-tenant clusters at 4k+ GPU scale tell us that they will leave anywhere from 2-6% of their nodes in this spare pool to be used for hot-swaps.
G_tolerant = goodput expense when jobs are “fault tolerant”, i.e. they can keep running in the event of a hardware issue. This scenario is well understood for single-node inference, where a framework such as llm-d or ome or kserve will just have the load balancer stop sending traffic to the failed node and resend any failed requests to the healthy nodes. The scenario is less well understood in training.
Individual terms are…
Notably, from the user’s perspective, there are two very different approaches at the software level that we have observed on training clusters. The first is checkpoint restart (still the most common option for small and medium-scale clusters), and the second is fault tolerant training frameworks. In both cases, the inputs to the calculations depend on the approach of recovering from idle nodes vs pre-emption vs relying on the provider, and how long repair/replace flows actually take.


In the scenario of a fault-tolerant training framework, we consider three options, which we describe in more detail below:
TorchFT (open-source from meta-pytorch)
AWS SageMaker HyperPod Checkpointless training (restricted to AWS only)
TorchPass (licensed product from clockwork.io)
TorchFT
TorchFT is the open source standard for fault tolerant training frameworks. The framework easily integrates with existing torchtitan code, and allows for training jobs on large clusters to continue running in the event of a hardware failure. No need for checkpoints (or really, you can checkpoint less frequently). However, the blast radius is the entire replica group.

Source: PyTorch blog on TorchFT
Since TorchFT’s blast radius is the entire replica group (i.e. an FSDP shard within an HSDP job), when any GPU or node within a group fails, the whole group’s torchrun process crashes. This means that all GPUs in that group are idle until recovery completes. As a result, with FSDP shard=16 a single GPU failure takes out all 16 GPUs. With shard=32, it takes out 32 GPUs, etc.
Specific to FSDP, the relevant failure domain is the communication group, not just the raw cluster size. Because parameters are all-gathered before computation and gradients are reduce-scattered in backward, a single failed or hung rank can stall the entire participating group. In practice, HSDP makes this more explicit: blast radius becomes a topology decision at the replica-group level rather than a property of the whole cluster.
This has a tradeoff. When a replica group dies, you lose that whole group’s GPUs until the node is replaced, a surviving group serializes its full model + optimizer state via state_dict(), serves it over HTTP to the recovering group, calls load_state_dict(), syncs its step counter, and rejoins the quorum. This whole process is orchestrated by the TorchFT lighthouse server, which you must install on the cluster.
Not every large-scale failure looks like a dead GPU or dead node. A meaningful share of incidents first appear as stuck collectives or watchdog timeouts, which are just symptoms. From a TCO perspective, that means goodput loss includes not only repair or replacement time, but also the time required to detect, attribute, and unwind a hung collective across the participating ranks.
Checkpointing itself can be part of the failure tax. On FSDP2, converting a DTensor state dict back to a full tensor for saving issues an all-gather across ranks Checkpoint frequency is a reliability parameter and a communication and failure-surface parameter.
However, this fault tolerance comes at a performance cost. Since TorchFT requires the use of GLOO vs NCCL for comms across replica groups, there is a per-iteration overhead for an allreduce through the CPU via frontend TCP instead of the backend RDMA network. In initial testing we saw a performance difference of over 10% on comparable HSDP jobs. As a result, when considering goodput expense, we allow for this performance difference to be considered in a “Network overhead (%)” line item if the user chooses to run TorchFT.
Fault tolerance can affect training semantics, not just recovery latency. The number of healthy participants, and therefore effective batch, could change from step to step as replica groups dropped in and rejoined. When comparing TorchFT to checkpoint-restart or live-migration approaches, some methods preserve forward progress by accepting temporary degraded participation, which may affect optimizer dynamics and throughput accounting.
Notably, TorchFT is scheduler agnostic, so it supports kubernetes or slurm.
AWS SageMaker HyperPod Checkpointless Training
AWS introduced checkpointless training for their SageMaker Hyperpod EKS clusters in December 2025. This is a kubernetes-only, and NeMo megatron-only solution to the same fault tolerance problem described earlier. Amazon developed this technology internally for training their Nova models and has proven it at 1k+ GPU scale.
The core of checkpointless training is the concept of model redundancy. In other words, the model and optimizer states are contained to the replica group, and then synced cross-replica group (though AWS calls them node groups). Similar to TorchFT, the presence of this cross-group sync allows for recovery of failed nodes and groups without interrupting the running job. Blast radius is proportional to the size of the group relative to the full job size. At runtime, each GPU maintains redundant copies of its model shards on peer GPUs, meaning when a failure occurs the recovering process loads state via RDMA over EFA. This process is managed by CheckpointManager and is a relatively simple code change as long as you’re scheduling your jobs on via the SageMaker HyperPod Training Operator.
There is a clear tradeoff for memory overhead here. To quote AWS docs: “The high-precision master model weights/gradients and optimizer states will be affected. Adding one redundant model replica increases device memory usage by roughly the equivalent of one DCP checkpoint size.” In other words, to run with this approach to fault tolerance you will introduce GPU memory pressure (proportional to the size of your replica groups relative to total job size) and OOMs. The result is running at reduced batch size or different parallelism strategies, which relative to a checkpoint restart job generally means a performance impact. As a result, when considering goodput expense, we allow for this performance difference to be considered in a “Memory overhead (%)” line item if the user chooses to run with checkpointless training.


Source: AWS Checkpointless Training Docs
Notably, checkpointless training is integrated with AWS node lifecycle management and deep health checks, which means it is quick to swap in pre-warmed hot spares (i.e. idle nodes in the cluster) for replacement. AWS claims recovery times of 1min 45 seconds for checkpointless training, vs 15 mins for checkpoint restart. Our hands on testing confirms this recovery time for a simple megatron training job on a 4-node H200 cluster. We also tested deep health checks and saw simulated hardware failures identified in under 2 minutes, and health nodes replaced in the cluster in under 20 mins.
Clockwork TorchPass
By direct comparison to the previous two frameworks, torchpass is the only licensed software product, and the only option that maintains the same training performance as jobs without fault tolerance. In other words, the code changes are minimal, there is no performance overhead. The cost comes in the form of idle nodes in the cluster or time spent pre-empting lower priority jobs.
TorchPass is implemented at the scheduler level via plugin. In the case of our hands on testing this was an 8-node GKE cluster running a torchtitan job via PyTorchJob (KubeFlow) and the native kubernetes scheduler. We primarily tested the “planned migration” case, which is applicable for interruptions such as upgrades or maintenance on nodes in the cluster, and various Xids related to ECCs, GPU falling off the bus, power failures, link flaps, etc. In these cases, TorchPass supports a simple “just-in-time” checkpoint concept via get_state() that allows for the failing node to transfer state via RDMA to an idle spare. Notably, this sort of soft failure scenario is the most common type of failure in large training clusters where nodes slowly degrade over time but are still functional.
The results are clear when compared to checkpoint restart and TorchFT with performance overhead. Recovery times are similar for planned migrations, and the job performance is similar.

Source: TorchPass Blog from Clockwork.io
In addition, “unplanned migration” or hard failures (i.e. GPU, memory, network or other hardware failure, sudden reboot, kernel panic, etc.) are also possible to support via a similar approach to what was described in the TorchFT or Checkpointless Training sections above. In other words, the same “just-in-time” checkpoint approach can migrate state from a healthy worker in another replica group to the idle node joining the cluster to replace the failed node.
The TorchPass orchestrator is installed at the cluster level, and interacts with a Manager class that is integrated into an existing training script. It is relatively simple to figure out with only a few lines of code being added to existing training scripts.
Overall, there are many fault tolerant frameworks to choose from, and as clusters scale in size it because necessary to contend with these reliability challenges, users can’t only rely on their provider to handle every failure. A training codebase at 1k+ GPU scale really needs to be designed to work with the realities of the cluster it runs on.
Overview of Three Cloud Providers Being Assessed
Now, to demonstrate how to use the calculator, we use three representative providers.
Gold-tier
Hyperscaler
Silver-tier
These are not direct comparisons, but rather an amalgamation of the average experience using the providers in the given tier. Roughly speaking:
Gold-tier = Nebius + Fluidstack + Crusoe
Hyperscaler = Oracle + Azure + AWS + GCP
Silver-tier = Together + Lambda + Vultr + Voltage Park + Cirrascale + Gcore + Firmus + GMO + Tensorwave
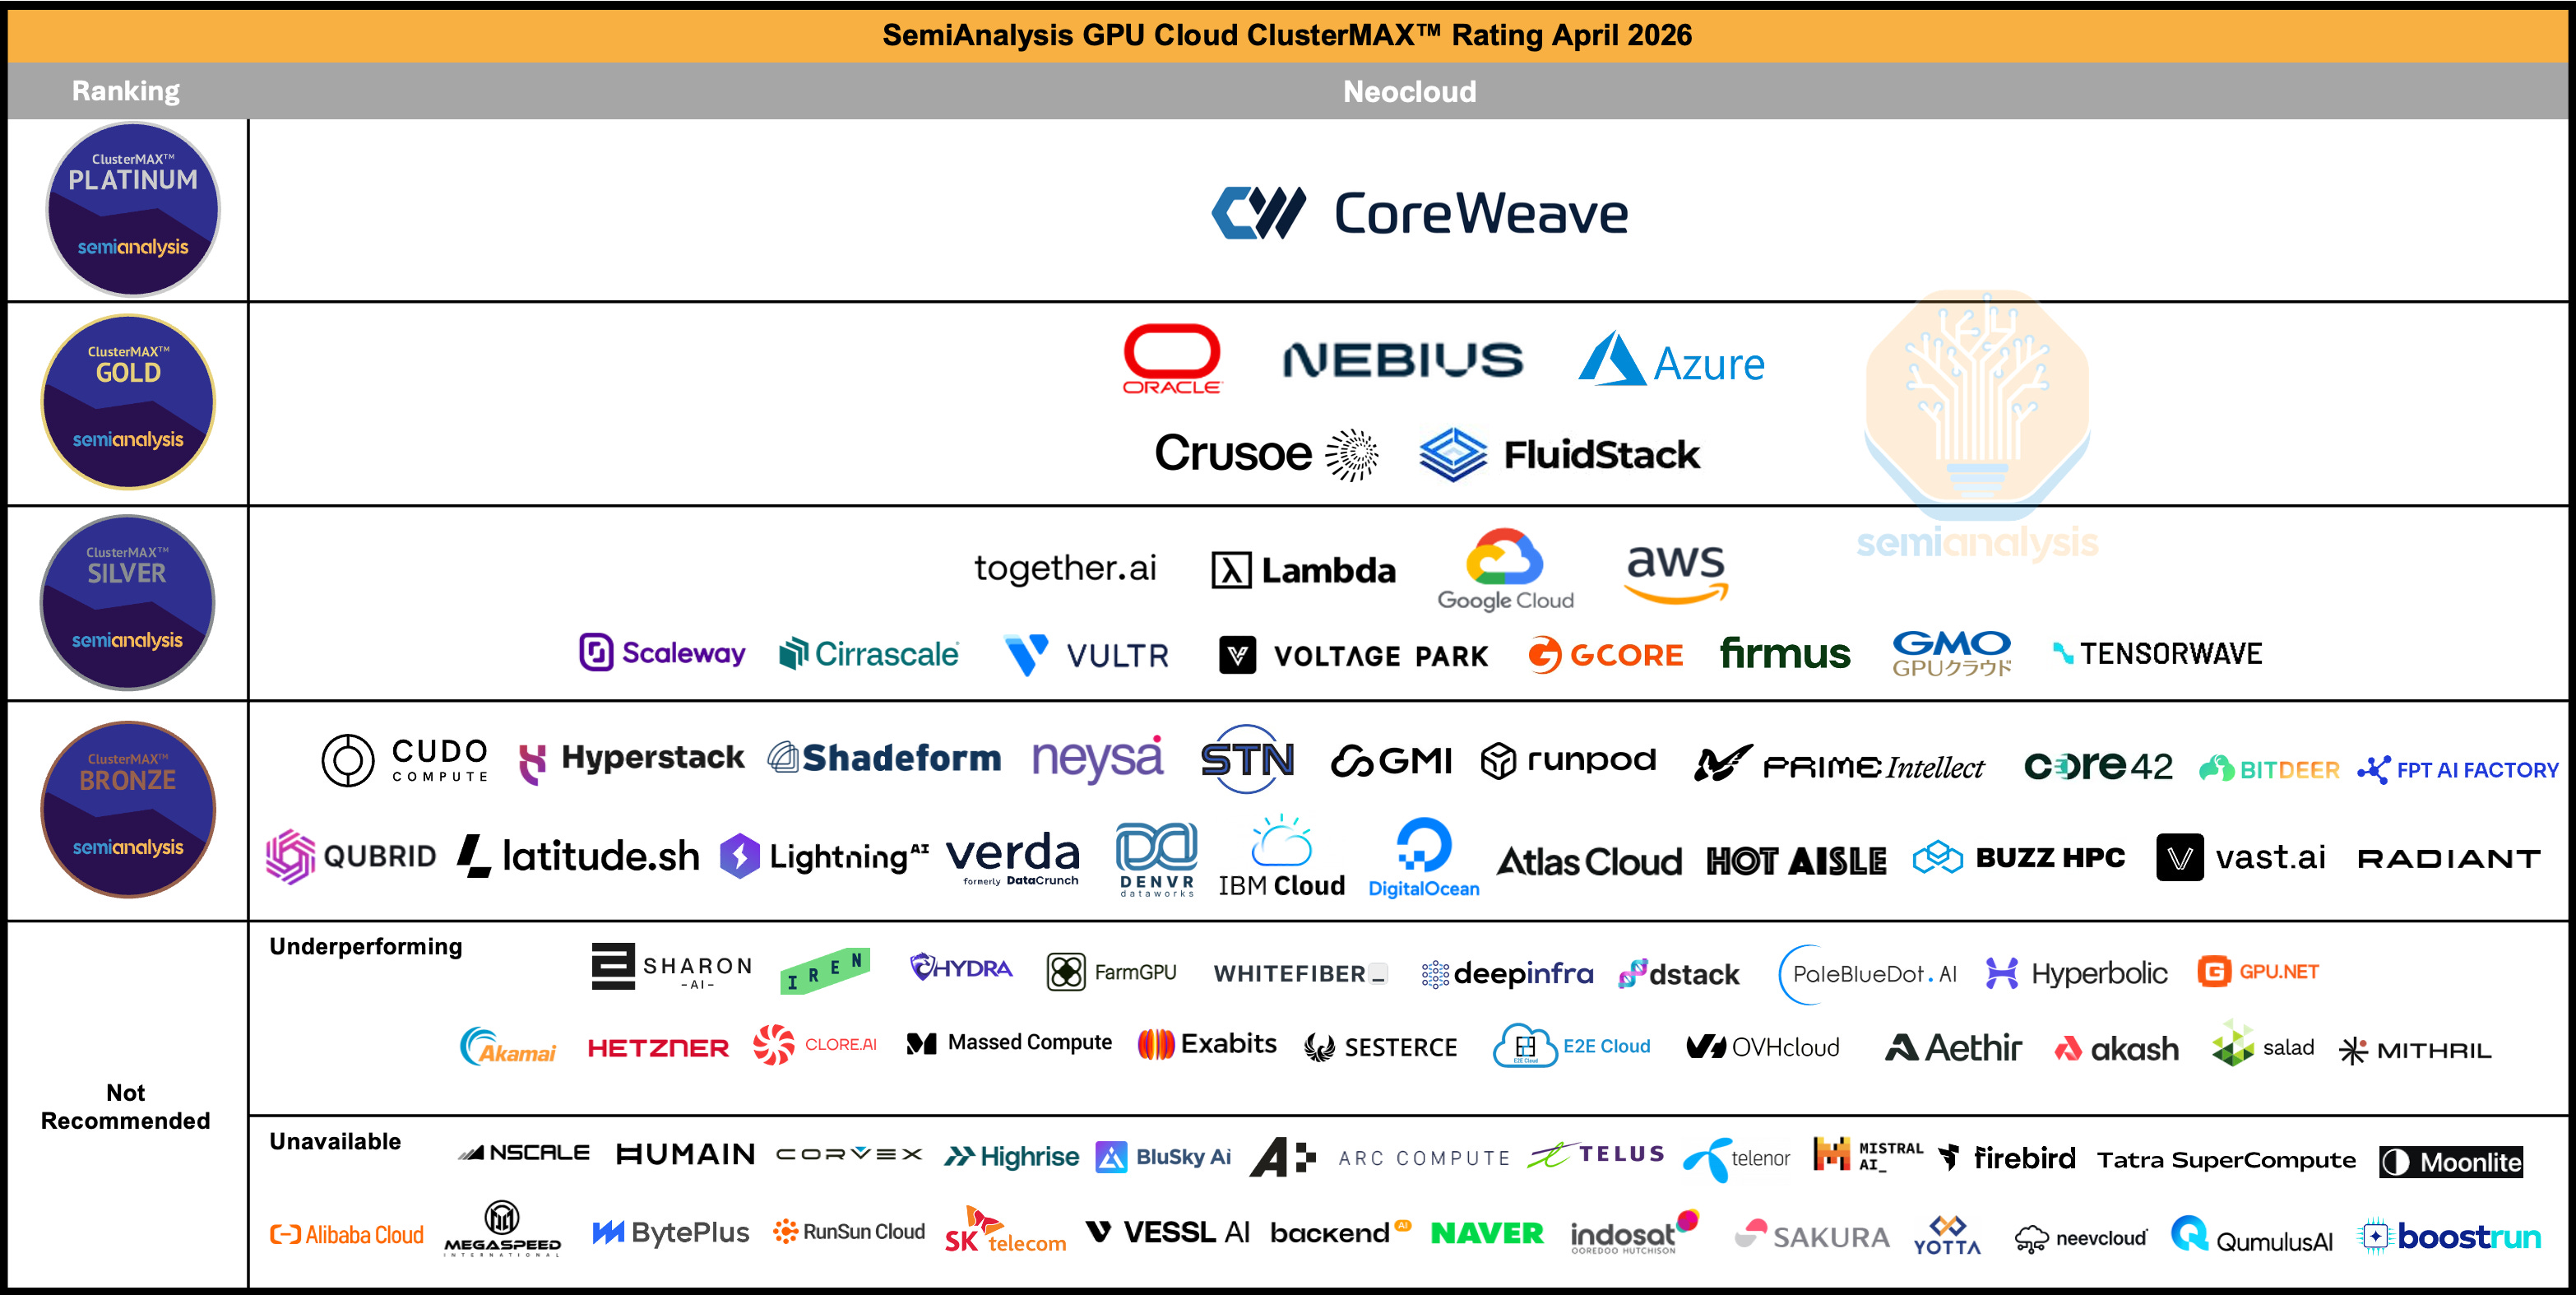
Figure 1: SemiAnalysis ClusterMAX 2.1 Rankings, April 2026
Gold-tier
Typically, we see Gold-tier providers have more aggressive discounts than hyperscalers, approaching the 25th percentile of our GPU Pricing Data for large clusters and long-term contracts. In our testing, storage performance is strong, with volume discounts available for file and object storage. On networking, we have seen expected InfiniBand or RoCE performance out of the box with little to no setup time. The orchestration software (slurm or kubernetes is generally configured properly, and is also easy to setup and use. In general, POC’s are free. All support is 24x7, with good response times and talented engineers available directly without opening tickets. This support experience is included in the price without extra hidden charges. Finally, monitoring dashboards are setup with the cluster, health checks are configured by default, and a hot-spare pool of nodes is available for quick replacements in the event of a failure, effectively guaranteeing that when hardware fails there will be a quick replacement.
Hyperscaler
We typically see hyperscalers provide volume discounts that range from the 50th to the 75th percentile of our GPU Pricing Data. Large enterprises with MSA’s should expect pricing above the 75th percentile due to additional hidden costs. Out of the box, we have seen poor storage performance be the default, with limited discounts available and extra charges required to improve performance. Networking performance also tends to require lots of setup time and debugging issues over time, leading to lots of cluster time being lost to unproductive work. In addition, POC’s are generally not free, which increases the setup time expense. Hyperscalers also charge a premium for support, with different tiers that each have different response times and monthly charges. These charges generally graduate down from 10% to 3% of the monthly bill as the monthly spend increases. Finally, monitoring dashboards are not usually setup and accessible by default, and can have extra charges associated. However, health checks are generally easy to configure, the datacenters are well run (reducing the total amount of failures and interruptions that occur) and both a hot spare pool of nodes and capacity guarantees exist.
Silver-tier
The typical silver-tier neocloud is a representative amalgamation of features offered by different companies. Typically, we see silver neocloud pricing at the 50th percentile on the high end, and below the 25th percentile on the low end. Buyers should be wary of aggressive discounts, which are a signal of low quality. Storage performance depends on the provider’s experience with VAST or Weka, and some volume discounts are available. InfiniBand or RoCEv2 performance is generally good out-of-the-box, though time can be lost for setup and debugging of orchestration software like Slurm or Kubernetes, and POC’s not always free. Support is typically included, but 24x7 response time coupled with a direct-to-engineer model is unusual. Critically, monitoring dashboards and health checks are not usually configured by default. Hot spare pools can be available, but there are generally no capacity guarantees. We see cold spares being the typical approach as silver-tier providers tend to rely on their serve OEM to handle repairs for them.
Applying the TCO and Goodput Formulae
In order to explore a broad range of typical customer requirements, we calculate the TCO for Gold-tier, Hyperscaler, and Silver-tier in three different scenarios: Large LLM Pretrain, Multimodal RL Research, and Inference Endpoints.
Below we walk through these scenarios using screenshots from our GPU Cluster TCO Calculator and our Goodput Calculator. We release both of these calculators for free on our ClusterMAX website so that users can plug in their own values for custom scenarios and see the results with relevant inputs.
Source: SemiAnalysis ClusterMAX Website
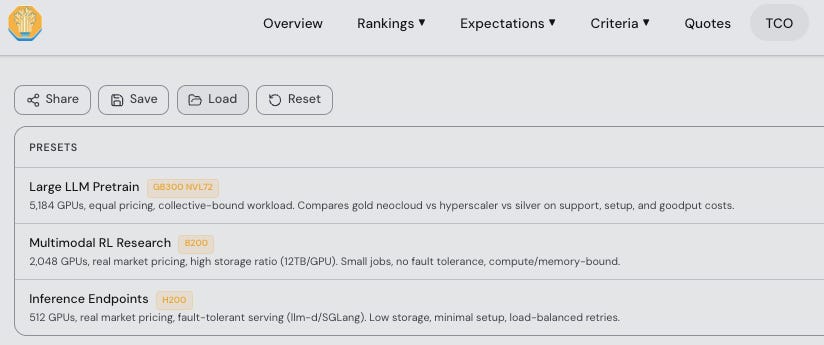
Next we will walk through three representative scenarios using the calculators. Just click “Load” to bring in one of these three scenarios and follow along.
Scenario 1: Large LLM Pretrain
In this scenario, we assume that basically the entire cluster is built to run a single large pretraining job (around 80% at 4096 of 5184 GPUs). For the rest of the cluster specs, we assume a medium storage ratio of 2TB/GPU with 500TiB of hot-tier storage and 10PiB of cold-tier storage. We also assume that there is a long setup time where users tune the cluster and try to reach best performance on communications bound workloads, which leads to more time spent on EFA than InfiniBand and Spectrum-X, for example.
Specifically, using our calculator we:
select 5,184 GB300 NVL72 GPUs and assume equal pricing across all three providers at $4 per GPU-hr with the hyperscaler waving the per-instance orchestration premium and matching the cluster price.
select 500TB of hot storage, which is assumed to be Weka, Lustre, or a similar NVMe-based high performance filesystem.
select 10PB of cold storage, which is assumed to be an S3 or similar object storage option. Since many silver tier providers can’t provide hot tier storage at max performance, we assume warm storage pricing for the 500TB and make note of the performance difference when considering the job initialization time (10 mins vs 15 mins) during the goodput calculations.
assume that Gold-tier discounts both tiers of storage aggressively, and hyperscaler does not, resulting in an almost 2x storage pricing discrepancy (this is typical, in our experience, but since there is a small amount of storage relative to GPUs it doesn’t have a big impact on cluster TCO).
assume minimal egress, NAT processing, and data transfer fees on the network for all providers, since there will not be much data moving in and out of this core training cluster. Of course, only the hyperscaler charges for these small line items.
assume no CPU machines are purchased for data processing workloads, and just 3 machines for control plane services (login and slurmctld) which the hyperscaler charges for and the others include in their pricing.
assume that support for the hyperscaler is something analogous to AWS Unified Operations (i.e. the maximum support tier is chosen), while both Gold-tier and Silver-tier include the cost of support in their cluster.
assume that significant engineering effort is required for setup, and ongoing debugging of the network on the hyperscaler cluster. This is a critical assumption! We assume that each engineer is $200k USD.
assume a 1 month paid-POC for setup and performance tuning is required on hyperscaler, with an additional 1 week per month of 2 engineers time related to network performance debugging on an ongoing basis. Notably, this does not include an expense for ongoing wasted jobs, just engineering time on a negligibly small subset of the cluster. In other words, we assume that wasteful debugging jobs that are required due to the provider’s cluster quality are all completed during the POC.
Subtotals are available in each tier on the calculator:

Source: SemiAnalysis Cluster TCO Calculator
Overall, the discrepancy in price when comparing Gold-tier, Hyperscaler, and Silver-tier on a 3 year term is 1x, 1.10x, and 1.15x respectively for this scenario.
For the Hyperscaler, this 10% price discrepancy is primarily attributed to the additional cost of support, and setup (EFA performance tuning). We assume this amount of setup time since pretraining jobs of this size are typically collective-bound on the scale-out network, requiring aggressive EFA tuning to reach expected performance.
For the Silver-tier neocloud, the 15% price discrepancy is primarily attributed to the additional cost of goodput loss/downtime, setup (engineering time spent on health checks, performance tuning), and storage.


Source: SemiAnalysis Cluster TCO Calculator
Now to explain the goodput calculation in more detail, in this scenario we assume that the customer has implemented three different approaches to fault tolerance depending on the provider. In the first case, on the gold-tier we assume TorchPass (or equivalent custom code) is used. On the hyperscaler, we assume HyperPod Checkpointless training. On the silver-tier, we assume a checkpoint restart for hot spare idle nodes.
The different inputs are displayed in the table below, with the key differences being that the Silver-tier provider is assumed to have a 60% worse MTBF (i.e. more total interruptions/failures), a longer time to identify a failure (assumed 1hr vs 15 mins), a longer time to repair a failed node (again assumed 1hr vs 15 mins), and a longer job init time (15 mins vs 10 mins due to worse hot-tier storage performance).
TorchPass comes with an extra expense of 32 idle GPUs (4 nodes spare, i.e. 0.62% of the cluster idle) and Checkpointless Training is assumed to have a 5% performance impact due to memory overhead.
The results are a significant difference between the three providers: 6.14%, 10.53%, and 20.91% respectively.

Source: SemiAnalysis Goodput Expense Calculator
Scenario 2: Multimodal RL Research
Notably in the previous scenario, we kept the price per GPU-hour equal across providers. This is not typically the case. In this scenario, we assume small jobs, but no fault tolerance. We assume a large amount of storage, i.e. a high TB/GPU ratio. We also assume not much setup/debugging time is necessary to achieve equal performance across providers as the workload is primarily compute or memory bandwidth bound, not collective bound.
Specifically, we:
select a 2,048 B200 cluster and use real-world pricing data from August 2025 in our GPU Rental Pricing tracker, namely $2.40 from the neoclouds at the 25th percentile and the hyperscaler around the 50th percentile at $3.10. Put differently, we assume a 75% discount is provided by hyperscaler off the p6.b200.48xlarge instance’s on-demand list price.
assume a 10% instance pricing premium for the hyperscaler for orchestration software such as slurm and kubernetes
assume that since these are research jobs, the customer has not implemented fault tolerance in their code, and whether a provider has hot spares available or not will impact how long a failed job waits before restarting from a checkpoint.
assume an async checkpoint frequency of 1hr. We assume a high storage ratio of around 12TB/GPU, specifically we assume 25PB of hot-tier storage for multimodal training data, synthetic data generation, and model checkpoints, with additional cold-tier storage being hosted remotely
assume Gold-tier discounts storage aggressively, and both hyperscaler and the silver-tier neocloud do not. Since many silver tier providers can’t provide hot tier storage at max performance at this scale, we make note of the performance difference when considering the job initialization time (10 mins vs 15 mins).
assume minimal egress, NAT processing, and data transfer fees on the network.
assume no CPU machines are purchased for data processing workloads, and just 3 machines for control plane services (login and slurmctld).
assume that the Hyperscaler provides a medium tier of support equivalent to AWS Enterprise Support, while both Gold-tier and Silver-tier include the cost of support in their cluster.
- assume that some engineering effort is required for setup and ongoing debugging of networking on the hyperscaler cluster and the silver-tier provider. Specifically, we assume a 2 week paid-POC for setup and performance tuning is required on both, with an additional 1 week per month of 1 engineers time is needed on an ongoing basis related to debugging
Subtotals are available in each tier on the calculator:

Source: SemiAnalysis Cluster TCO Calculator
Overall, the discrepancy in price when comparing Gold-tier, Hyperscaler, and Silver-tier on a 3 year term is 1x, 1.61x, and 1.15x respectively for this scenario. For the Hyperscaler, this 61% price discrepancy is primarily attributed to the additional cost of the GPUs and orchestration software, storage, and setup time. For the Silver-tier neocloud, the 15% price discrepancy is primarily attributed to the additional cost of storage, with a small amount being goodput and debugging time.

Source: SemiAnalysis Cluster TCO Calculator
Now to explain the goodput calculation in more detail, in this scenario we assume that the customer has not implemented fault tolerance in their code. In the event of a hardware interruption, the running job will wait in a queue to restart from the latest checkpoint using provider-managed hot or cold spare machines. Thus, in the event of a failure, whether a provider has hot spares available impacts the entire job. Specifically, we assume that the average job size is 64 GPUs of the total 2,048 (around 3% of the cluster), async checkpointing is configured at a 1hr interval, and job initialization time is 10-15 minutes depending on the provider’s storage performance.
As discussed in Scenario 1, we provide example inputs for the goodput calculator based on our hands-on testing experience and customer interviews. Specifically, we assume an equal GPU-level MTBF for Gold-tier and hyperscaler of around 25,000 GPU-hr, while the example silver-tier provider is assumed to have a GPU-level MTBF of 15,000 GPU-hr. We assume that both Gold-tier and hyperscaler identify failures in 15 minutes, while the silver tier provider takes 1 hour. We also assume that on Gold-tier and hyperscaler the time to replace the failed node is 15 minutes, while on the silver-tier neocloud it is 1 hour.
The results are a small difference between the three providers: 0.23% to 0.96%, demonstrating that in a scenario with many small jobs, differences in cluster reliability is much less impactful on goodput, and therefore on cluster TCO.

Source: SemiAnalysis Goodput Expense Calculator
Scenario 3: Inference Endpoints
Notably in the previous two scenarios, we assumed that customers have not always implemented fault tolerance in their code. For this scenario, we assume that the customer is using a modern inference framework with load balancing and autoscaling built in, so whether a provider has hot spares available will not impact how long a failed request waits before being retried on another endpoint. It will only impact the length of time a node is down in a cold-swap scenario. There is also no checkpointing and initialization time due to job restarts/cold starts in this scenario. We assume that the average job is small relative to the size of the cluster, taking just single node (8 GPUs) from a cluster of 512 GPUs (1.5%).
In addition, we
assume Gold-tier and the Silver-tier neocloud pricing is at the 25th percentile of our H200 pricing range, with hyperscaler around the 50th percentile. Put differently, we assume a 75% discount is provided by hyperscaler off the p5en.48xlarge instance’s on-demand list price.
assume a small amount of storage is required, at around 1TB/GPU. Specifically, we assume 500TB of hot-tier storage for models, and logging, with additional cold-tier storage being hosted remotely.
assume that storage pricing is similar across all three providers, and do not consider storage performance to impact cluster TCO for inference.
assume minimal egress, NAT processing, and data transfer fees on the network.
assume no CPU machines are purchased for data processing workloads, and just 3 machines for control plane services (kubernetes control plane).
assume that the lowest tier is chosen on the hyperscaler (e.g. AWS Business Support+), while both Gold-tier and Silver-tier include the cost of support in their cluster.
assume that minimal engineering effort is required for setup and ongoing debugging of networking on the hyperscaler cluster and the silver-tier provider, just 2 weeks for 1 engineer.

Source: SemiAnalysis Cluster TCO Calculator
Overall, the discrepancy in price when comparing Gold-tier, Hyperscaler, and Silver-tier on a 3 year term varies almost exclusively based on the GPU pricing in this scenario, i.e. less than 1% for equal GPU pricing between Gold-tier and Silver-tier neoclouds. For the Hyperscaler, this 59% price discrepancy can be attributed to the additional cost of the GPUs and orchestration software, storage, and support.

Source: SemiAnalysis Cluster TCO Calculator
To explain the goodput calculation in more detail, we assume that the customer has implemented fault tolerance based on the use of a modern LLM serving framework such as llm-d or SGLang OME. In the event of a hardware interruption or cluster autoscaling up/down, the requests in flight are retried on the load balancer. Thus, in the event of a failure, whether a provider has hot spares available impacts only the uptime of the failed node, and the job keeps running. There is basically no initialization time or cold-starts once the new node has re-joined the cluster. Just load the model into GPU memory and go.
Specifically, we assume that the average job size is 8 GPUs of the total 512 (1.5% of the cluster). Notably, in scenarios with WideEP, Disaggregated Prefill/Decode, and fault-tolerant training, this job size (and resulting blast radius) would be much larger. As discussed in Scenario 1 and 2, we provide example inputs for the goodput calculator based on our hands-on testing experience and customer interviews. Specifically, we assume an equal GPU-level MTBF for Gold-tier and hyperscaler of around 25,000 GPU-hr, while the example silver-tier provider is assumed to have a GPU-level MTBF of 15,000 GPU-hr. We assume that both Gold-tier and hyperscaler identify failures in 15 minutes, while the silver tier provider takes 1 hour. We also assume that on Gold-tier and hyperscaler the time to replace the failed node is 15 minutes, however in this case we assume 8 hours for the silver-tier neoclouds, illustrating why certain workloads can tolerate this downtime even when the provider has no hot spares available, and accommodates an entire repair/replace workflow on the physical hardware.
Notably, this doesn’t make much of a difference on the total Goodput Expense. Only around 0.5% of the Cluster TCO is impacted by all these extra failures and extra downtime for the Silver-tier provider. This is a real example of why inference providers can find unused capacity from lower tier providers all around the world and use it effectively to serve single-node inference workloads for happy customers.

Source: SemiAnalysis Goodput Expense Calculator
Conclusions, Limitations of this Work, and Comments on Future Research Directions
This article’s intention was to provide real-world data to backup up intuition that both users and providers have built on the importance of running reliable, performant, and easy-to-use clusters. In other words: even in scenarios where pricing per GPU-hour is equal, there are always hidden costs across Storage, Network, Control Plane, Support, Goodput, Setup, and Debugging expenses. We demonstrate that in three real-world scenarios, Hyperscalers can be over 10% more expensive on a TCO-adjusted basis vs Gold-tier providers, even when holding GPU-hr pricing equal. And we demonstrate that silver-tier neoclouds can be over 15% more expensive when holding GPU-hr pricing equal.
Readers who are interested in using our GPU Cluster TCO Calculator and Goodput Calculator with their own inputs to make informed purchasing decisions are encouraged to contact us at clustermax@semianalysis.com. Feedback on the methodology is also welcome.
Going forward, we intend to apply this methodology to all ClusterMAX rated providers, specifically during our upcoming ClusterMAX 3.0 testing this summer. We also intend to collect real-world data on MTBF. To that end, if you are a customer of a neocloud that tracks failure data manually or through an automated system, dmesg logs, or are willing to contribute data in an anonymous, aggregated manner, please reach out! Even intuition on past experience mentioning failures/day or failures/week and cluster size is helpful. We would love to hear from you. Again: clustermax@semianalysis.com.
Beyond the scope of ClusterMAX, we continue to work with users running large clusters to compare performance differences between neoclouds. Specifically, the NVIDIA DGXC benchmarking repo and related NCP/DGXC certification process reveals that even providers following NVIDIA’s reference architecture can experience performance differences on different workloads. This is especially true when comparing the interconnect network for collective-bound operations, which itself is becoming more and more common due to the adoption of wide EP, PDD, and other parallelism techniques that take advantage of massive interconnect bandwidth on both the scale up and scale out domains.
On pricing, all inputs for this analysis and defaults displayed on the calculator are to be considered as a point-in-time analysis based on historical pricing data from August, 2025. We track neocloud pricing of all major GPUs globally for different cluster sizes and commitment terms in our GPU Pricing Data. And as we described in a recent article, those prices are going up. We continue to update this data series over time for our subscribers. This is done on a daily basis for spot instance pricing, and a monthly basis for cluster pricing.
The functionality of fault tolerant frameworks needs to improve. Today, TorchFT is the only open source option and is not widely adopted for training. Meanwhile all three options we explored in this article (TorchFT, Hyperpod Checkpointless, and TorchPass) come with tradeoffs on communications overhead, memory overhead, handling hard failures, and cost of idle nodes. This leaves fault tolerant training as a secret sauce available to frontier labs or those willing to pay for a software license. Meanwhile, fault tolerant inference is the standard for single 8-way systems, while it is being actively built into PDD and WideEP frameworks such as NVIDIA Dynamo, including at the KV Cache offloading level with frameworks such as LMCache and Mooncake.
Next we will close this article with a small update to ClusterMAX.
ClusterMAX 2.1 Update
This update adds a small set of new providers to the ClusterMAX rating system. This is not a full re-test of all providers. We are actively conducting ClusterMAX 3.0 testing with a focus on the latest and greatest: B300 and GB300 with 800Gb networking.
Without further ado:
Source: SemiAnalysis ClusterMAX 2.1 Ratings (April 2026)
Core42
Core42 is a division of G42 with a massive presence in the UAE and a growing presence in the US. With the backing of MGX, and the sister company Khazna Datacenters, all of whom are intimately involved with Stargate UAE, the group means business. Back on the US side, Core42 is also making moves. They have established small sites in San Jose, Grenoble, and 70MW of MI300X in Buffalo (via Terawulf). During our testing we were provided with both slurm and kubernetes clusters from that site, using AMD MI300X GPUs, and crucially some Broadcom Thor-II NICs. This was the first cluster we’d gotten with Thor-II during clustermax testing, and it was a battle. Every single container image we had previously tested on AMD clusters, and nearly every AMD base image they publish to rocm repos such as vllm, sglang, torchtitan, and MoRI are all built with AMDs own Pollara NICs. This meant downloading tarballs from Broadcom’s driver search website, scp’ing the files over to the cluster nodes, and rebuilding containers from scratch. A headache to say the least. Notably, the Core42 engineering team was ready to help the entire way, from troubleshooting these driver recipe issues to debugging slurm user errors on our side it was a really strong showing of hands-on, proactive technical support. If Core42 launches some modern GPUs in the US or starts relaxing the compliance restrictions they have in place that prevent us from testing in the UAE sites (or anyone from outside UAE renting GPUs at those sites) we expect Core42 to quickly rise into the silver tier and beyond.
BitDeer
We conducted some initial testing with BitDeer at their Malaysia site using 2 nodes of GB200 NVL72. We were limited on time and could not get the IMEX domain configured correctly to confirm the NVLink was setup for intranode communication on the NVL72 domain. We did run some training jobs and figure out the console successfully. With many more GPUs coming online this year, we are excited to see more from BitDeer in terms of orchestration software, monitoring, reliability and support for the big clusters they have announced they’re building.
FPT Smart Cloud
We got the chance to test FPT Smart Cloud back in November 2025. FPT is based in Vietnam and at the time had H100 and H200 available. They use Soperator from Nebius for orchestration, and the cluster was well configured. We noticed some poor performance on the VAST Storage. The monitoring experience was quite strong, some of the best custom DCGM dashboards we have seen with Loki used for logging and analysis. Unfortunately, FPT is held back from the silver tier due to some serious security issues. Our testing showed that PKeys and SAKey were not configured correctly, allowing us to see every other endpoint on the network (i.e. every other customer).
Radiant/Ori
Radiant was announced recently after Brookfield acquired Ori, a Saudi Aramco backed neocloud with H100s and H200s in London and Dallas. When we tested with Ori on two occasions in the fall, we saw some quick progress but not enough to get to silver. Ori fell victim to the exact same issues as FPT, with PKey and SAKey not configured correctly. In addition, during our first round of testing, we were unable to run nccl-tests at full bandwidth on kubernetes due to an issue with the NetworkOperator picking up NICs that were intended to be for the frontend but were named/configured incorrectly to be used for NCCL. Finally, DCGMI health watches are not enabled by default, and there is no automated background health check program. Our testing of a simple hardware failure simulation showed that the system did not trigger any automated alerting or node replacement over an 18-hour window. The team is targeting Q2 2026 for the release of monitoring dashboards, and seems well on their way to having the funding they need to build Blackwell clusters with comprehensive slurm, kubernetes, monitoring and reliability features customers expect.
Others
We add coverage for Tatra Supercompute (Slovakia), QumulusAI (Texas, Oklahoma), Boostrun (Seattle, Texas, North Carolina), Moonlite (reseller/operator) Vessl (marketplace from Korea), SK Telecom (also Korea), and BytePlus (division of ByteDance) as significant players worth tracking as they bring capacity online this year.
Behind the paywall we will now dig into how Goodput Expense is impacting real companies. Specifically, we will walk through and analyze the margin of some inference endpoint providers, conducting a sensitivity analysis that considers Goodput’s impact on these margins.