

Rubin is the first platform co-designed across six products for the agentic era: Rubin GPU, Vera CPU, NVLink 6 Switch, ConnectX-9, BlueField-4, and Spectrum-6. Today we are publishing the first verified agentic inference results for Rubin, measured on our agentic inference benchmark, AgentX. Even on early pre-release software, the results already show why extreme co-design was necessary.
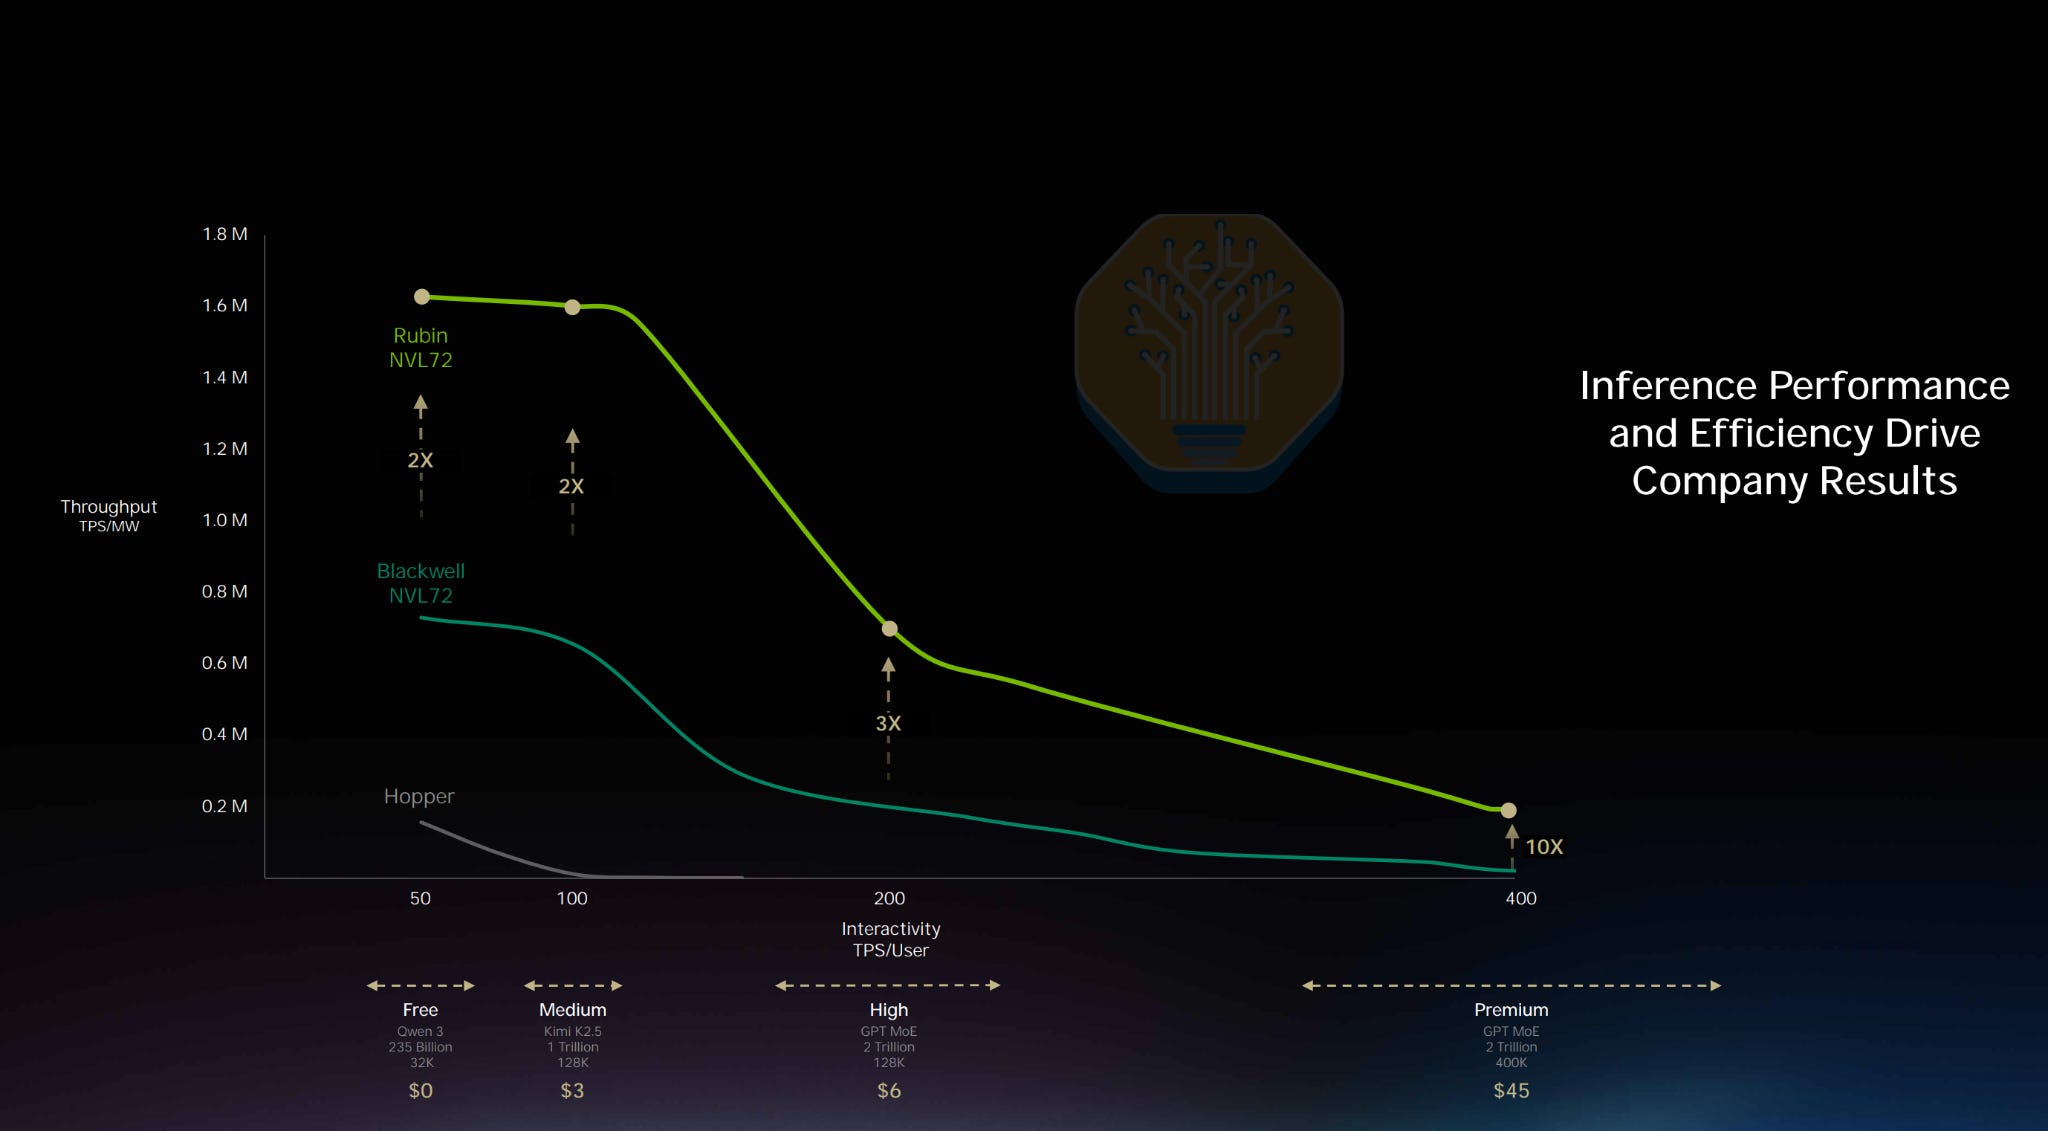
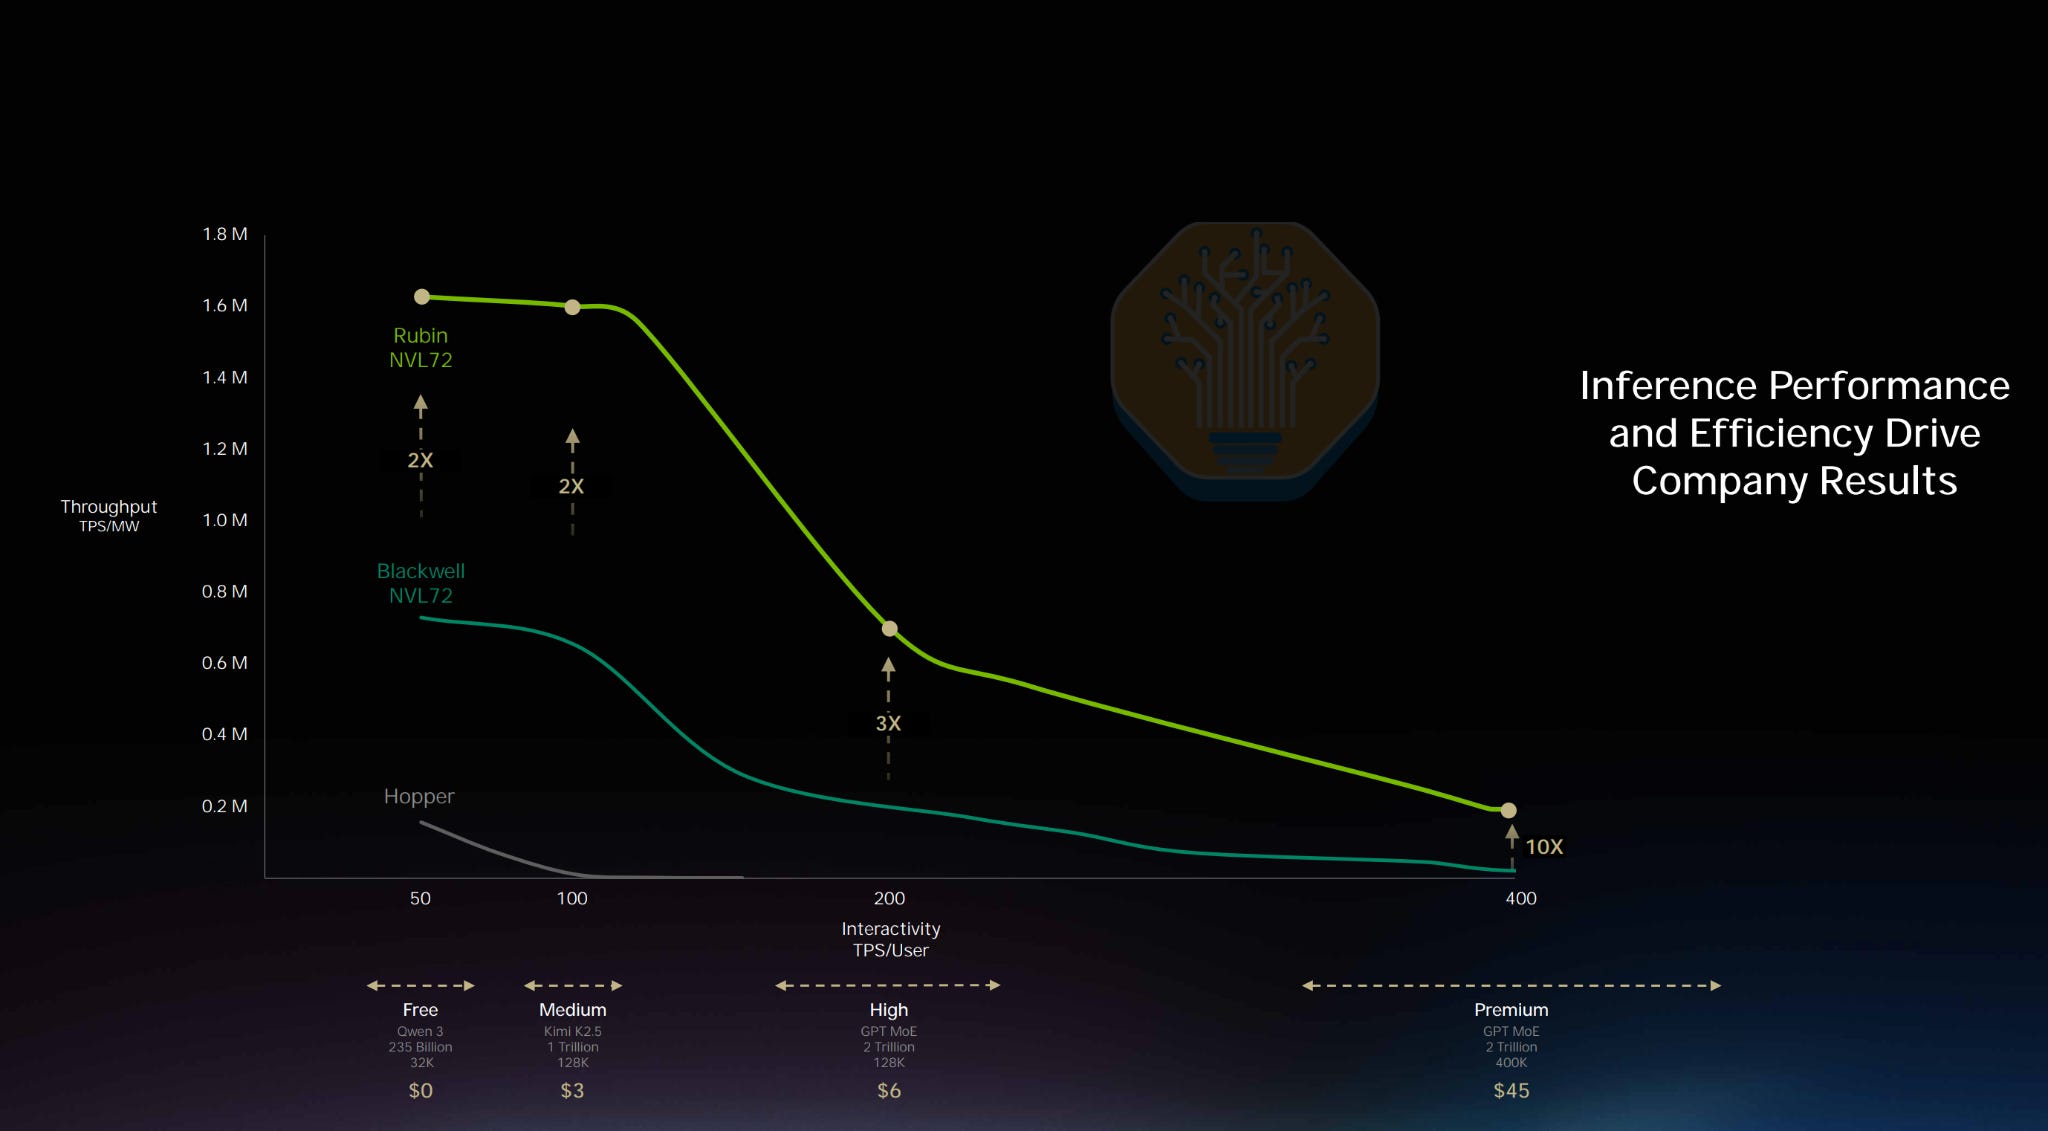
At GTC 2026, Jensen presented this graph that VR NVL72 achieved 3x performance per MW compared to Blackwell on O(1-3 Trillion) parameter model around 200 TPS. But when compared to the real world performance of Rubin already on prelease software, we are already seeing up to 7x better token throughput per megawatt. Jensen needs to stop sandbagging his performance claims at GTC. The last time he did this at GTC 2024, when he claimed GB200 NVL72 would deliver 30x Hoppers performance, but when we tested, it was 98x better performance than Hopper.
Our estimates on the performance results show that even on early software builds, Rubin can earn over 2x more profit per gigawatt than the Blackwell platform. As the Rubin software stack and kernel libraries mature, and as the developer community builds experience optimizing for Rubin, we expect that gap to widen further.
We evaluate the performance using the industry standard agentic inference benchmark scenario called AgentX. This replays real world agentic traffic across our fleet of thousands of chips. The results can thus be holistically referenced by actual inference providers and hyperscale AI labs to decide which chips are most efficient in what scenarios.
Our benchmark has been widely reproduced, validated and/or supported by almost every major buyer of compute from Google Cloud to Microsoft Azure to Oracle, to Meta and many more. Furthermore, it has the support of the ML community including from vLLM, LMCache, SGLang, PyTorch, Huggingface and the support of major labs like OpenAI, MiniMax, ZAI, Qwen, Moonshot Kimi, etc.
Thank you to Jensen Huang, Ian Buck, Nick Comly, Kedar Potdar, Rohit Nagraj, and the Mainland China TensorRTLLM Team for helping on doing next gen Rubin software bring up and helping verify our agentic benchmark results.
Star the InferenceX GitHub repository if you find the open-source benchmark and data useful!. InferenceX is the only inference benchmark in the world to have TPUv7, NVIDIA, & AMD and soon SambaNova & Trainium. Due to how realistic AgentX scenario is to real world agentic inference workloads, AMD has committed to collaborating on MI455X UALoE72 too.
Agentic Workload Primer
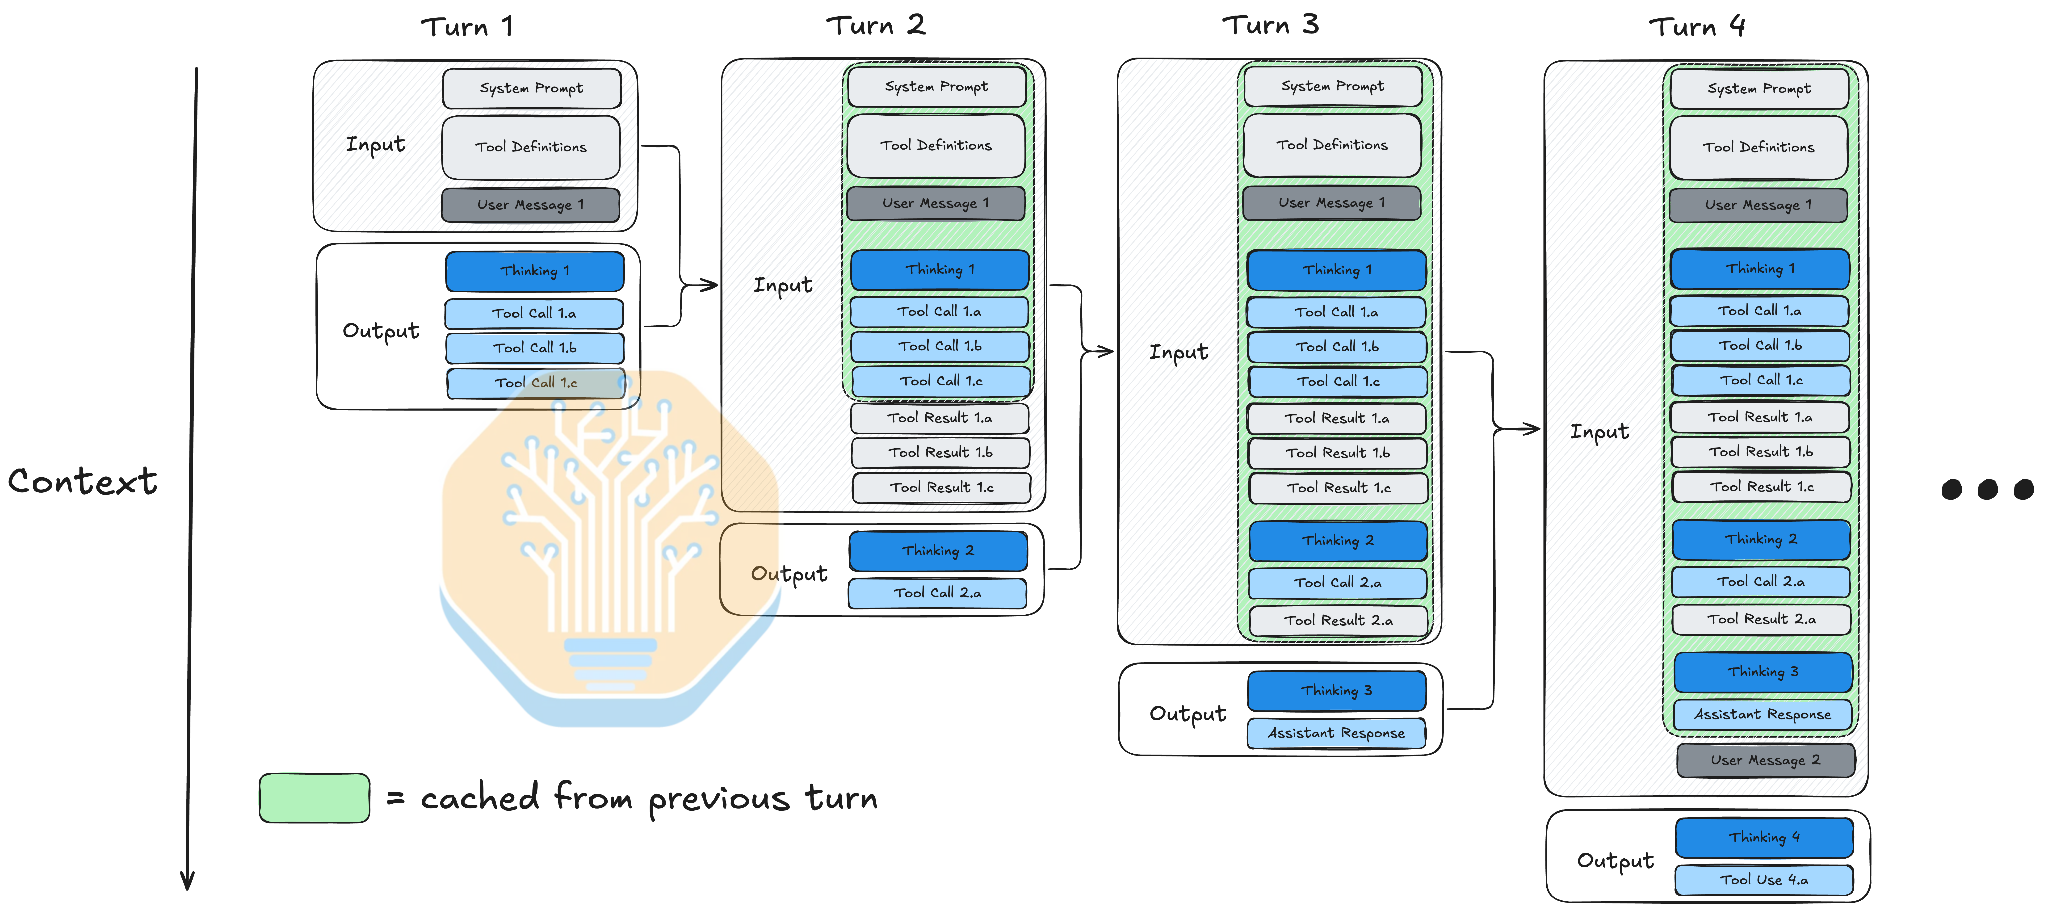
At a high level, an agentic workload is characterized by four elements:
Multi-turn: a session includes tens or hundreds of interactions between the user and assistant, compared with a handful in a chatbot scenario. These workloads combine long contexts and high prefill reuse with sub-agent bursts and numerous tool calls.
Long context: system prompts, tool definitions, and the large number of turns make context accumulate quickly.
High prefix reuse: since the conversation progresses linearly, where output from turn n-1 is concatenated to turn n (typically), most context can be served from KV cache rather than recomputed (this depends on the amount of storage available to store KV tensors). As n grows, the ratio of cached input relative to uncached typically tends towards 1.
Sub-agent bursts: a session launches multiple short-lived sub-agents with fresh context, which create bursty KV-cache patterns.
Read more about the methodology in our AgentX article.

Rubin Amazing Performance per TCO
Performance per total cost of ownership (TCO) is one of the most important angles in which to evaluate AI accelerator performance. In the charts below, the Y-axis is total tokens per $1 TCO. Practically speaking, this tells an inference provider how many tokens they can generate for every dollar they spend on compute. This is calculated by normalizing the total throughput for a scenario by the all-in serving costs ($/chip/hr times number of chips utilized to serve).
On InferenceX, we provide a few different TCO figures for each SKU which come from the SemiAnalysis AI Cloud TCO Model. The scenarios offered by default are as follows:
Owning at Large Hyperscaler Volume: the modeled cost per GPU-hour to own and operate the hardware, including server and networking capex spread over the assumed useful life, colocation, power, and cost of capital. This assumes hyperscaler purchasing and financing terms, including volume discounts and custom server builds.
Rent - 3 Year Commit: the market price per GPU-hour paid to a cloud provider for a three-year committed reservation, based on SemiAnalysis rental pricing surveys.
Users may also edit the compute costs in our calculator to match the cost they are paying. For more figures such as on-demand market rental rate and shorter term rental commitments can be found in the AI Cloud TCO model which comes from our monthly market survey of 100+ GPU customers, GPU neoclouds, and hyperscalers.
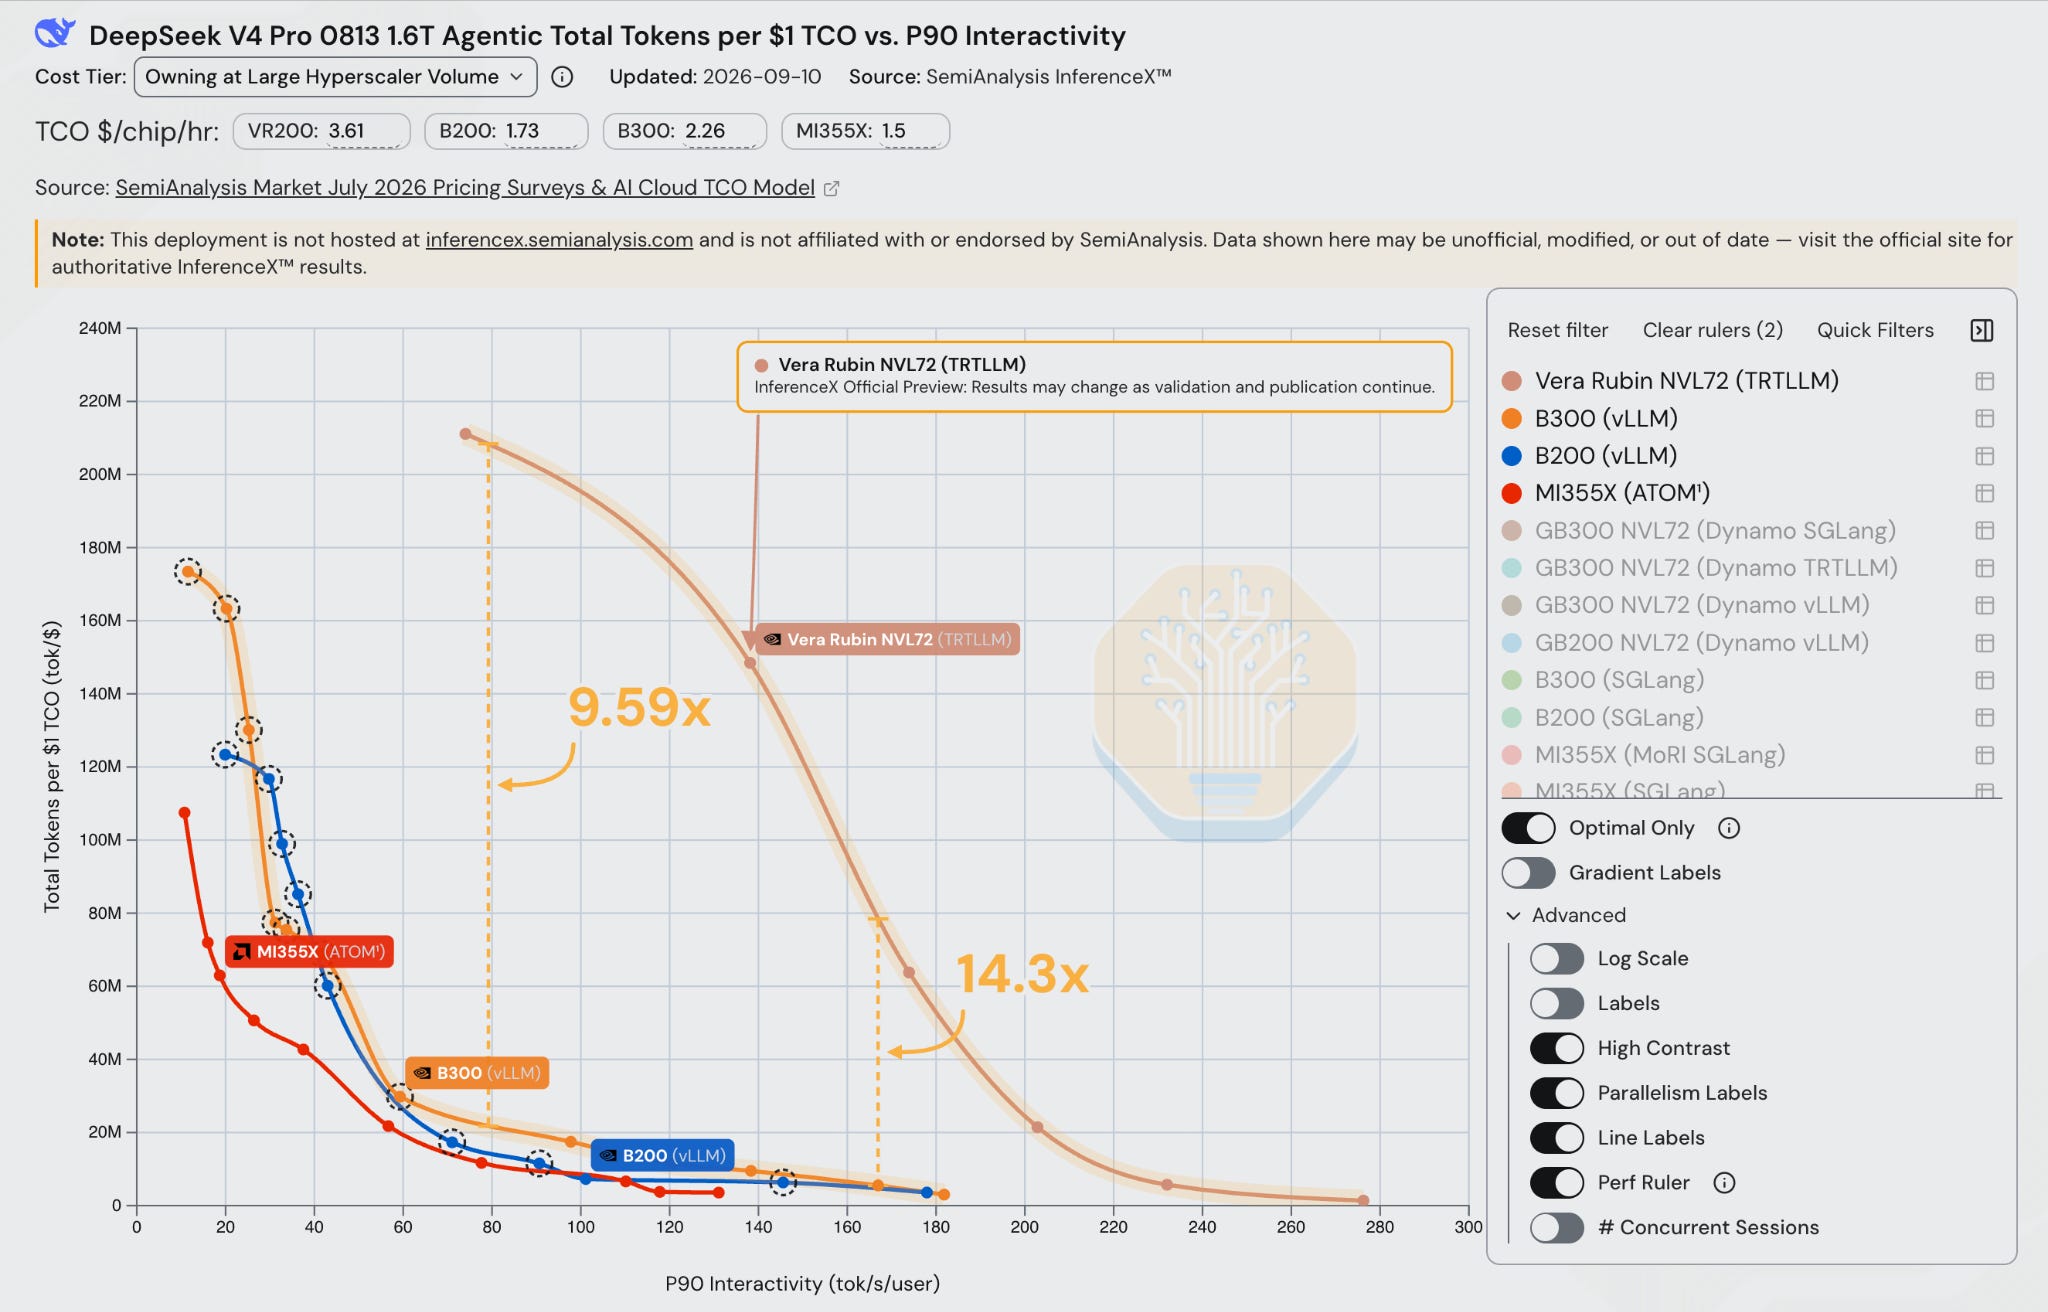
Vera Rubin is a substantial improvement over GB300 in terms of performance per dollar. At 170 TPS, On Apples to Apples TRTLLM NVFP4 Dense, Vera Rubin NVL72 delivers ~67x the total throughput per TCO of GB300 Dynamo TRTLLM under the owning cost assumptions. Furthermore, at the part of the frontier where most providers would actually serve this model (60-100 TPS), Vera Rubin achieves between 1.4x and 3x the throughput per TCO compared to the latest and greatest GB300 TRTLLM configuration.
Our rack uses the production SKU of 2300W TDP & 1.5TB of CPU LPDDR5X per compute tray. We chat more about why NVIDIA had to cut their Vera memory in half in our accelerator and memory model. For this article, we will be talking about the TRTLLM Rubin performance but we expect later articles to also include vLLM Rubin & SGLang Rubin performance on agentic inference workloads.
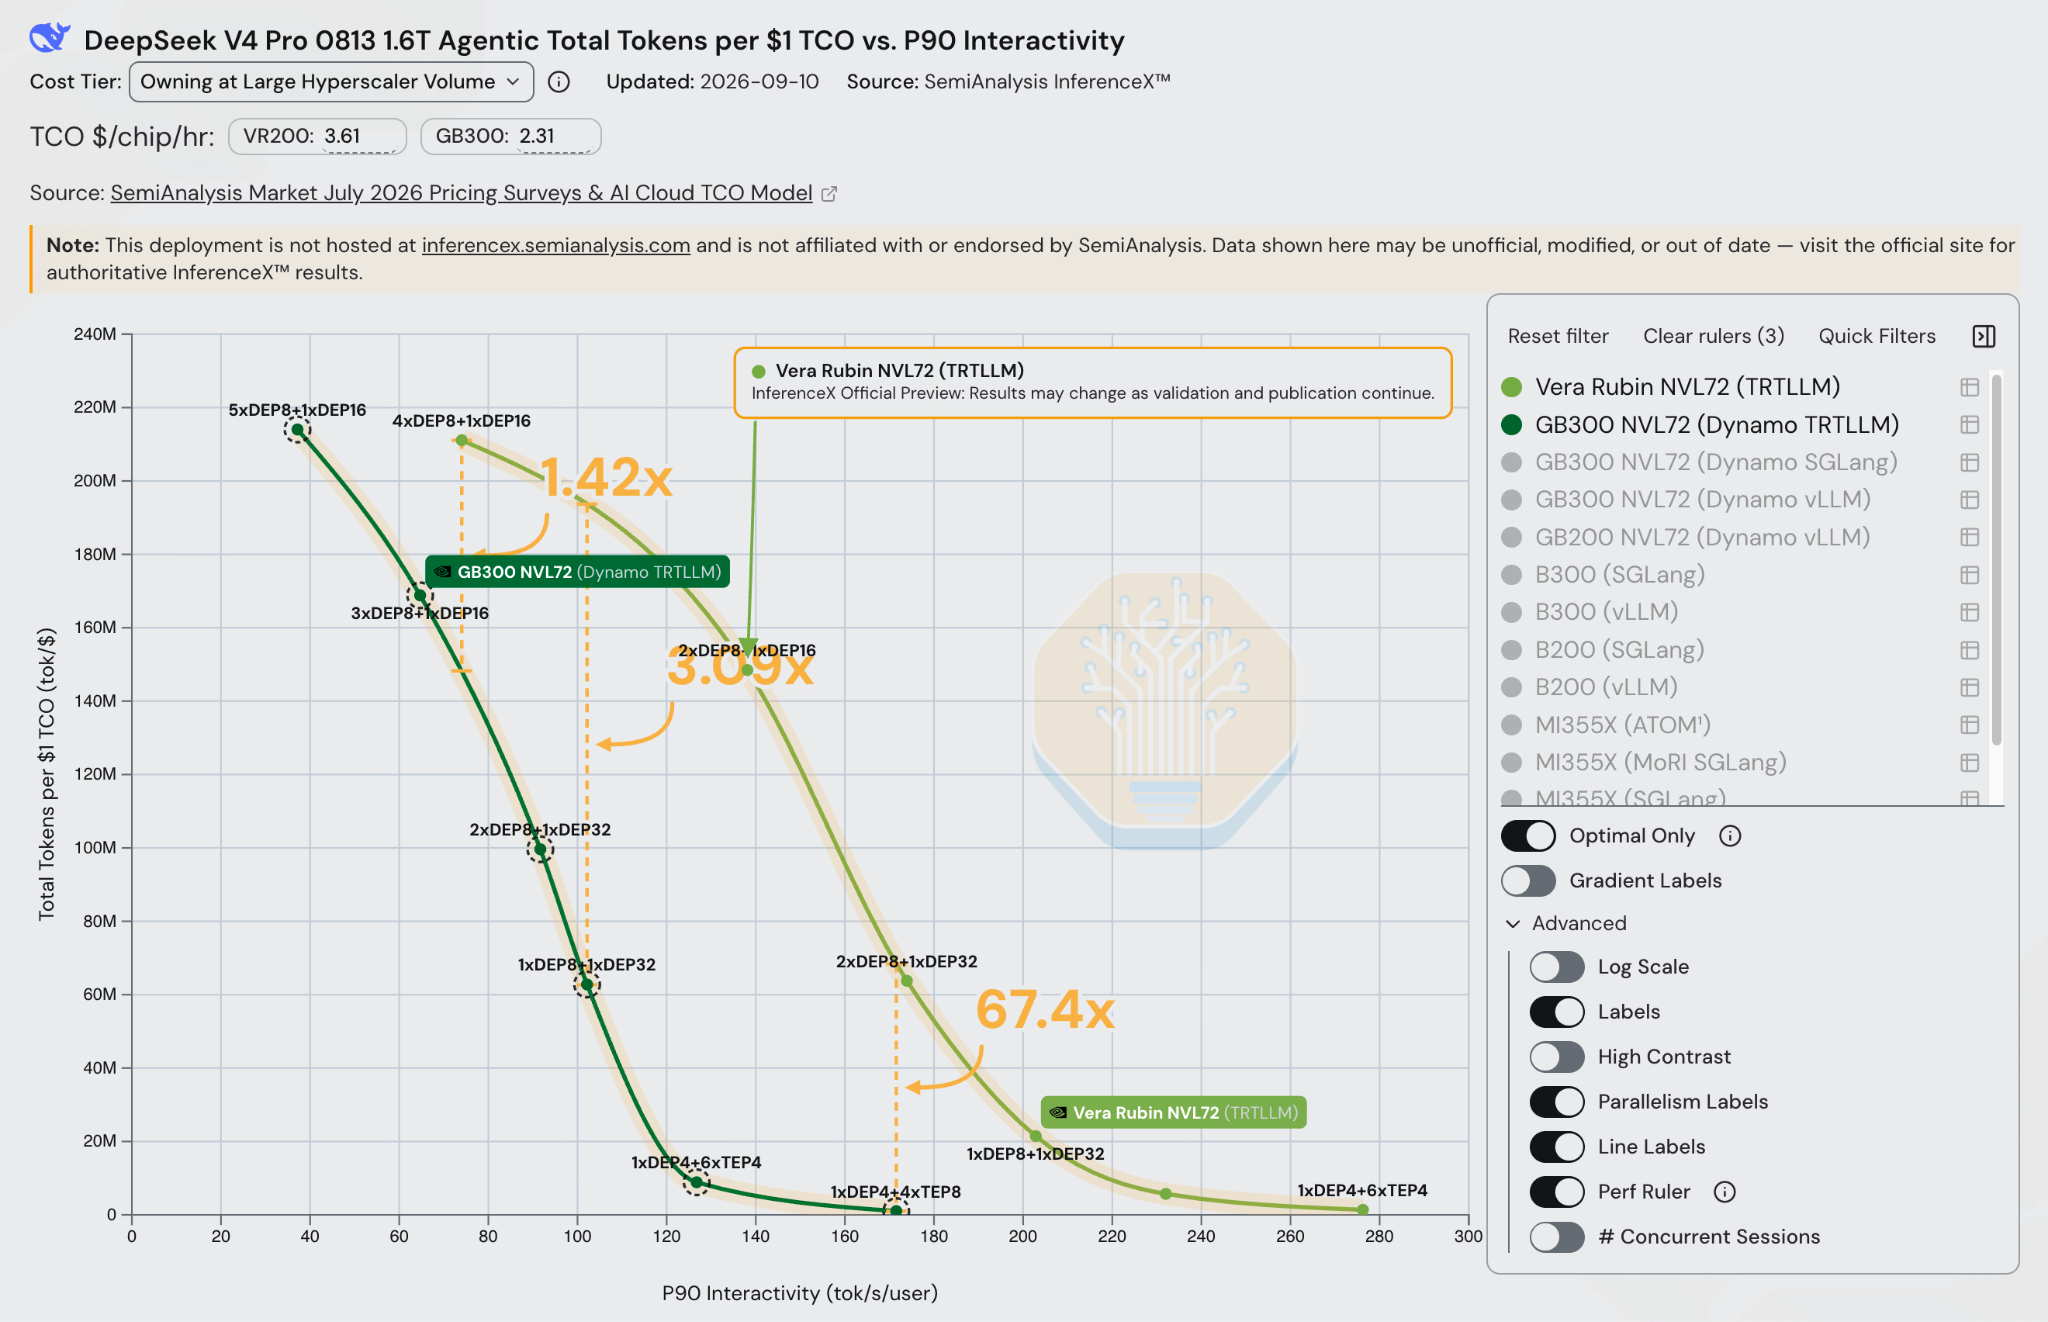
Vera Rubin achieves approximately 61% higher maximum P90 interactivity than GB300 Dynamo TRTLLM, reaching 276.24 versus 171.53 P90 TPS However, when using the open-source SGLang stack, GB300 can achieve similar interactivity as Vera Rubin.
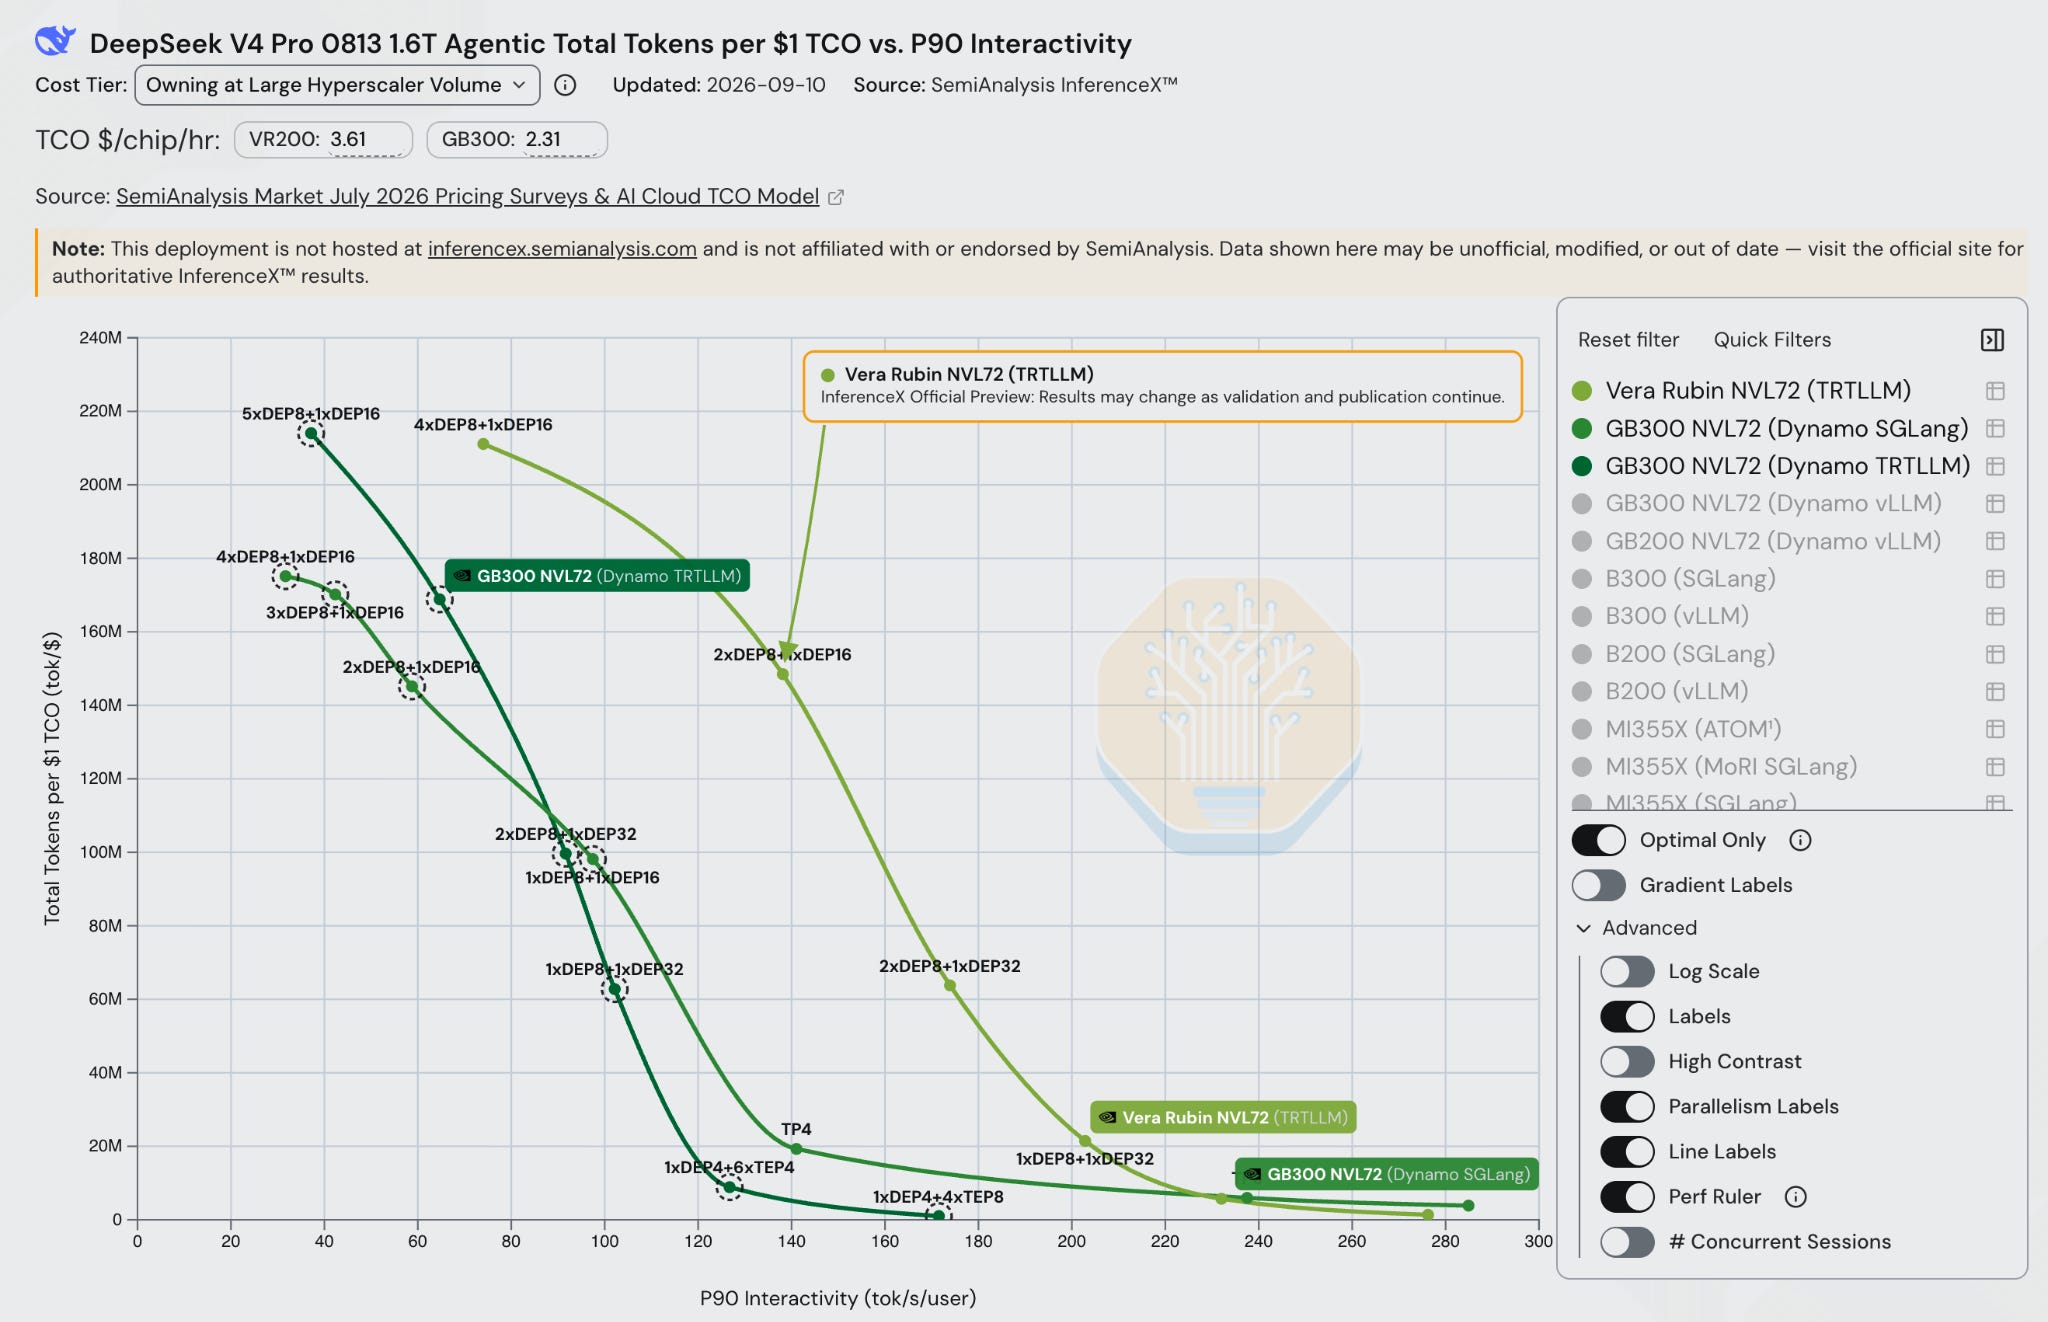
We recognize that this is an early pre-release TRTLLM software release and that performance will only get better, especially at the “ends” of the frontier (ultra-high throughput/ultra-low latency). Driving the frontier forward and highlighting improvements over time is the ultimate goal of InferenceX. Read more about this in our previous articles on InferenceX:

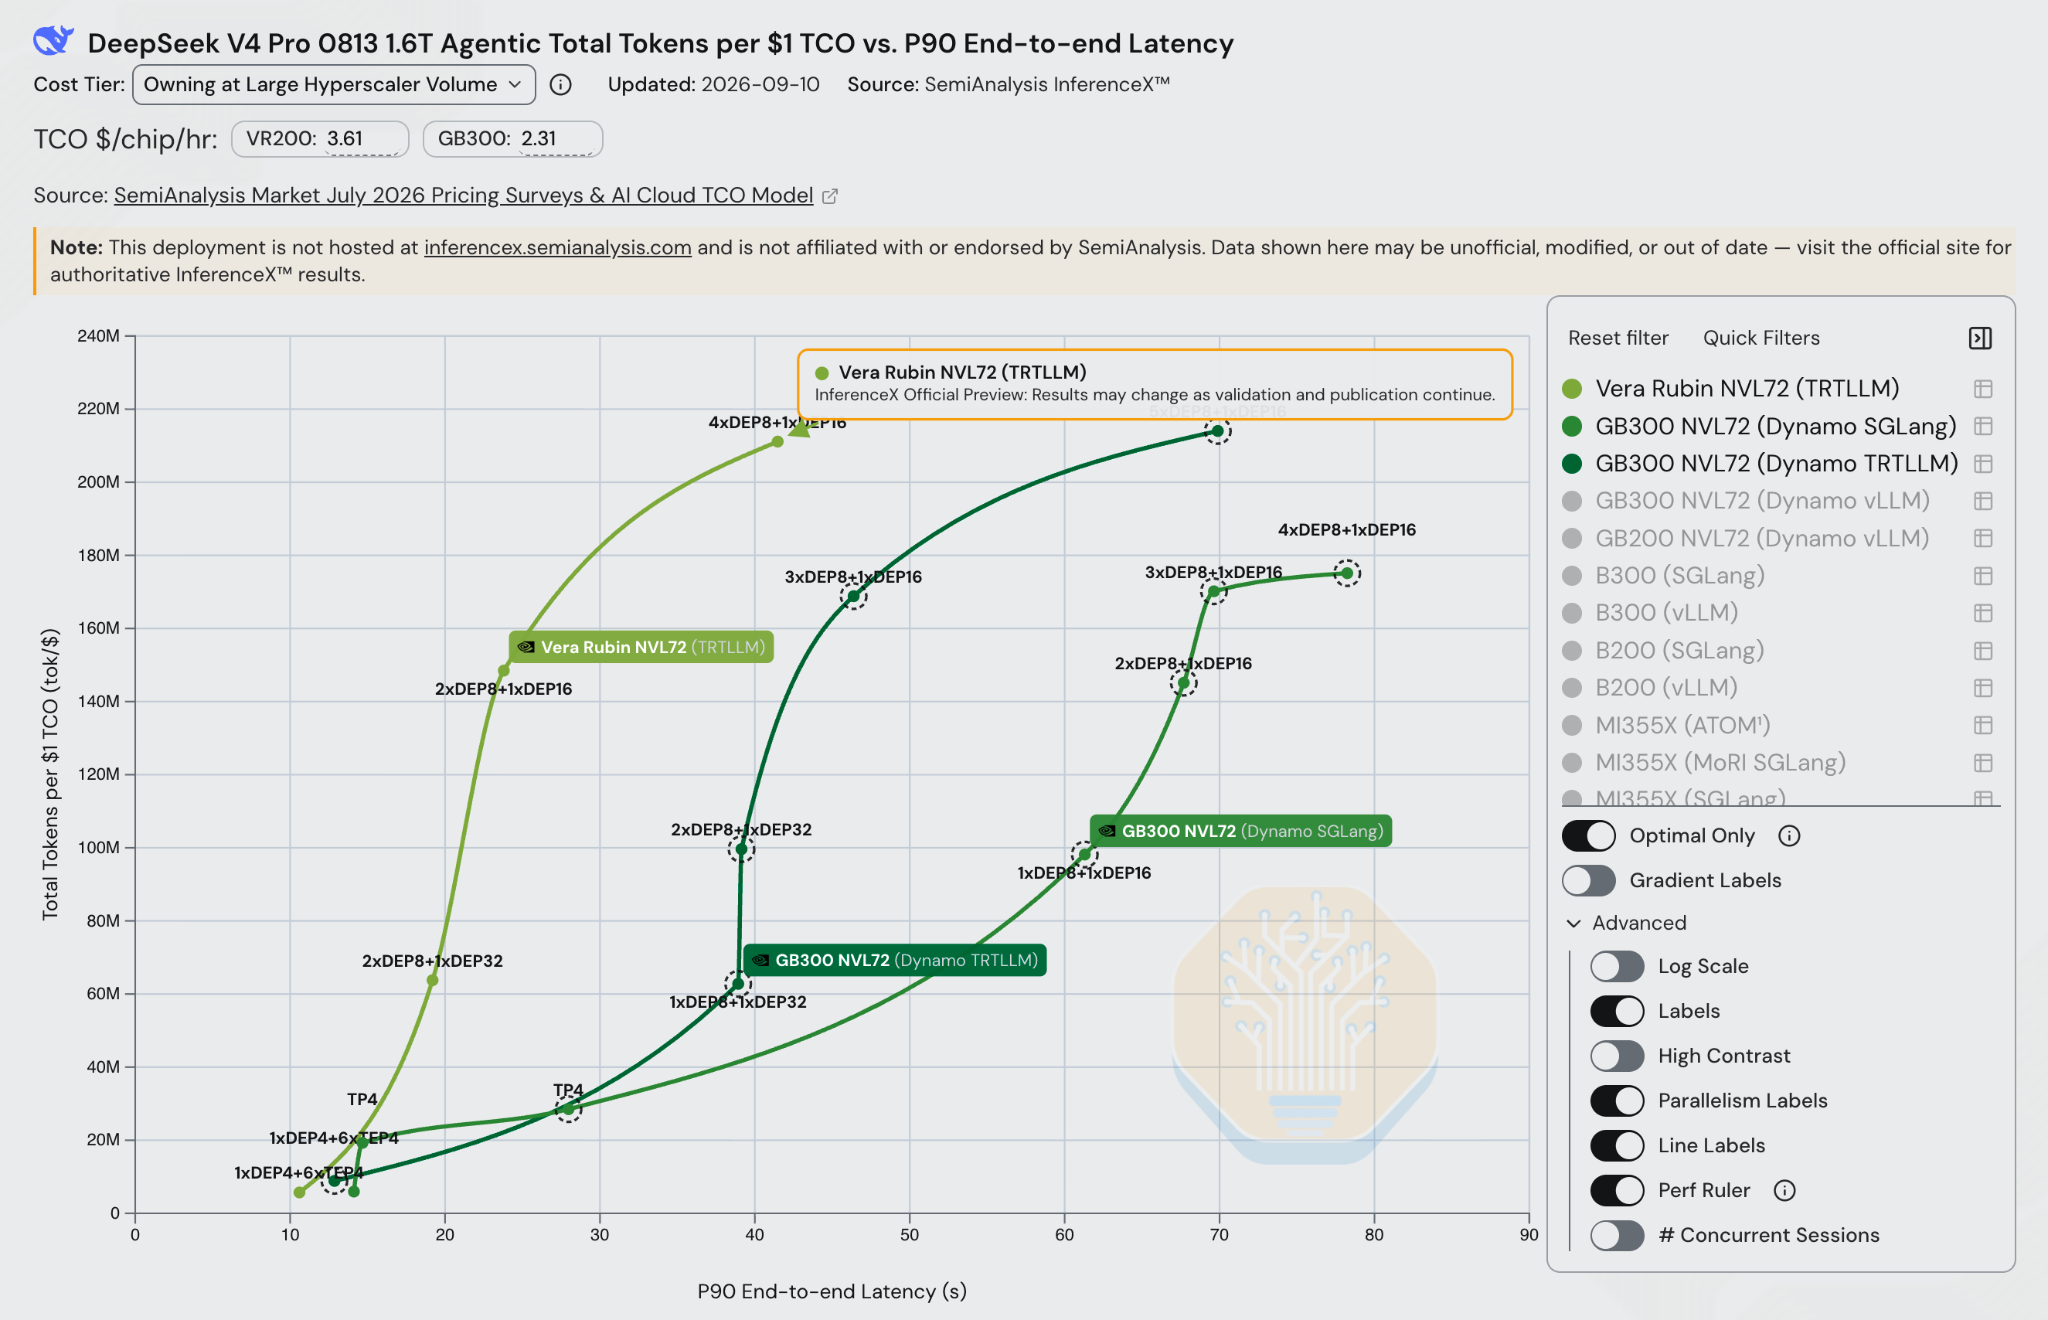
Also note that Vera Rubin achieves significantly better P90 E2E latency in higher throughput scenarios. While interactivity (TPS) is often the headline for performance benchmarks, latency metrics like TTFT (time-to-first-token) and E2E latency are also important and one of the de-factor SLA standards in production serving.
When we consider the 3 year rental cost which in July 2026 was over $8.5/hr/chip for Rubin and $5/hr/chip for Blackwell Ultra NVL72, the upgrade is still more than justified. At 80 TPS P90 interactivity, Vera Rubin can produce 62% more total tokens for the same rental TCO. Across the higher interactivity portions of the frontier, Vera Rubin realizes up to 16x more tokens per 3 year rental TCO.
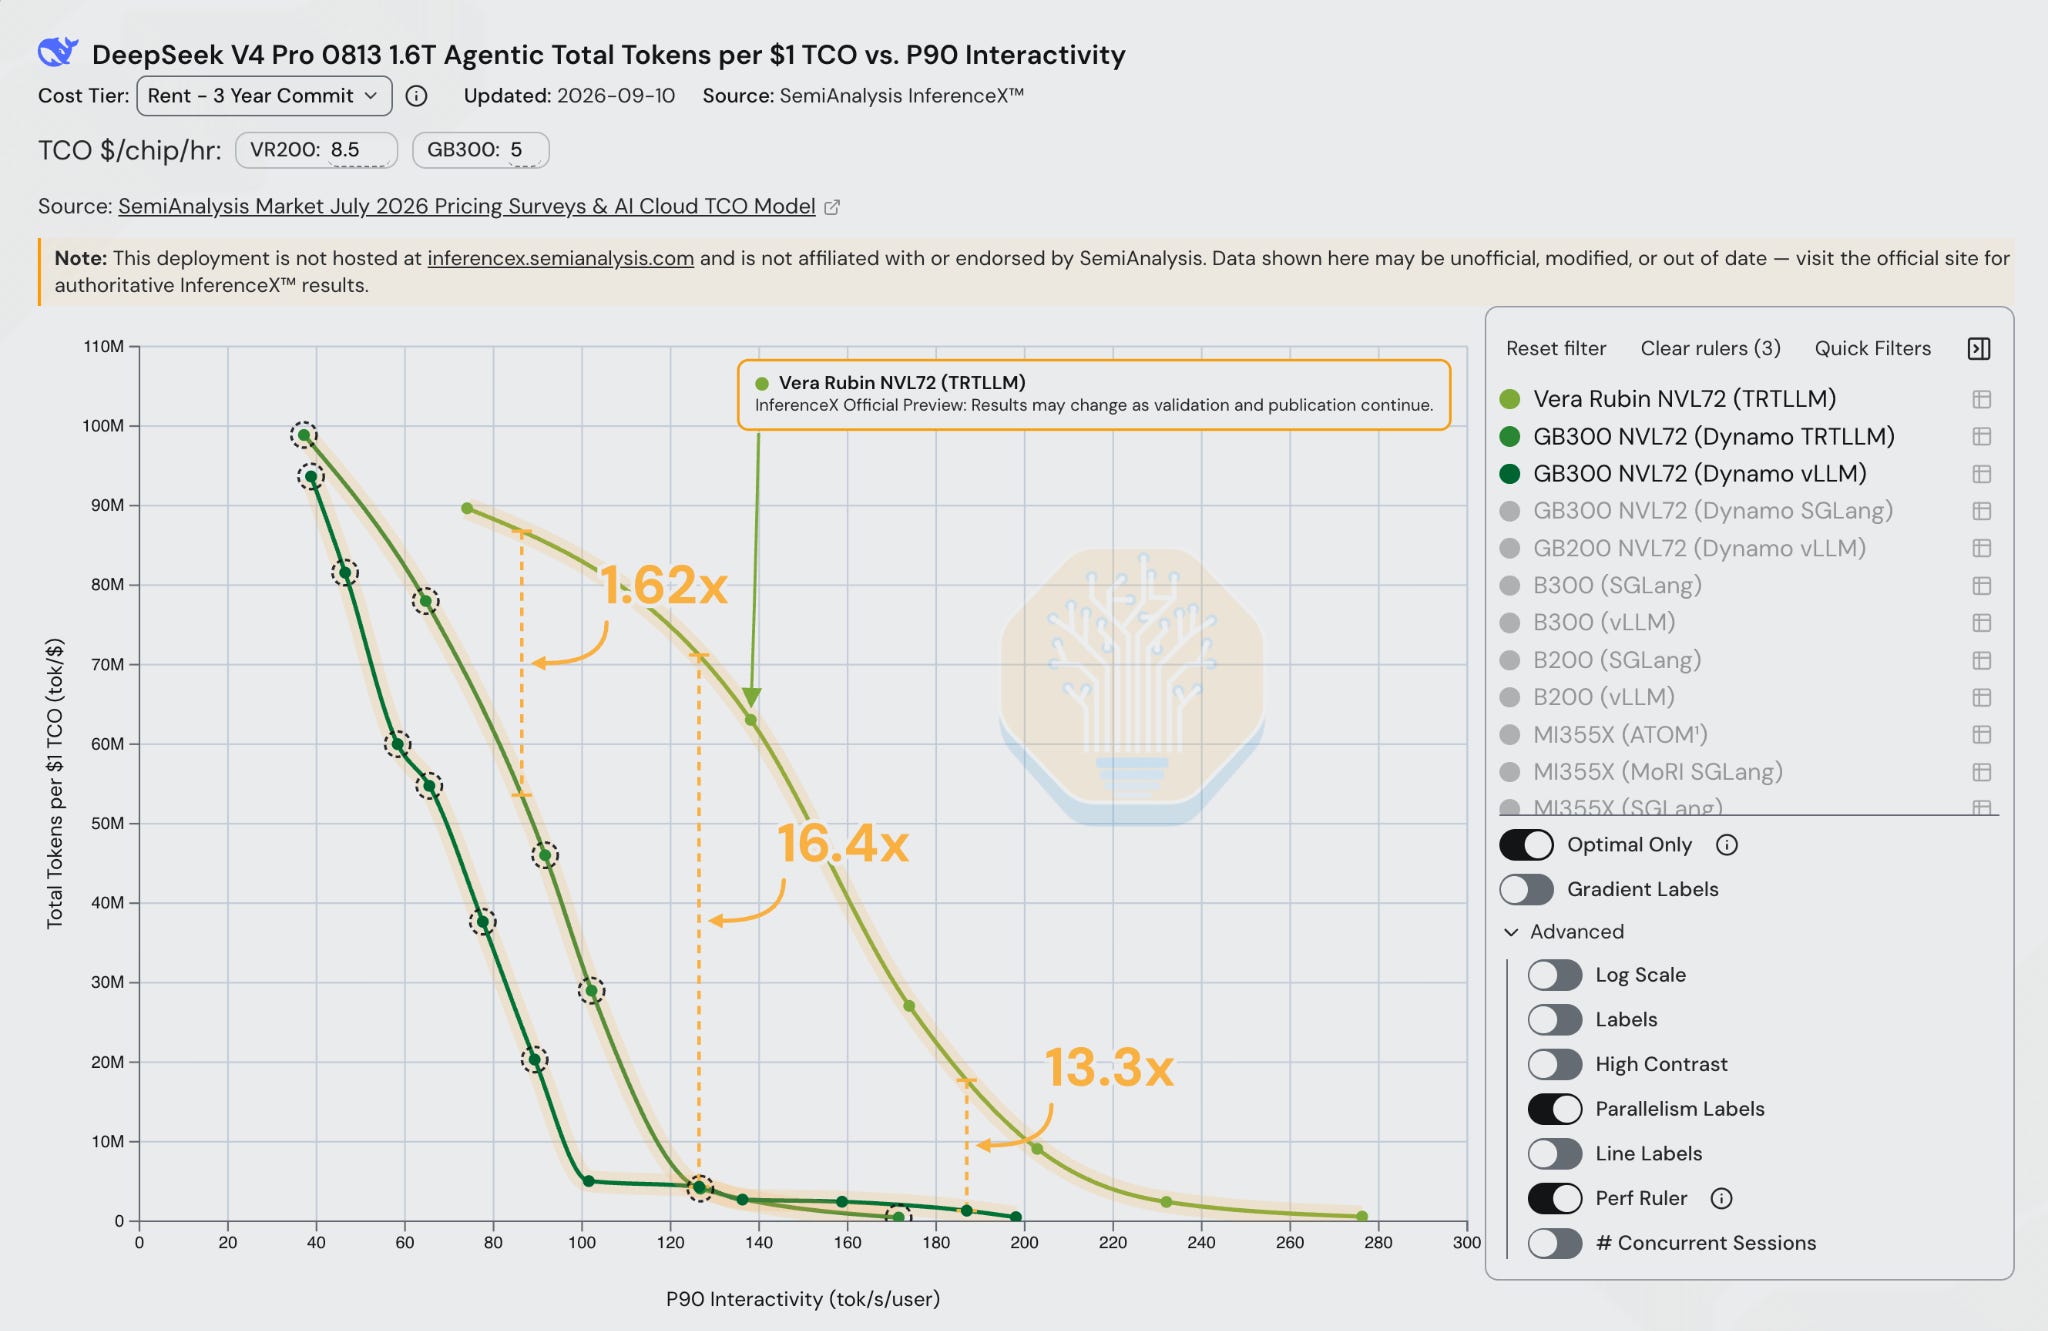
The lesson here is quite simple: if you have the money to buy or rent a VR NVL72, you should – it will generate significantly cheaper tokens than the next leading accelerator and thus make you significantly more money. As Jensen infamously said “the more you buy, the more you earn”.
When compared to single-node Blackwell and MI355X, the performance per TCO gap becomes even wider across the entire curve. At an 80 TPS P90 SLA (which again, is quite realistic for this model), an inference provider can serve 10x more tokens per USD than with B300 when using the owning TCO figure.
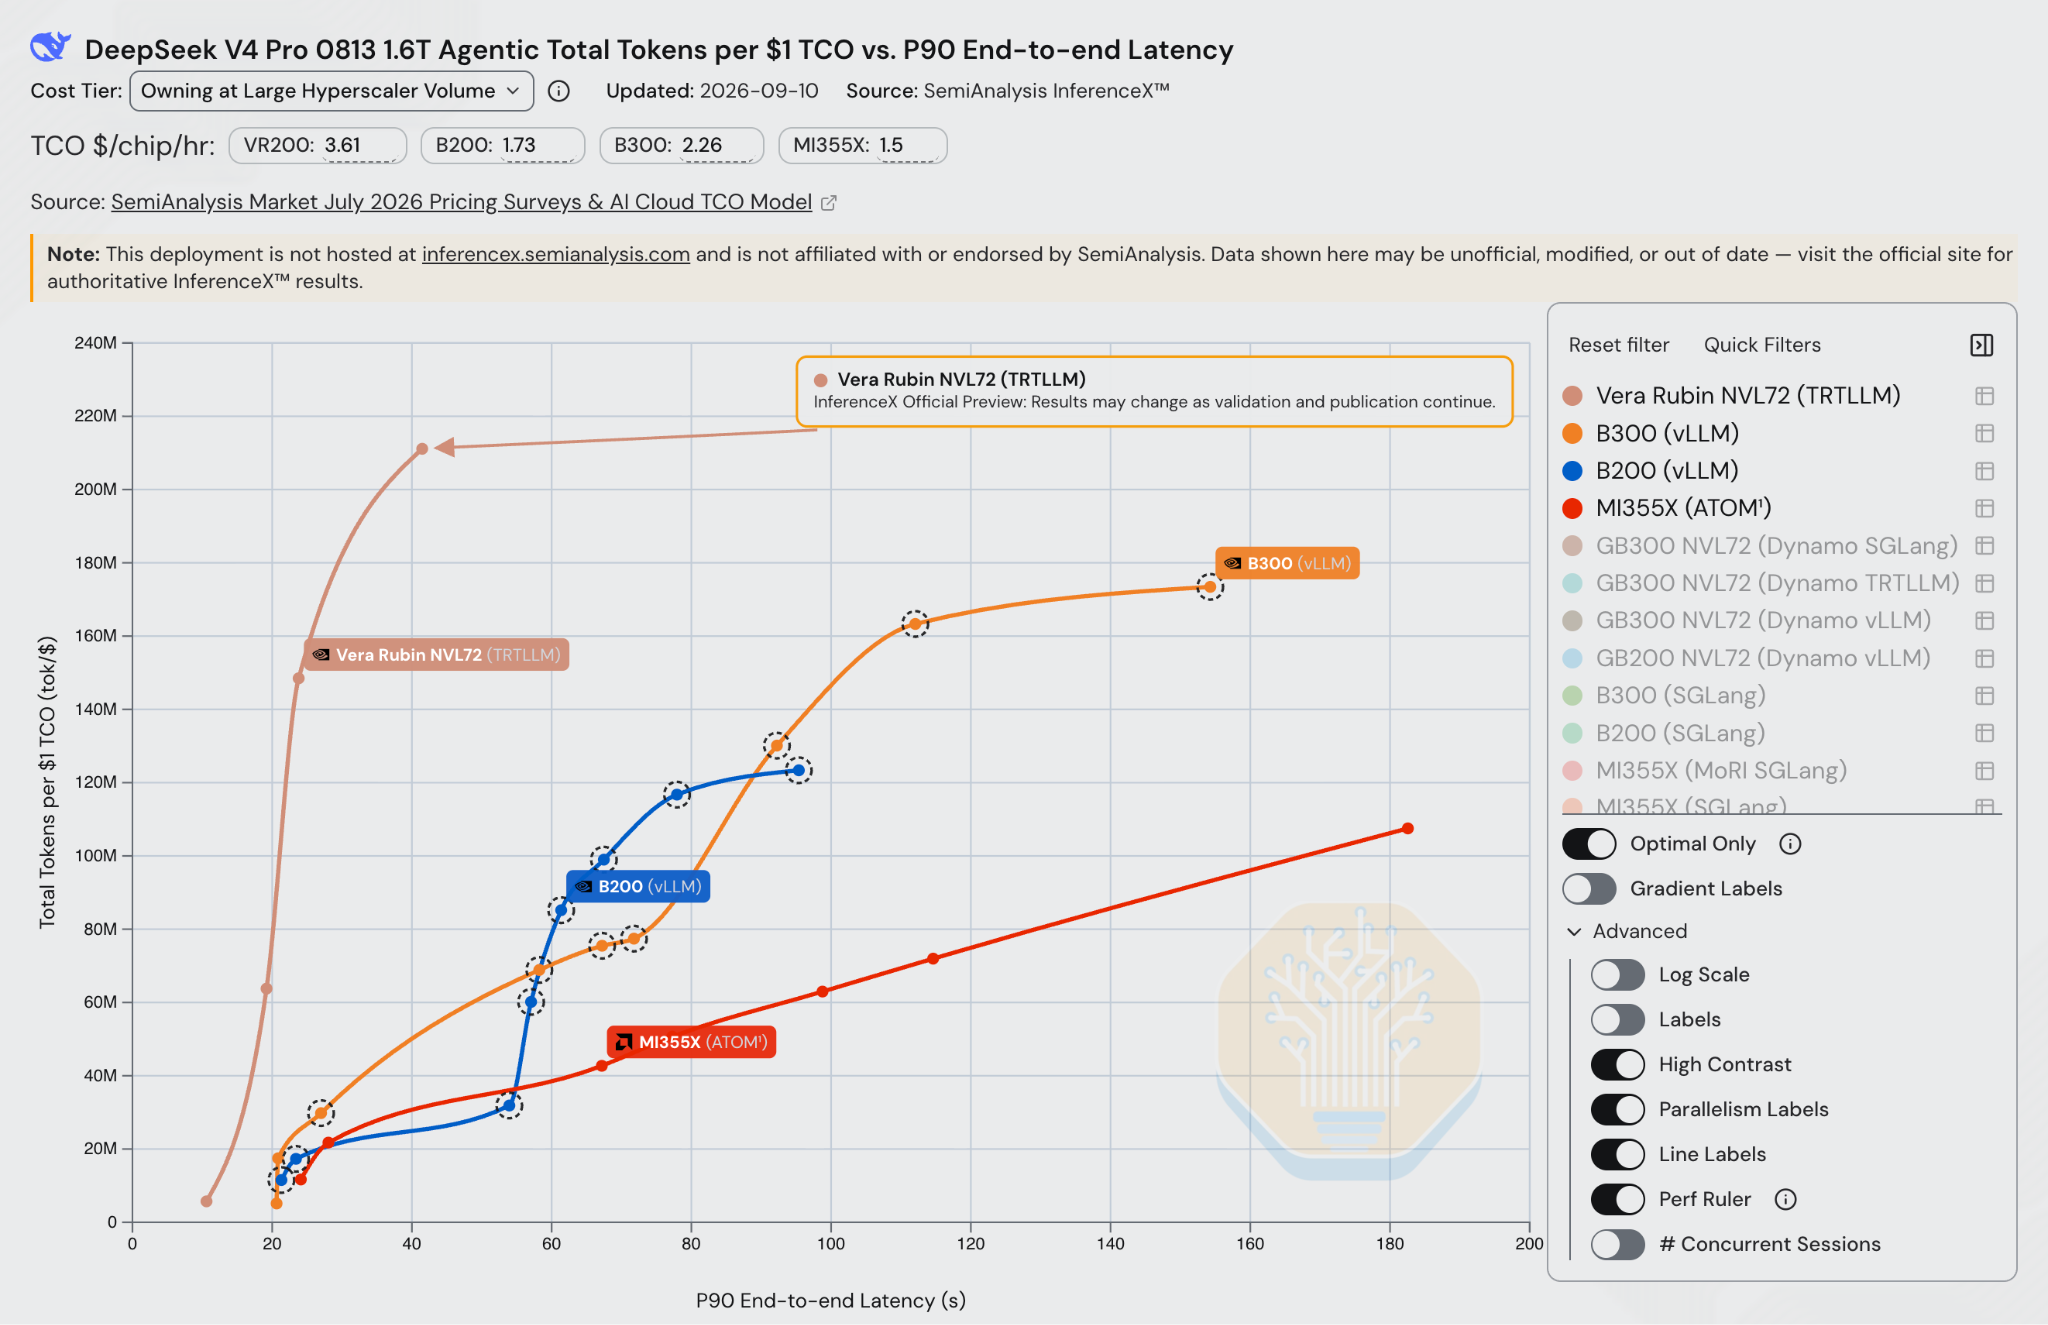
The advantage also extends to P90 end-to-end latency. As shown below, at 60 million tokens per dollar of TCO under the owning assumptions, Vera Rubin achieves a P90 end-to-end latency of approximately 20 seconds, compared with 60 seconds for B200/B300 running the latest vLLM serving stack. At 160 million tokens per dollar, the P90 end-to-end latency gap widens to approximately sixfold: 20 seconds for Vera Rubin versus 120 seconds.
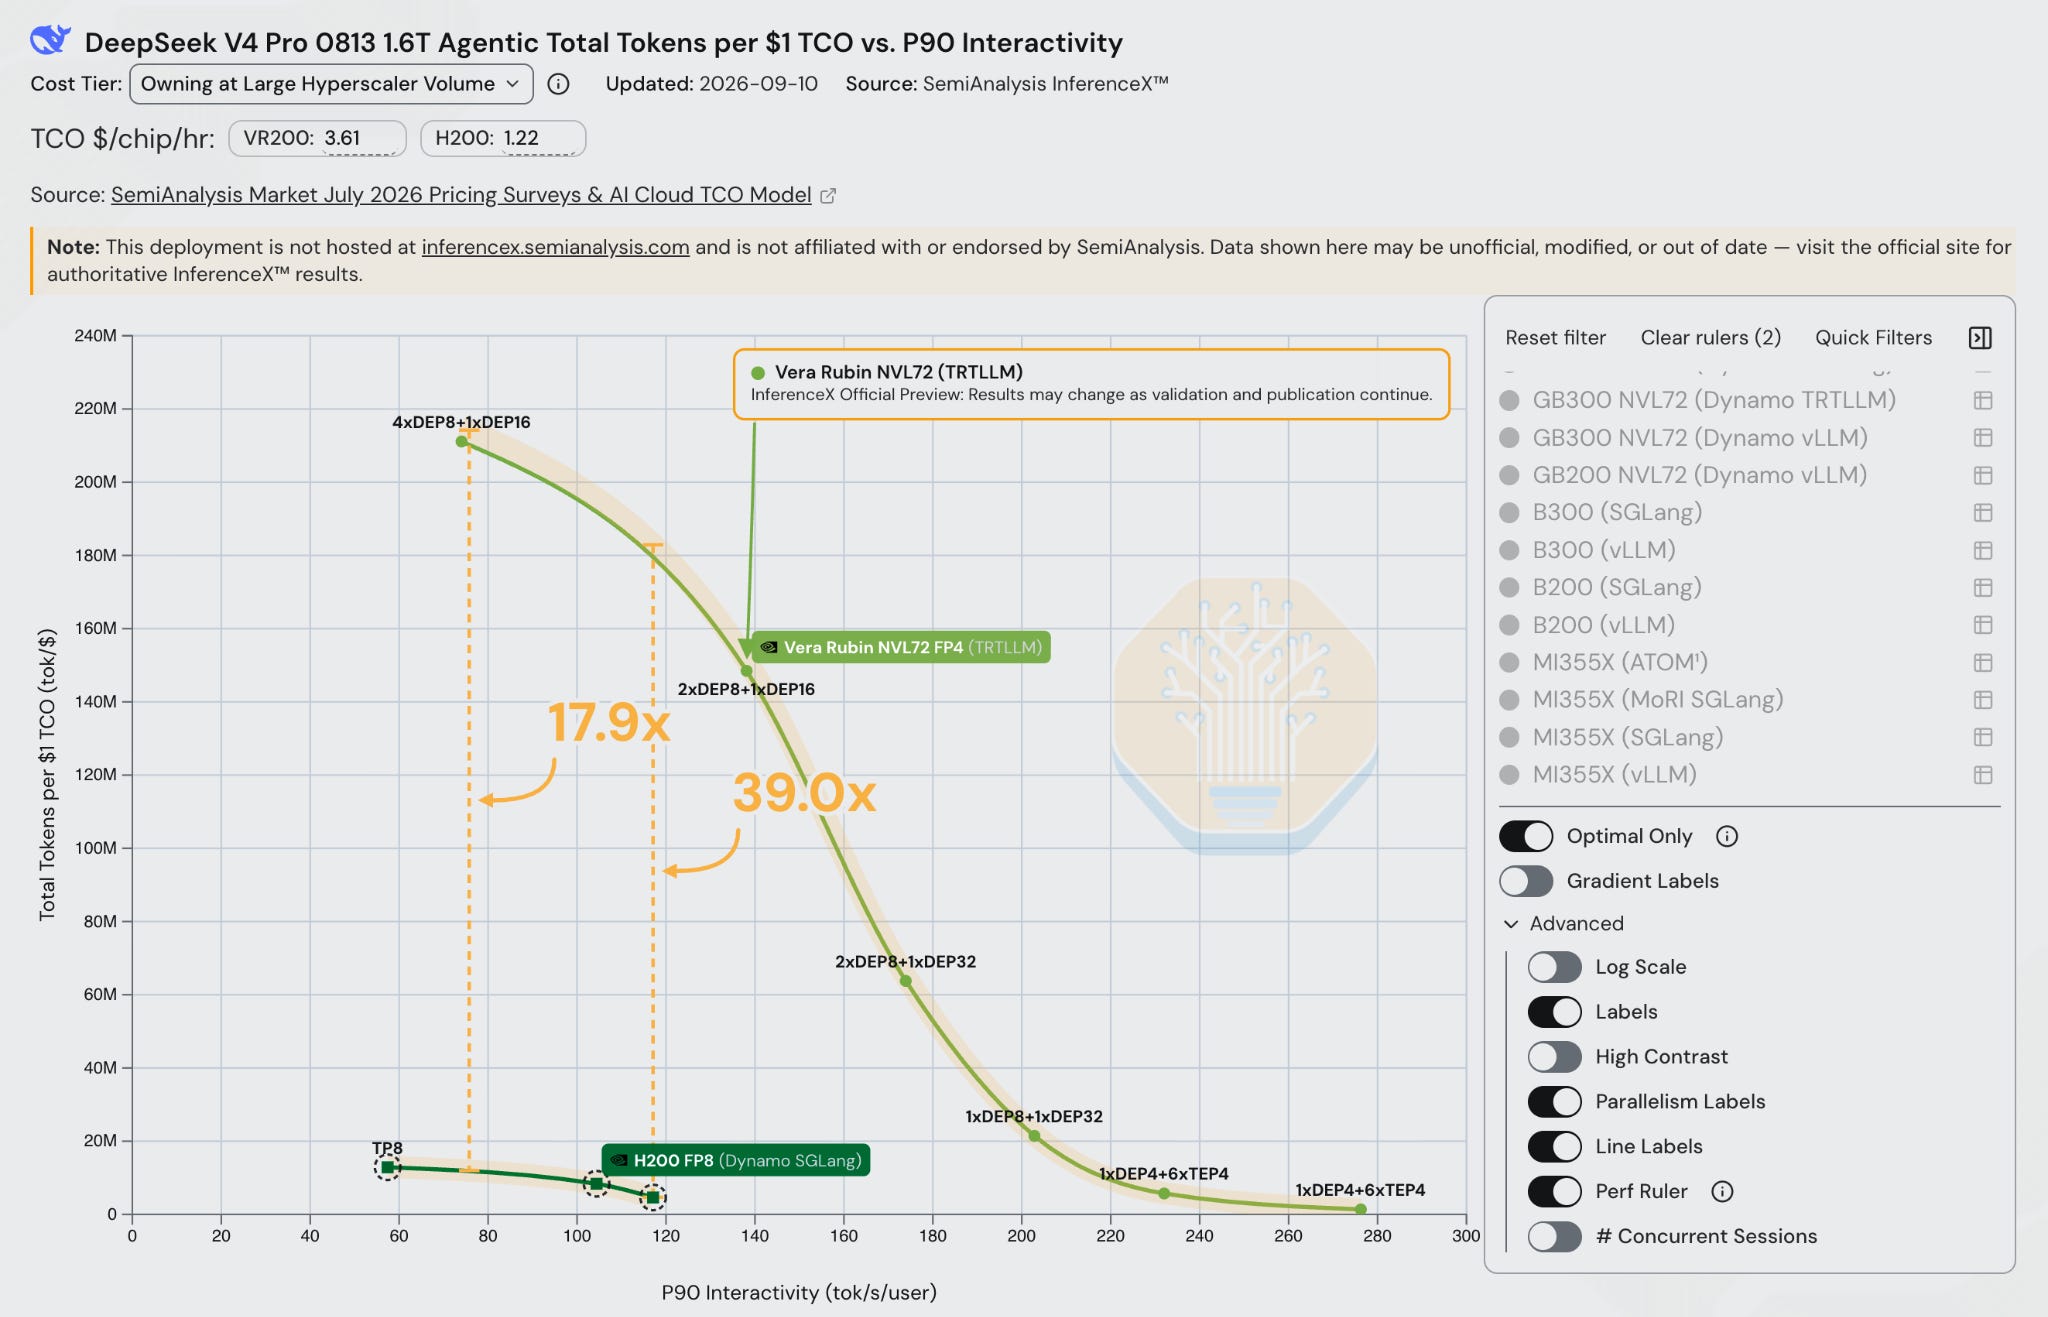
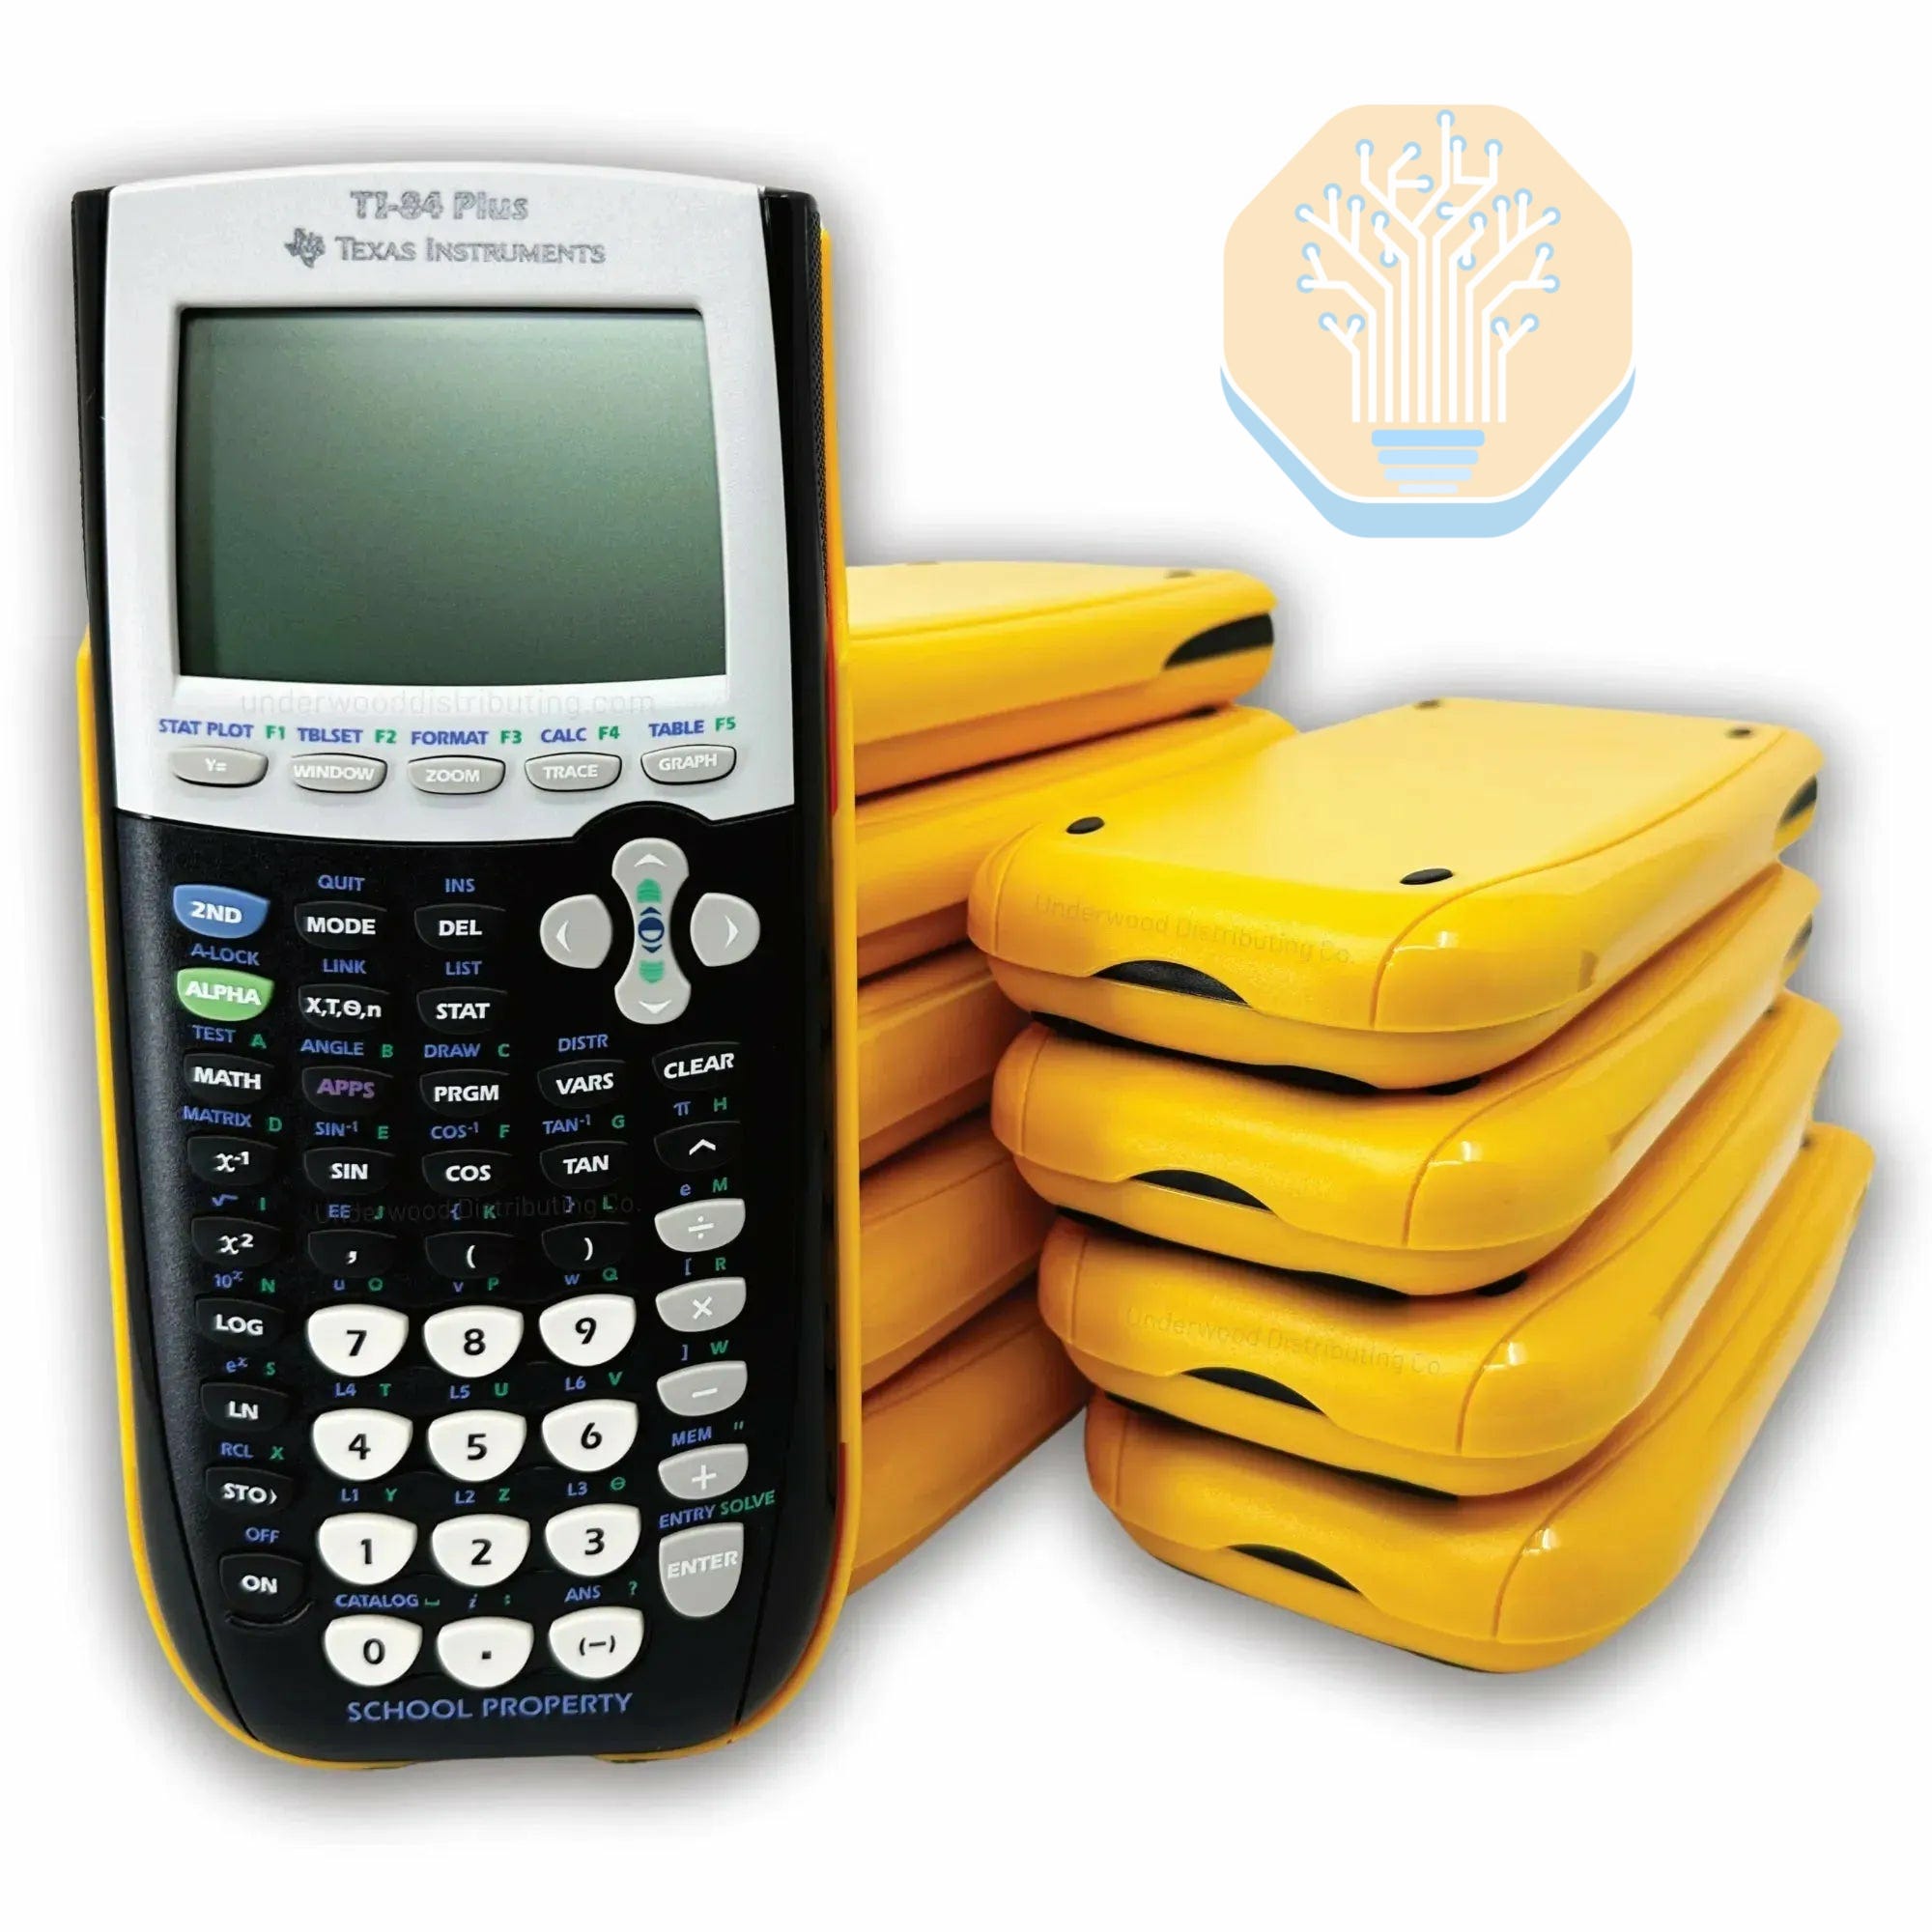
On agentic workloads, Vera Rubin makes H200 look about as competitive as a TI-84 calculator. At a P90 interactivity target of 80 TPS, Rubin delivers 18x as many tokens per dollar. At 120 P90 TPS, that advantage widens to 39x. The advantages of Rubin are less at offline batch inference and more for training as this is where we see what big labs are slowly migrating hopper towards.
Rubin Performance per Watt - Jensen Sandbagging Performance Again
Availability of powered datacenters is often a limiting factor to deploying more chips so when power efficiency is ultra important. If you are able to generate more tokens per GigaWatt, then you are able to generate more revenue and more profit per GigaWatt.
At GTC 2026, Jensen presented this graph comparing Rubin to Blackwell on a large 2T MoE model, showing that VR NVL72 achieved 3x performance per MW on a trillion parameter model around 200 TPS. But when compared to the real world performance of Rubin already on prelease software, we are already seeing up to 7x better token throughput per megawatt. Jensen needs to stop sandbagging his performance claims at GTC. He did last time at GTC 2024 at the announcement of GB200 NVL72 when he claimed it will be 30x faster than Hopper but when we tested, it was 98x better performance than Hopper.
P90 interactivity describes the streaming speed of an individual response, using the reciprocal of P90 full-response inter-token latency. At a fixed interactivity target, a higher curve means the deployment can serve more total traffic within the same power budget. The initial wait for the first token and overall response time remain separate considerations in the preceding latency analysis.
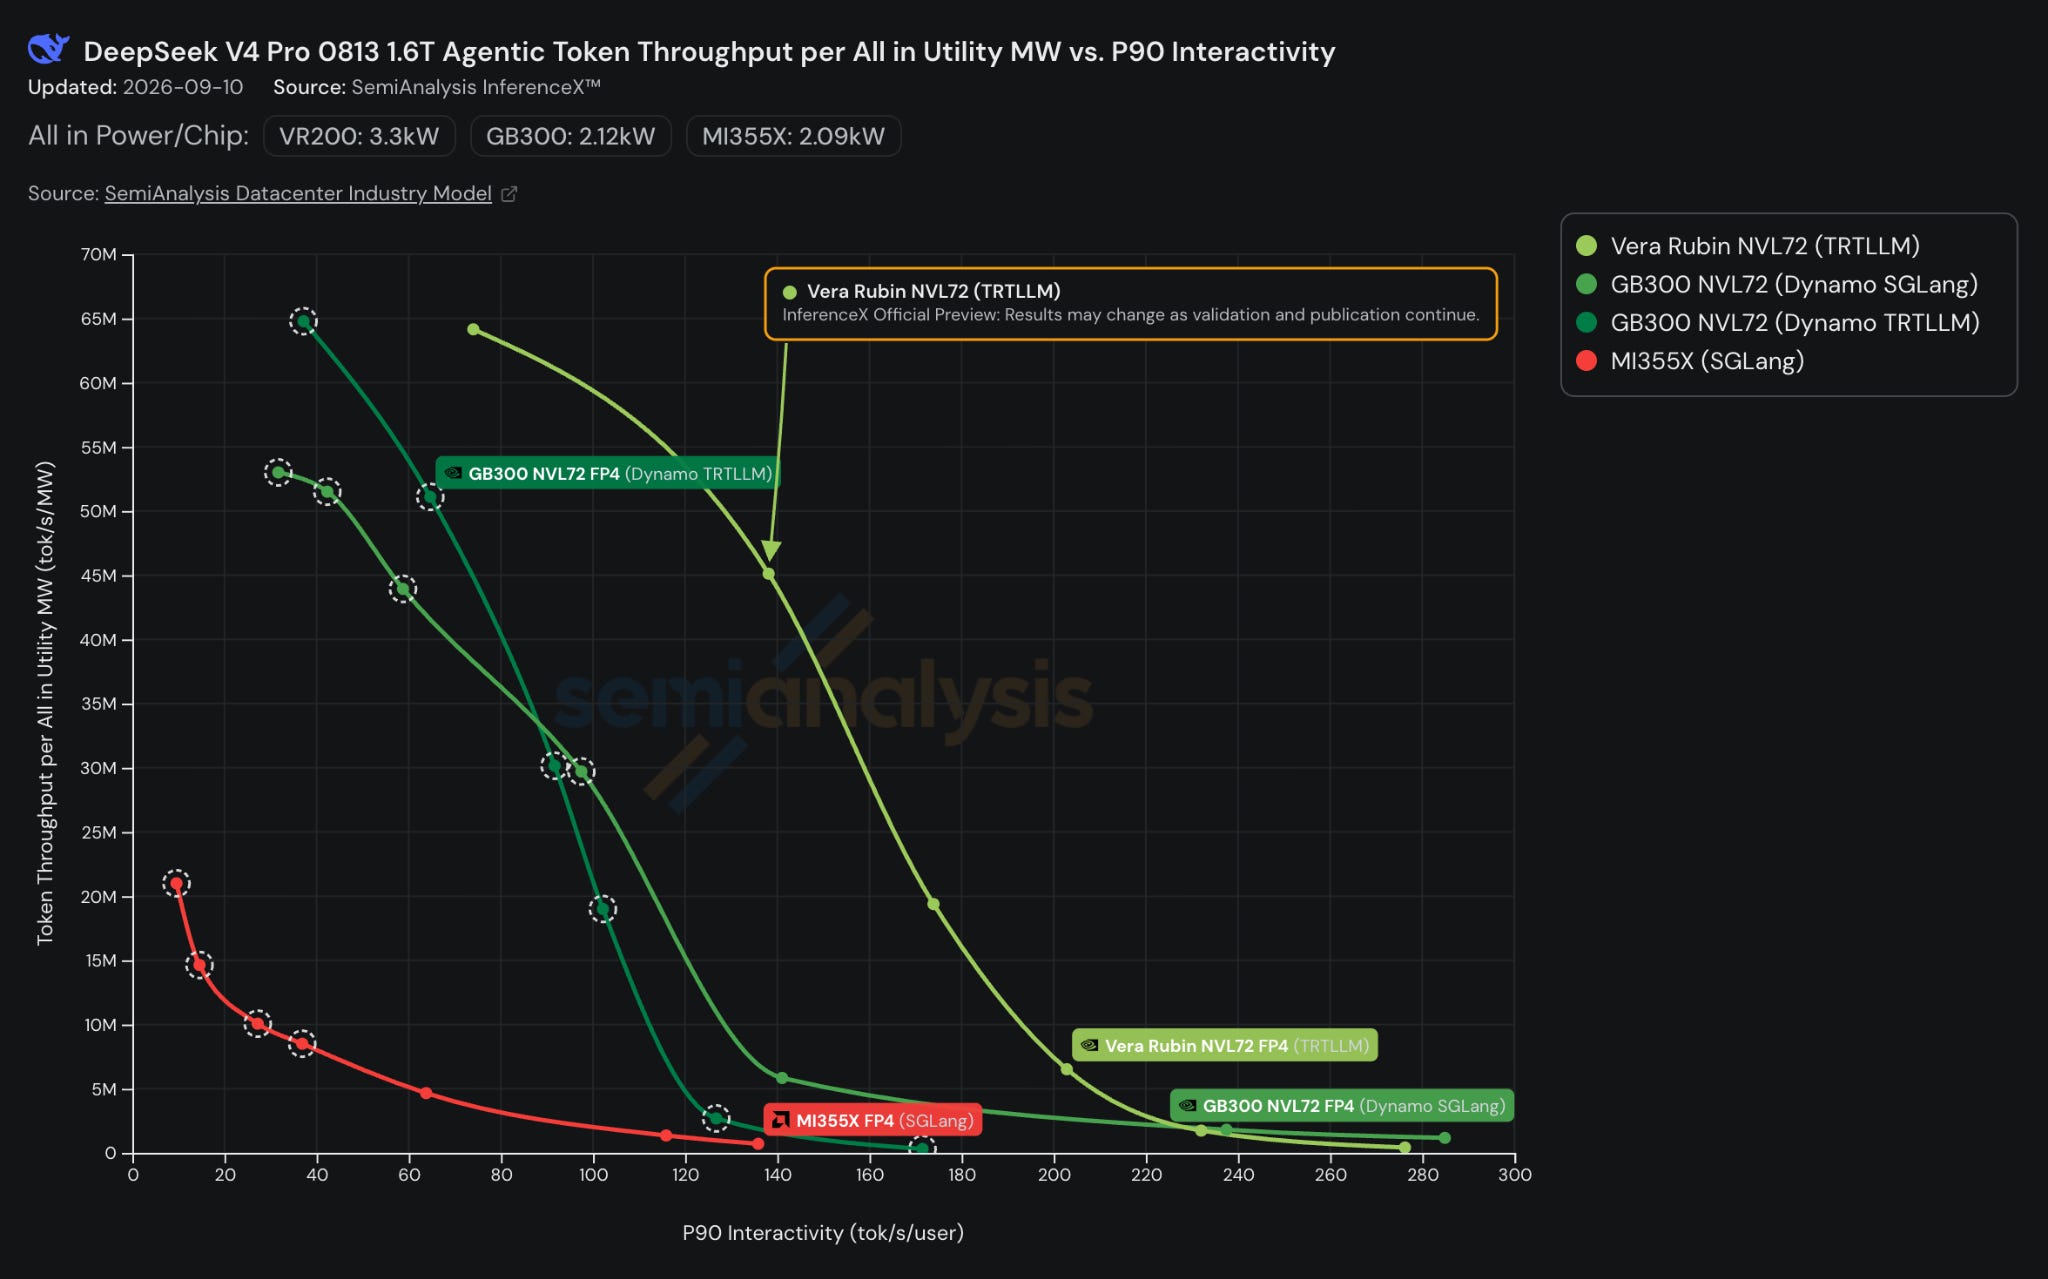
For the DeepSeek V4 Pro agentic workload, Vera Rubin delivers substantially more total token throughput per megawatt than GB300 and MI355X at the matched targets compared below. The size of that advantage depends on the interactivity target and the serving engine used for comparison.
At 100 TPS, Rubin delivers approximately 59.4 million total tok/s/MW, compared with 28.5 million for GB300 Dynamo SGLang and 21.1 million for GB300 Dynamo TRTLLM. That is a 2.09x advantage over the stronger GB300 engine at this target. MI355X SGLang reaches 2.01 million tok/s/MW, giving Rubin a 29.5x lead on this particular workload and snapshot. SGLang is the strongest of the measured MI355X engines at this target.
The wider hardware comparison at 100 TPS puts B200 SGLang at 6.95 million, B300 vLLM at 5.56 million, and H200 Dynamo SGLang at 2.26 million tok/s/MW. H200 uses FP8. The other configurations in this comparison use FP4. These are comparisons of the measured hardware-and-software configurations, including their caching and parallelism choices.
The table shows how the advantage changes across the curve, with throughput in million total tok/s per utility MW. The values are interpolated, meaning they are estimated between measured benchmark points to compare engines at the same speed target. N/A means the target falls outside that engine’s measured range.
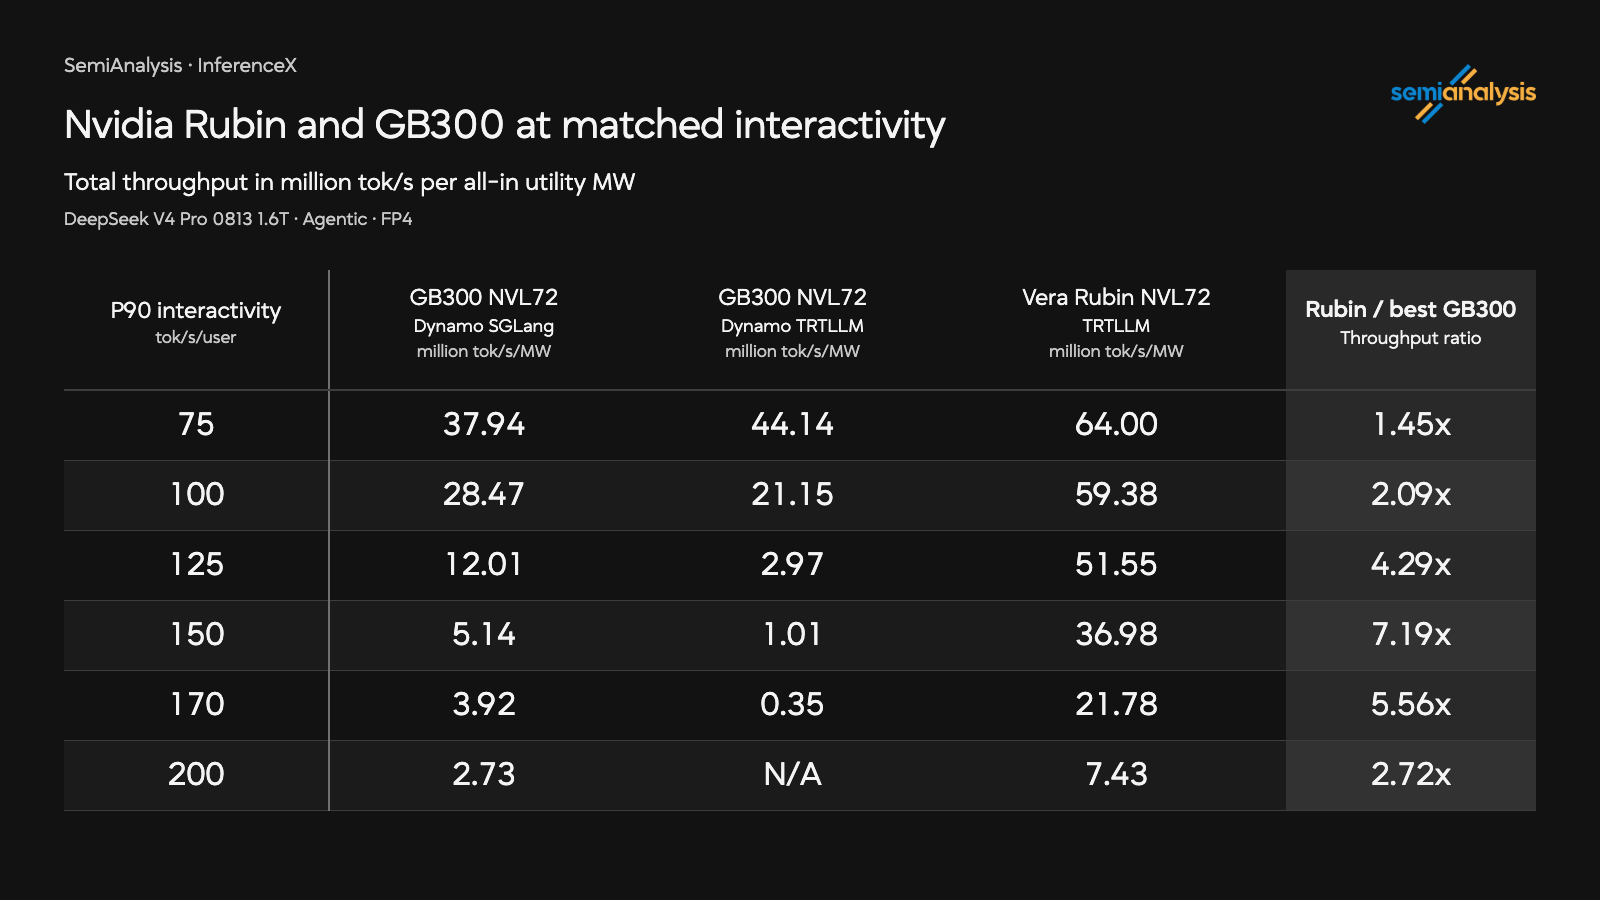
At 150 TPS, Rubin retains nearly 37 million tok/s/MW, approximately 7.2x GB300 SGLang. The advantage then narrows as the speed requirement rises further, reaching 2.72x at 200. The strongest GB300 engine also changes with the target. TRTLLM leads at 75, while SGLang leads at the higher targets shown here.
This distinction is especially relevant near the operating point discussed earlier. At exactly 170 TPS, Rubin delivers 62.9x the total throughput per MW of GB300 TRTLLM, whose curve is near its fastest measured endpoint. Against GB300 SGLang at the same target, the multiplier is 5.56x. The engine label is therefore essential when quoting the high-interactivity gain.
The other feature of Rubin is the first class integration of dynamic power shifting called “DSX MaxLPS” which means instead of provisioning for max all in TDP plus 10-20% oversubscription factor, gpu cluster operators will power profile their inference workloads and proxies for future workloads and based on the actual power, they will be able to fit more GPUs into the same datacenter power footprint. This is as during inference workloads especially at medium to fast speed, GPUs do not consume their power more envelope thus when smartly steering power across the datacenter, you will be able to fit more GPUs. Our upcoming integration PowerX into InferenceX will allow us to have even finer grain measurements of throughput per GigaWatt.
Annual Revenue and Profit per Gigawatt - The More you Buy, The More you Earn
At the time of writing, DeepSeek V4 Pro 1.6T was replaced in favor of DeepSeek V4.1 Flash. However, its size allows it to be a proxy for O(1-3T) parameter LLMs. As DeepSeek V4 Pro was released under the MIT license, there is no license fee.
At a fixed power budget, Rubin’s advantage is not simply that it can process more tokens. It gives an operator more capacity to monetize demand without securing additional utility power. At 75 TPS interactivity, 60% utilization and no model-license fee, Vera Rubin generates $159.5 billion in annual revenue and $149.9 billion in modeled profit per all-in utility GW. The strongest GB300 configuration in this annual revenue comparison, Dynamo SGLang, generates $114.9 billion and $105.3 billion respectively. Rubin therefore delivers approximately 39% more revenue and 42% more modeled profit from the same power allocation.
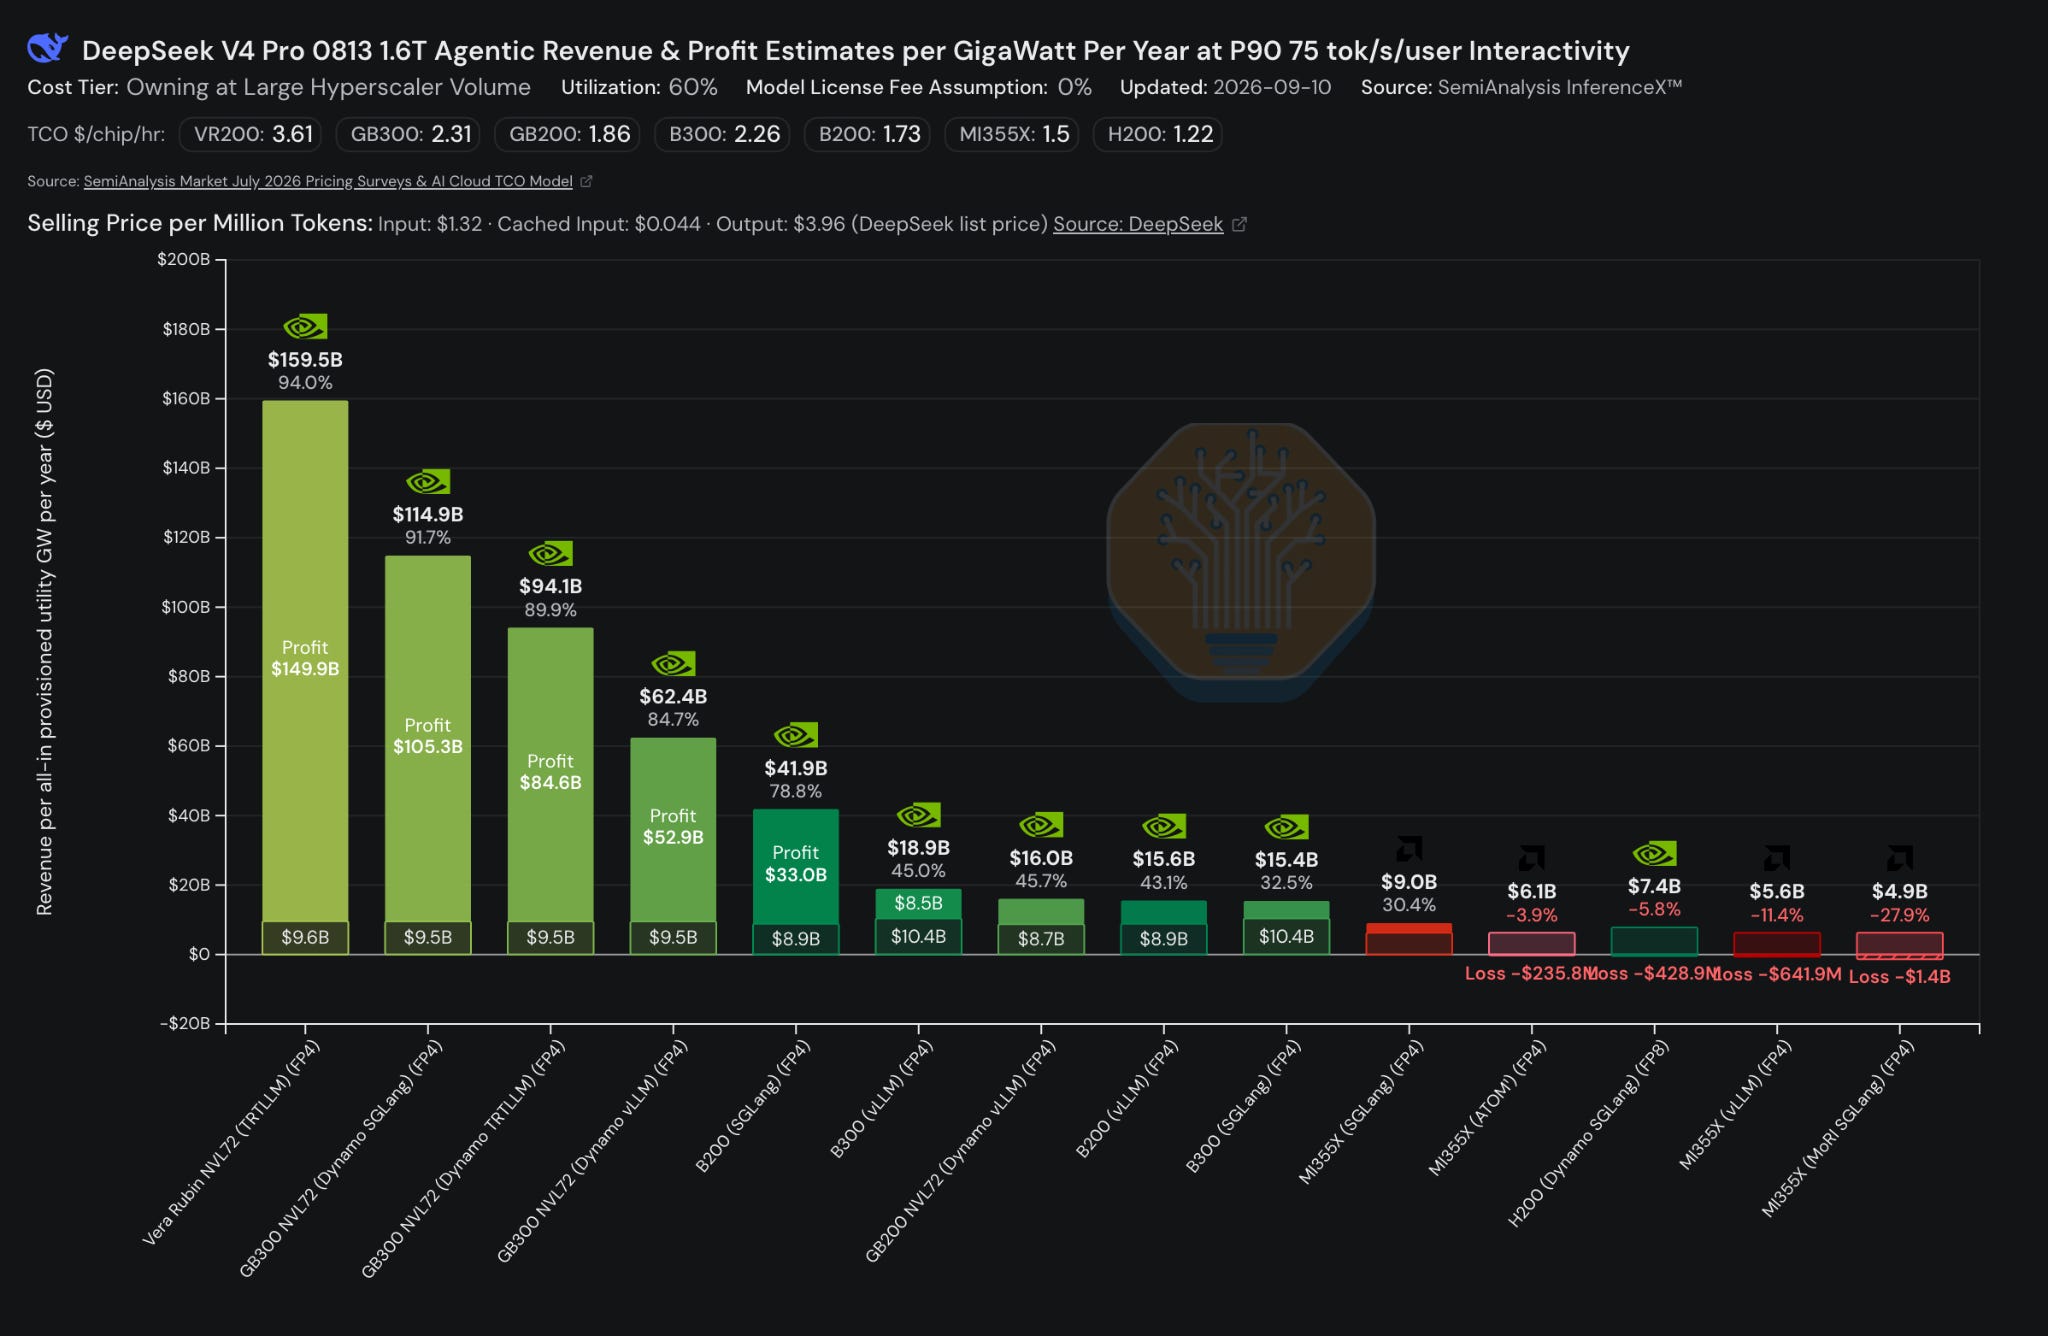
The absolute difference is approximately $44.6 billion in additional annual modeled profit per GW, or roughly $446 million at a 10 MW scale under linear scaling. Because the displayed annual cost per GW is similar for these two configurations, most of the incremental revenue flows through to the model’s profit measure.
The same advantage also creates pricing headroom. Holding workload mix, throughput and billable utilization constant, Rubin could charge approximately 28% less across cached-input, uncached-input and output tokens while matching the revenue per GW of GB300 Dynamo SGLang at the displayed prices. An operator could therefore retain the efficiency gain as additional profit or use it to compete on price, depending on the demand elasticity of the models.
Below we will talk about the total revenue over the entire lifecycle of the fleet for each NVIDIA chip.