

Are AI Datacenters Increasing Electric Bills for American Households?
Power prices misconception, PJM's poor market design, Capacity prices 9.3x growth, ERCOT vs PJM grid reliability and expansion
Are AI Datacenters Increasing Electric Bills for American Households?
SemiAnalysis x Fluidstack is launching GTC with a 48-hour, full-stack AI infrastructure hackathon on March 15th from Power to Prefill, Dirt to Decode. With speakers from OpenAI, GPU MODE, and Thinking Machines, plus compute grants and GPU cluster access, come build with the best: APPLY HERE.
The topic of datacenter load growth and impact on power prices remains broadly misunderstood, akin to the water consumption myth that we debunked recently. It was at the forefront of the 2025 New Jersey elections, after a ~20% jump in residential electricity rates overnight in June 2025. Some even began finger-pointing at the 300MW Nebius AI Datacenter for Microsoft in the state, a laughable claim given >85% of its power is self-generated. Are AI datacenters really causing households to pay electricity 20% more expensive?
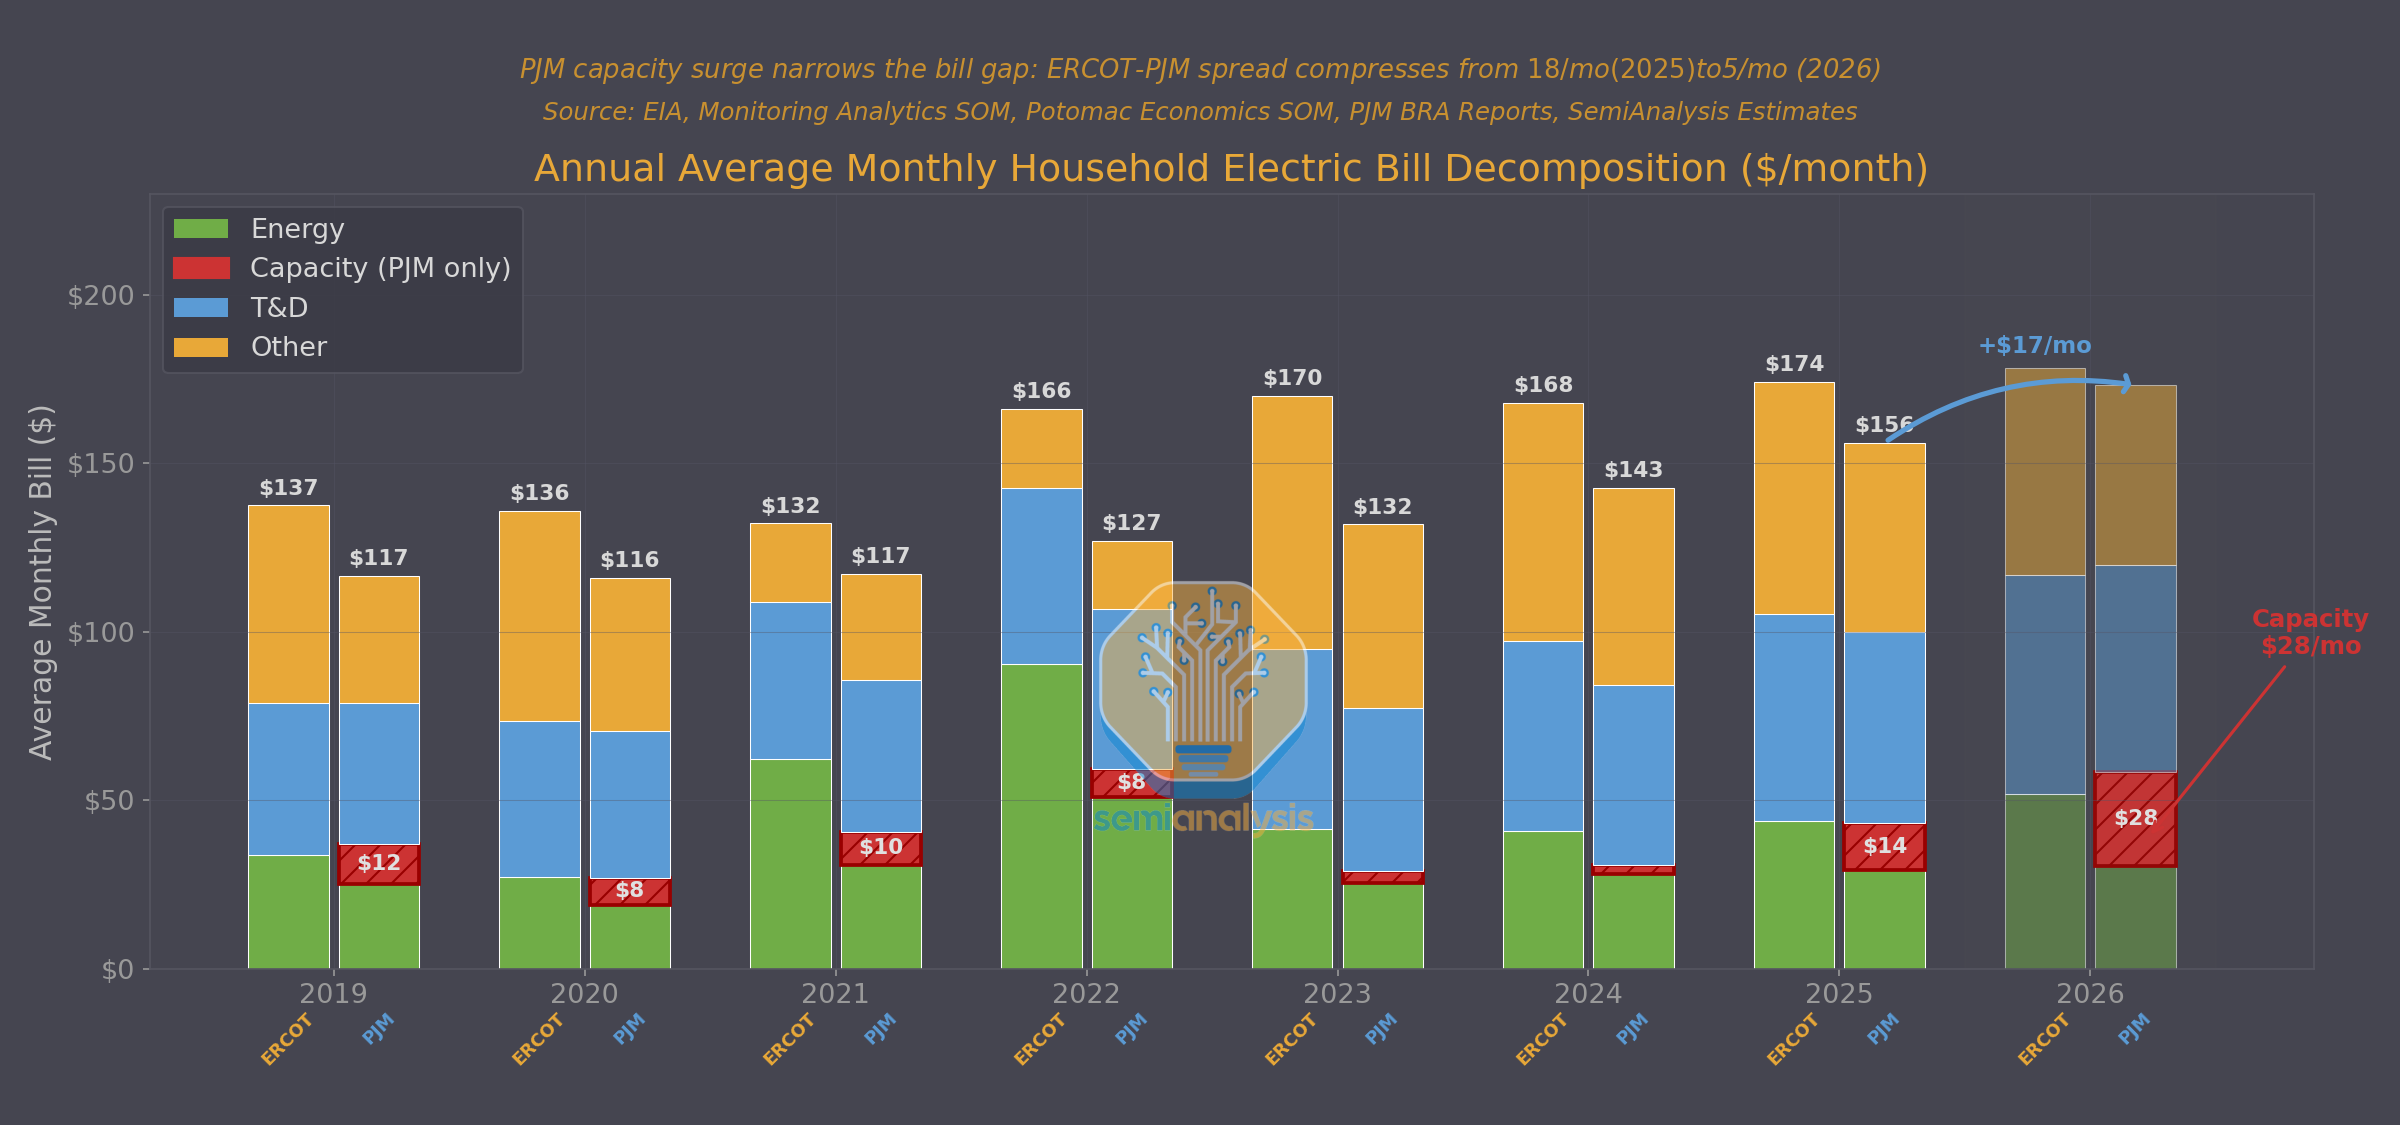
This report explores the question by analyzing the two biggest energy markets in the US, which are also the largest AI Datacenter hubs: the PJM interconnection area – the grid operating covering 13 eastern US states (including New Jersey) - and ERCOT, who oversees the electric grid in Texas. In the Lone Star State, prices have been roughly stable for the last three years. On the other hand, the 67 million residents of the PJM area are set to see their bill increase by an average of ~15% in 2026 relative to the “pre-AI-Datacenter” era? Why such a divergence? In short, empirically the fault is government policy, not AI.
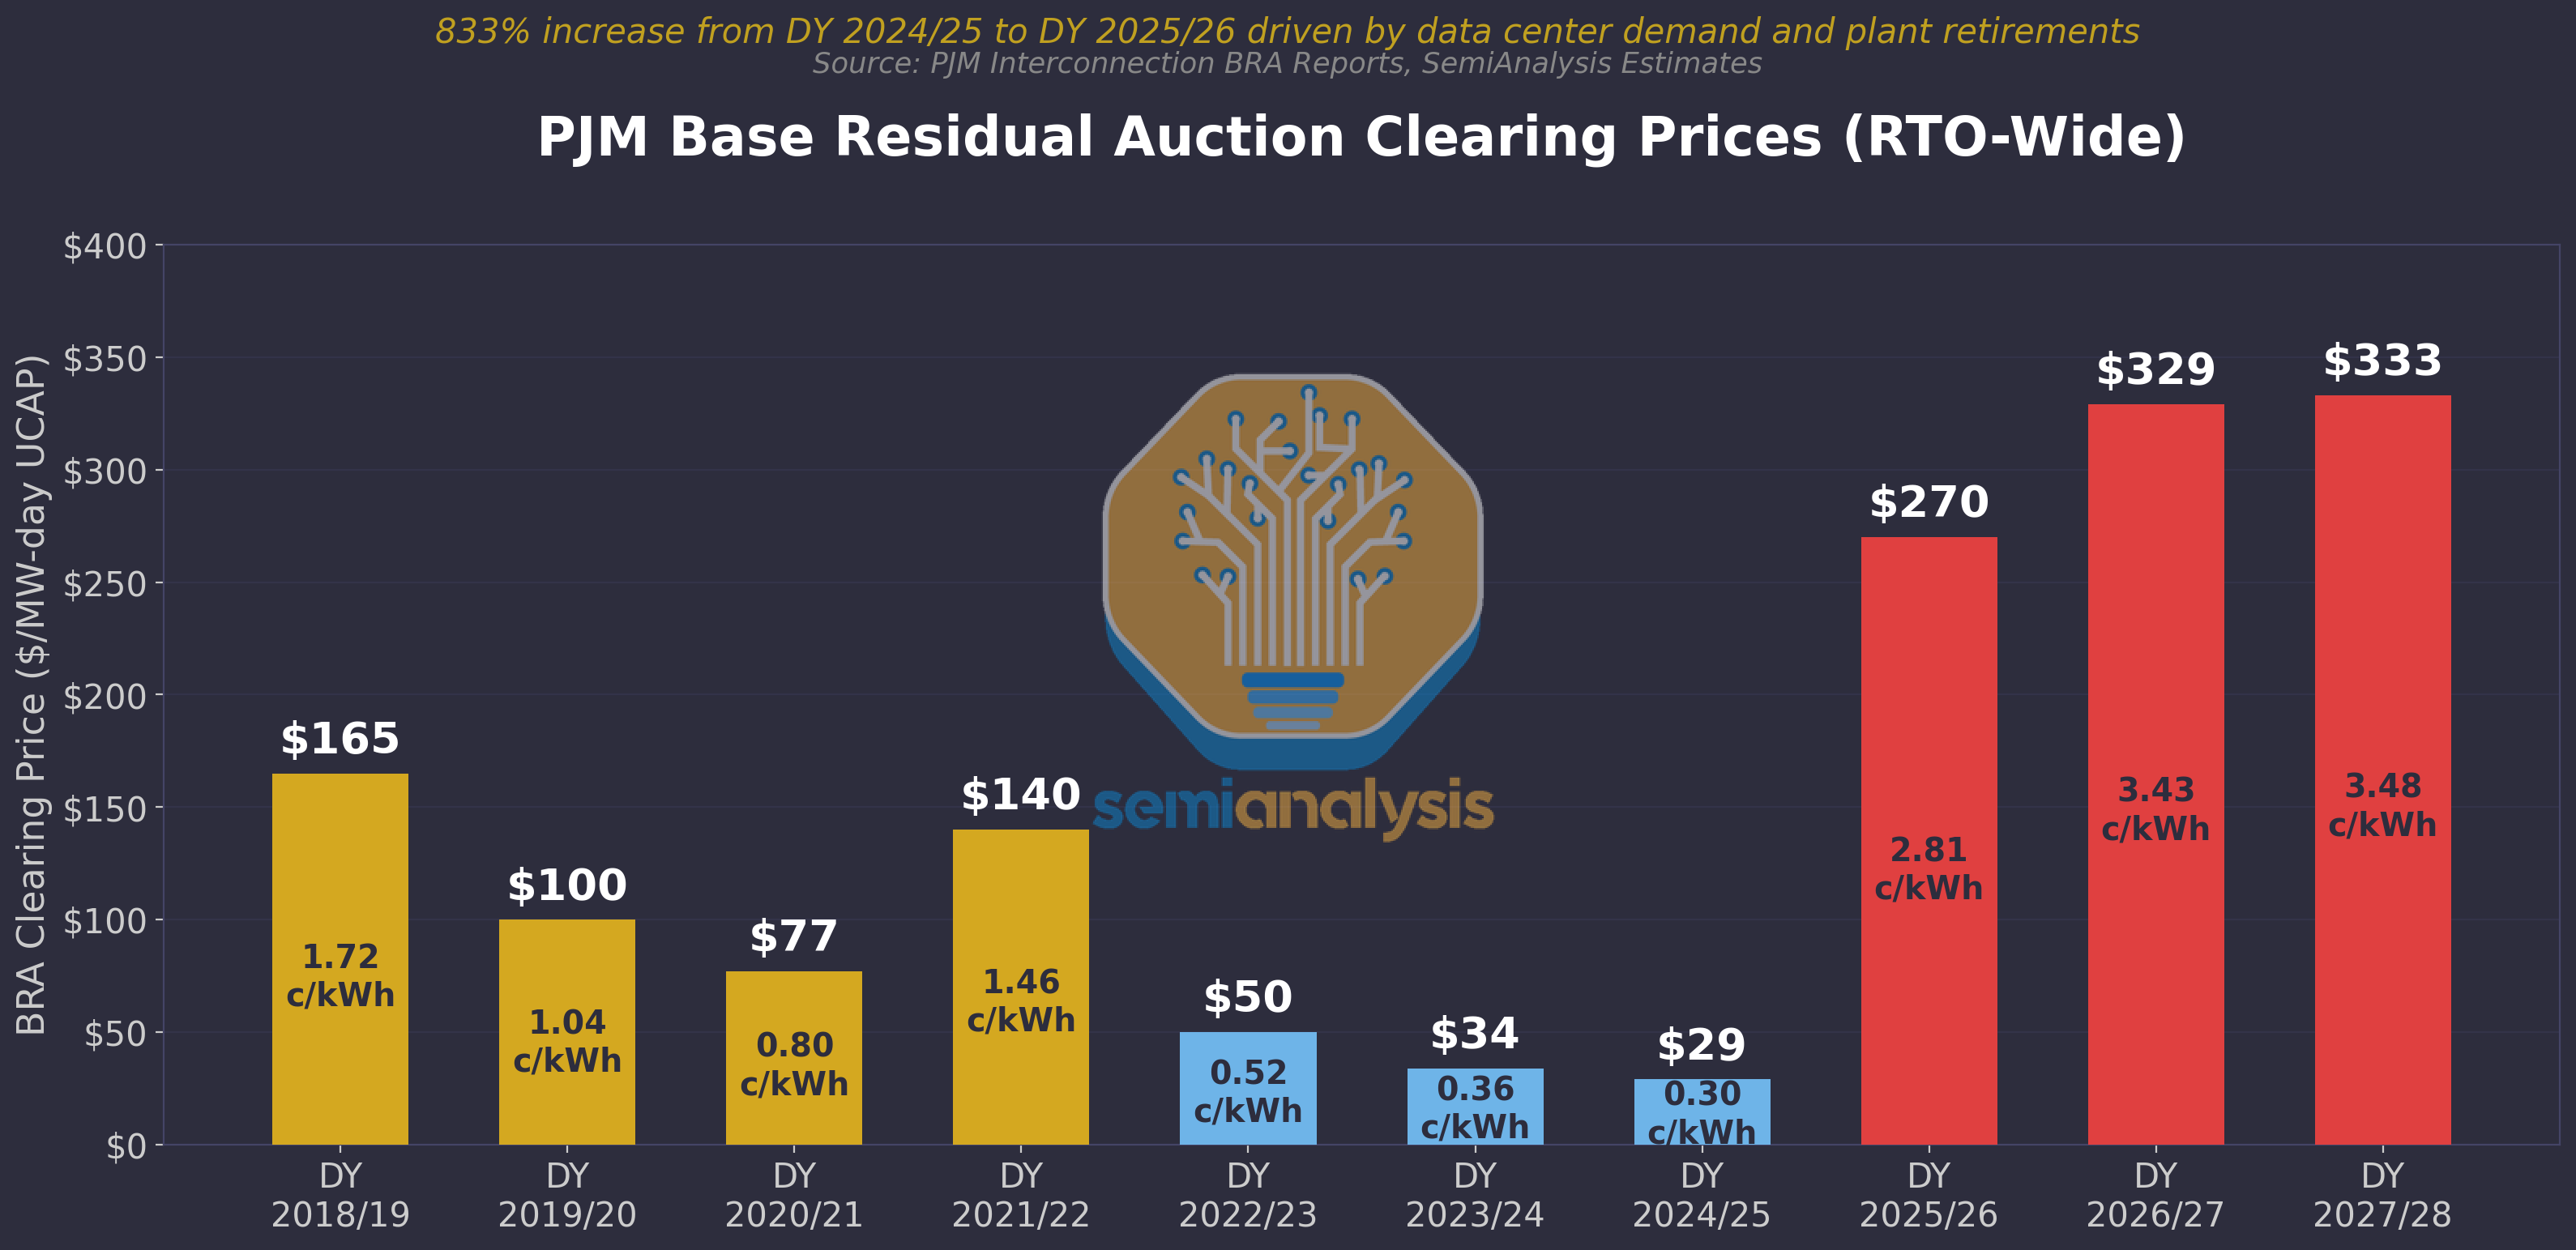
In PJM, we think poor market design is the main culprit. Most of the 15% increase in household electricity bills in PJM is driven by a widely misunderstood and somewhat obscure mechanism: the BRA capacity auction. The 2025/26 auction increased 9.3x over the prior year, as shown below. Worse: this increase is driven by a “simulation” and doesn’t reflect actual conditions. Is is largely a function of the demand and supply forecast made by a central planner (PJM), which as we’ll explain, has a history of huge miscalculations.
Many are finger-pointing at the surge in AI datacenters, and it is understandable. The PJM area is at the forefront of the AI boom, with Google notably training its Gemini model around Columbus Ohio, while Anthropic/Amazon’s “Project Rainier” and Meta’s “Prometheus” in Indiana and Ohio are both in our world’s top 5 largest AI Datacenters. PJM also hosts the world’s largest datacenter hub: Northern Virginia.
Now look at Texas. The state is witnessing an equivalent AI buildout, with OpenAI, Google DeepMind, Anthropic all building massive facilities. Yet power futures in Texas have moved only a few percent in the past year. No 9x spike, no crisis, very different market design.
Let’s dig in. This report focuses on ERCOT and PJM since they’re the two largest energy markets in the country, and are epicenters of the AI revolution. We’ll dig into their respective market design, explain how they’ve reacted to booming AI Datacenter load growth, and how that will flow to households.
Then, behind paywall, we discuss the supply chain implications. We believe that market constraints are dramatically shifting and many are missing it. This shift impacts major AI winners such as IPPs (Vistra, Constellation, Talen..), equipment suppliers, datacenter developers like cryptominers.
For institutions looking for deeper analysis, subscribe to our Energy Model and Datacenter Industry Model. The latter tracks and forecasts quarter-by-quarter, 2017-2032, over 5,000 individual facilities and their electrical capacity. The Energy Model builds an energy supply & demand analysis on top of it, by tracking and forecasting operations for every single power plant in the US, estimating their true ELCC, analyzing interconnection queue dynamics, and matching against our datacenter demand-side data.
Let’s start with a brief explainer of what “capacity” actually is, how it flows to your monthly bill, and then dig further into market designs.
This report is a collaboration between SemiAnalysis and Archer Daniels Midland Investor Services (ADMIS), a leading futures brokerage and clearing firm.
Capacity: paying for power plants to sit idle 95% of the time
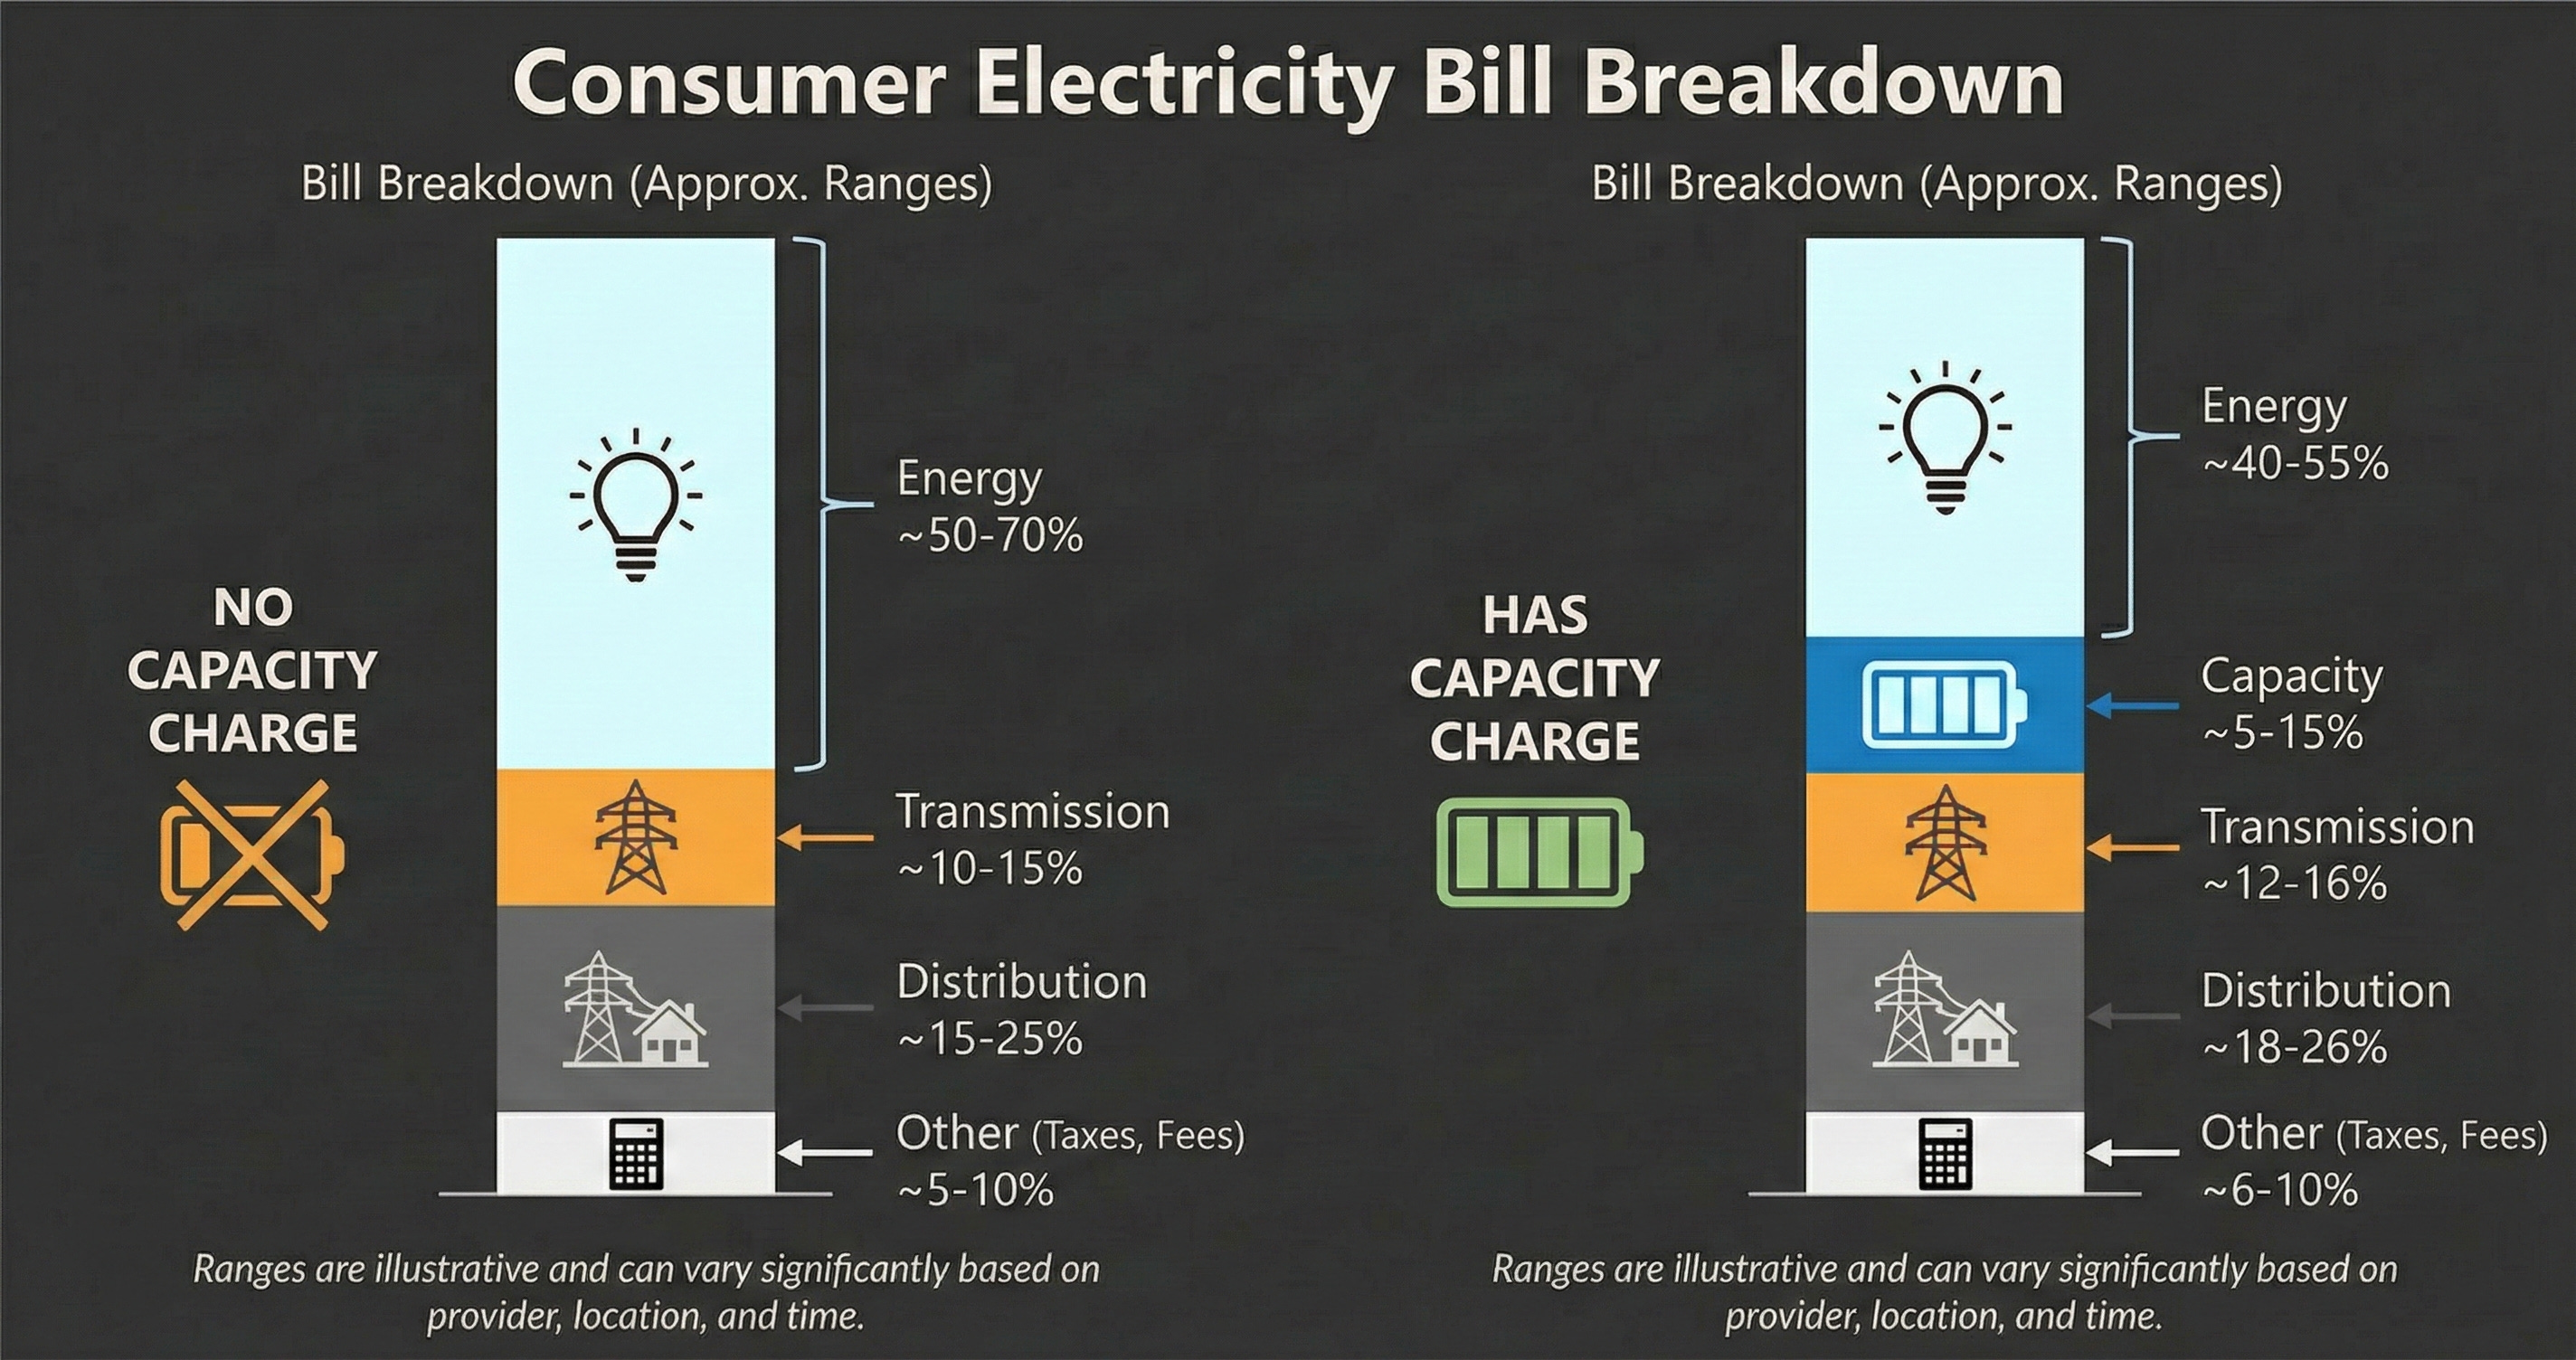
At a high level, a monthly household electric bill is driven by the following charges:
Energy: In deregulated territories (including PJM’s 13 states, and ERCOT/Texas), this is a function of wholesale prices, i.e. real-time supply and demand for electricity.
Capacity: This charge doesn’t exist in ERCOT but matters in PJM. It is a function of supply & demand for capacity, i.e. power that will only turn on a few hours per year, at necessary peak events. In PJM, this charge is defined annually via a large auction.
Transmission & Distribution (T&D): the charges for the electrical distribution network.
This remains a highly regulated area. T&D providers typically earn a pre-determined, regulated Return on Equity. As such, utilization rate of transmission & distribution assets can impact consumer power prices. We will not dive into this in this report – we’ll leave that for a future deep dive.
Others: taxes, retail adders, ancillary services, etc. We will not dive into this, as it varies based on location.
The purpose of capacity markets is to ensure households and businesses always have the electricity they need, including on peak summer or winter days. For context, on a single day, the electric load of New York City alone can vary by 2 gigawatts (GW), against a daily peak of 6-8 GW. During a heat wave, this same city can draw 10 GW of electricity as everyone runs their air conditioning at once.
In PJM, to ensure we have capacity when it’s needed, we pay power plant owners to maintain their assets on standby for >95% of the year. The price paid is determined by a forward auction, run once per year. That price is then spread across all electricity customers in the region. And that price went up by 9.3x in the 2025/26 delivery period, as detailed below.
ERCOT, on the other hand, is an “energy-only” market, with no separate capacity auction. Real-time pricing signals determine “scarcity” and incentivizes power plants to solve the issue. There are a few technicalities we detail later in the report, but the fundamental difference is the absence of a centralized annual capacity auction, instead using real-time market forces.
PJM: The $16 Billion Simulation
The core issue with the capacity market design is that it is directly impacted by the supply & demand forecast of a central planner, PJM. Any forecasting error can lead to billions of dollars of unwarranted spending. In the 2025-26 auction, that spending sums up to $16 billion, spread across every single resident and business in the PJM area.
How the Base Residual Auction Works
PJM pays for system capacity with the aforementioned forward capacity market, called the Base Residual Auction (BRA). This is a yearly auction ran two years ahead of time: for example, PJM’s 2027/28 capacity needs were auctioned at the end of 2025.
Unlike wholesale energy markets that trade in $/MWh (i.e. electrons consumed in a given hour), the BRA trades in $/MW-day (i.e. peak power provisioned in a given day). PJM’s demand forecast determines how many megawatts of generators, batteries, and other resources it needs to meet its maximum projected electric load (plus a reserve margin), then runs the auction to discover how much that capacity will cost. Customers ultimately pay for everything on the grid, so when prices in this capacity auction spike, that spike reaches household electric bills.
Until recently, the BRA delivered on its promise. Summer 2025 was brutally hot in PJM, with June 23 and 24 setting records as the 3rd- and 4th-highest peak days in PJM history. The lights did not go out, because there was enough generation capacity to meet the load.
But that reliability now comes at an extraordinary price. Between June 2024 and May 2025 (the 2024/25 service period), capacity cost $29/MW-day. For the current 2025/26 service period, capacity jumped 9.3x to $270/MW-day, with select locations seeing prices closer to $450/MW-day. The subsequent 2026/27 and 2027/28 auctions continued clearing at record prices. It was widely believed that the price would be even higher, but the federal regulator imposed a price cap of $329/MW-day. The most recent auction, December 17th, 2025, hit the price cap for the second straight year.

PJM blamed “runaway” power costs on both extreme weather and hyperscaler datacenter & AI power demand, and that narrative trickled into mainstream news. But that explanation obscures PJM’s own responsibility, because capacity prices are set more than a year ahead of time, based on a simulated model designed by PJM.
The Simulation Under the Hood
Capacity prices are based on an artificial supply-demand curve known internally as the Variable Resource Requirement (VRR) curve. The VRR curve is built on PJM’s internal forecast model, not on what the market thinks will happen. The projected increase in datacenter load shifted the clearing price on this curve, driving up prices independent of any public bid process.
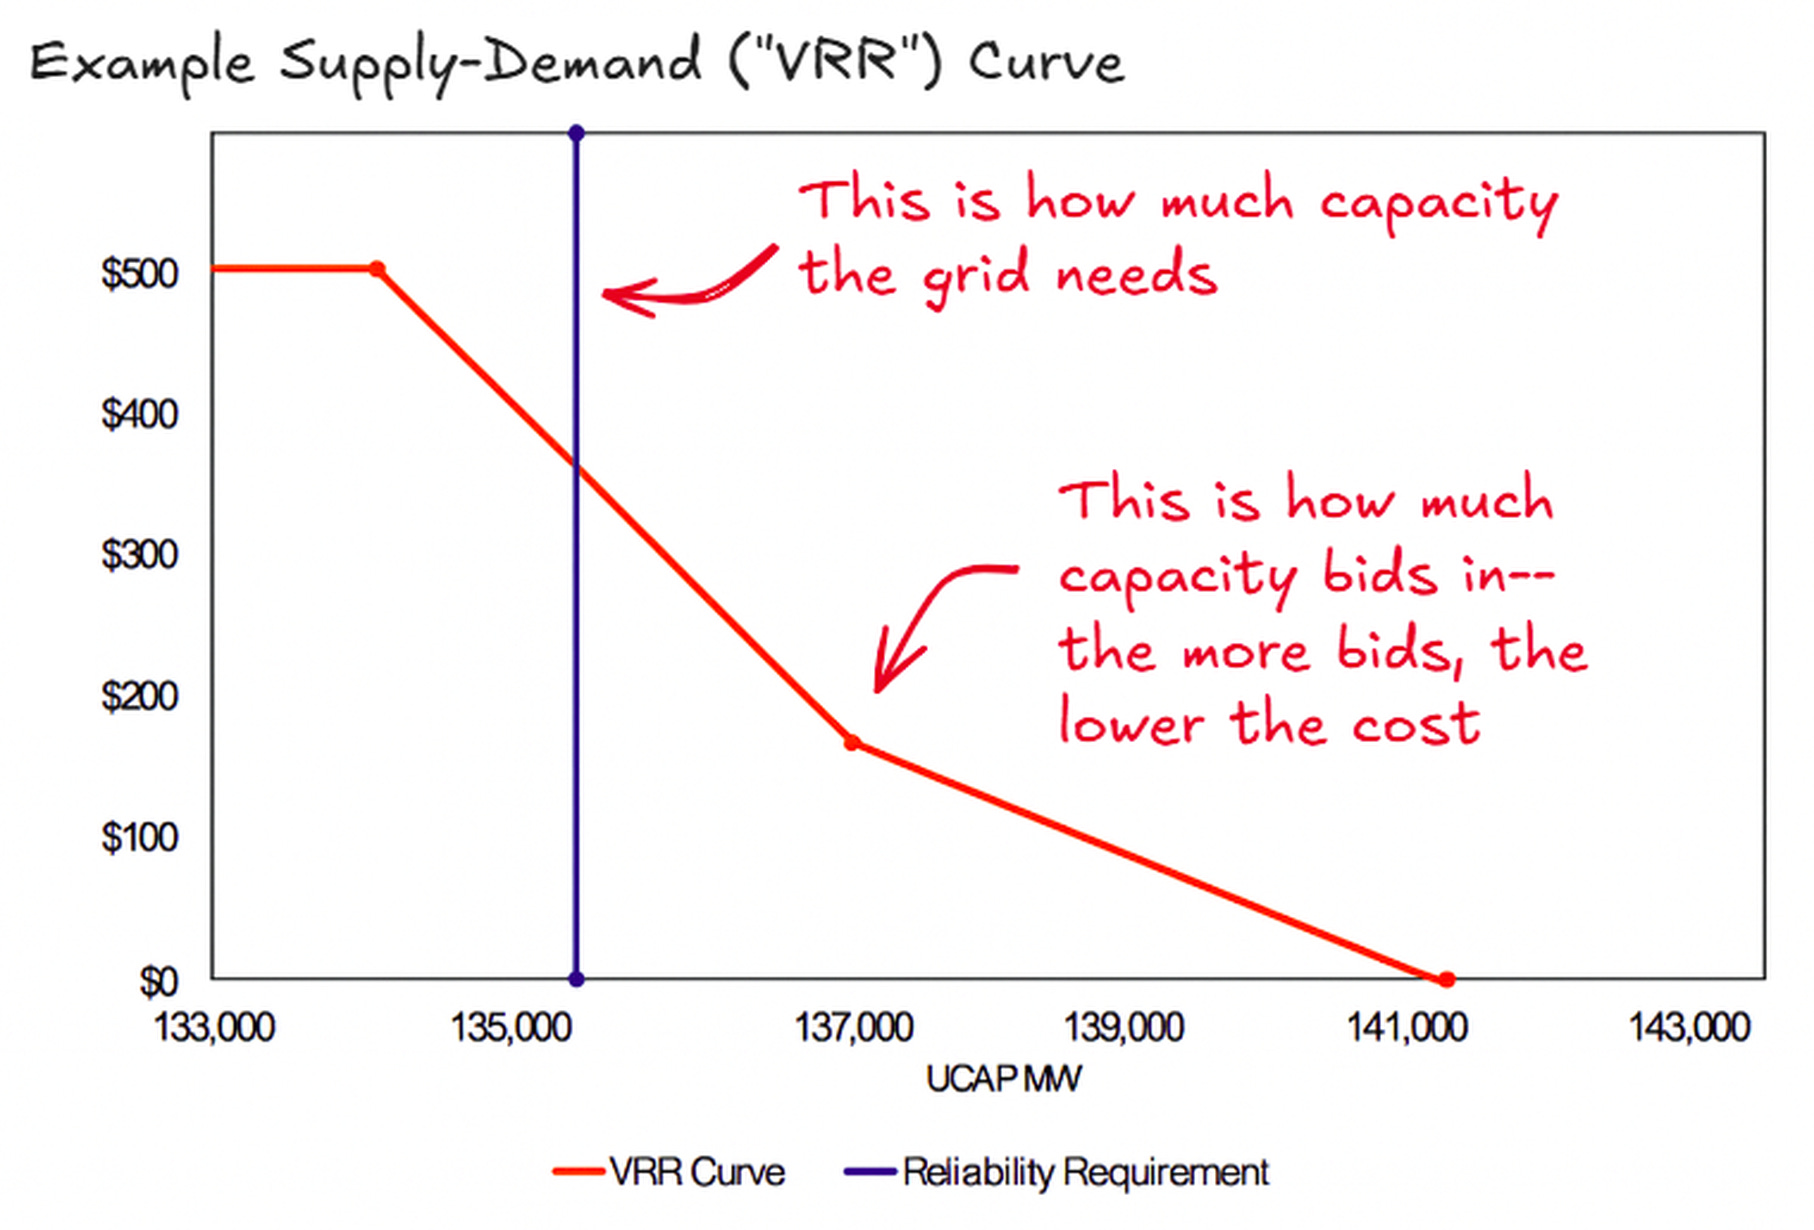
However, the VRR curve is constructed from a web of assumptions, many of which depend on non-public models and proprietary data. Even modest changes in forecasted load can trigger large swings in clearing prices. The capacity market’s extreme sensitivity to forecast inputs means that getting the datacenter load number wrong by even a few gigawatts produces a catastrophic result: changing the curve’s shape near the clearing point, and ramping prices.
Datacenters blamed as the culprit for surging capacity prices
PJM’s Internal Market Monitor (IMM) -- an independent monitoring entity required by the Federal Energy Regulatory Commission (FERC) -- ran alternate simulations of the 2025/26 market, offering rare visibility into PJM’s otherwise-opaque methodology. According to the market monitor, datacenters should be blamed:
Removing all datacenters from the forecast reduced PJM peak load by 7,927 MW, resulting in a $9.33 billion reduction of total capacity payments -- a 64% reduction versus the actual price.
Keeping only already-energized datacenters reduced peak load by 4,654 MW, resulting in a $7.74 billion reduction -- a 53% cut from the actual price. For the 2026/27 auction parameters with an unrestricted VRR curve, the IMM estimated ~11,993 MW of combined datacenter load.
According to the IMM’s analysis, incremental datacenter load growth alone explains roughly a doubling in capacity costs versus a hypothetical grid without that load. The IMM attributes ~7.9 GW of additional datacenter demand in 2025/26 and ~12 GW in 2026/27. No other factor came close.
But all of these simulations obscure a deeper issue: the main auction that drives electric rates is also based on a simulation. The VRR curve is an artificial supply-demand curve based on a forecast that PJM made for themselves. If that forecast is inaccurate, those inaccuracies skew the entire capacity market.
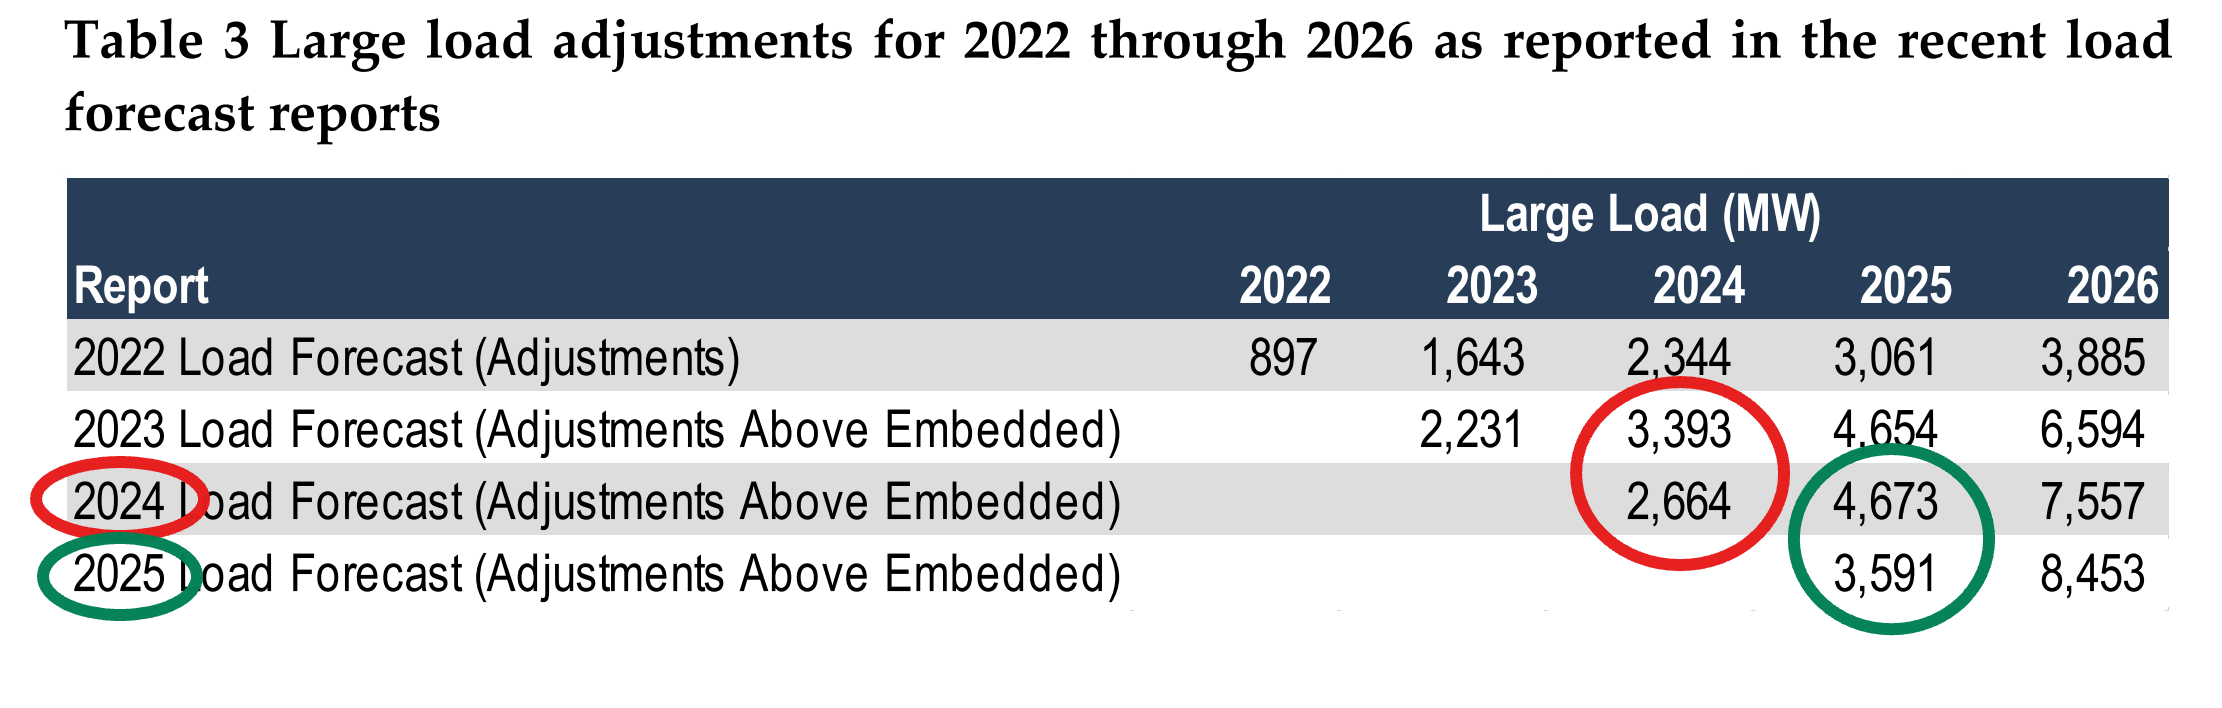
And we believe the forecast is inaccurate. Our methodology tracks precise construction timelines of every single datacenter in the PJM area and shows PJM’s forecast is likely too optimistic. This is not due to a lack of demand, rather it’s due to datacenter construction delays (as highlighted in our Industrials Model), to GPU production and assembly delays (as explained in our Accelerator Model), and other supply chain issues. New hardware platforms are often buggy at first and longer-than-usual to turn on at full capacity.
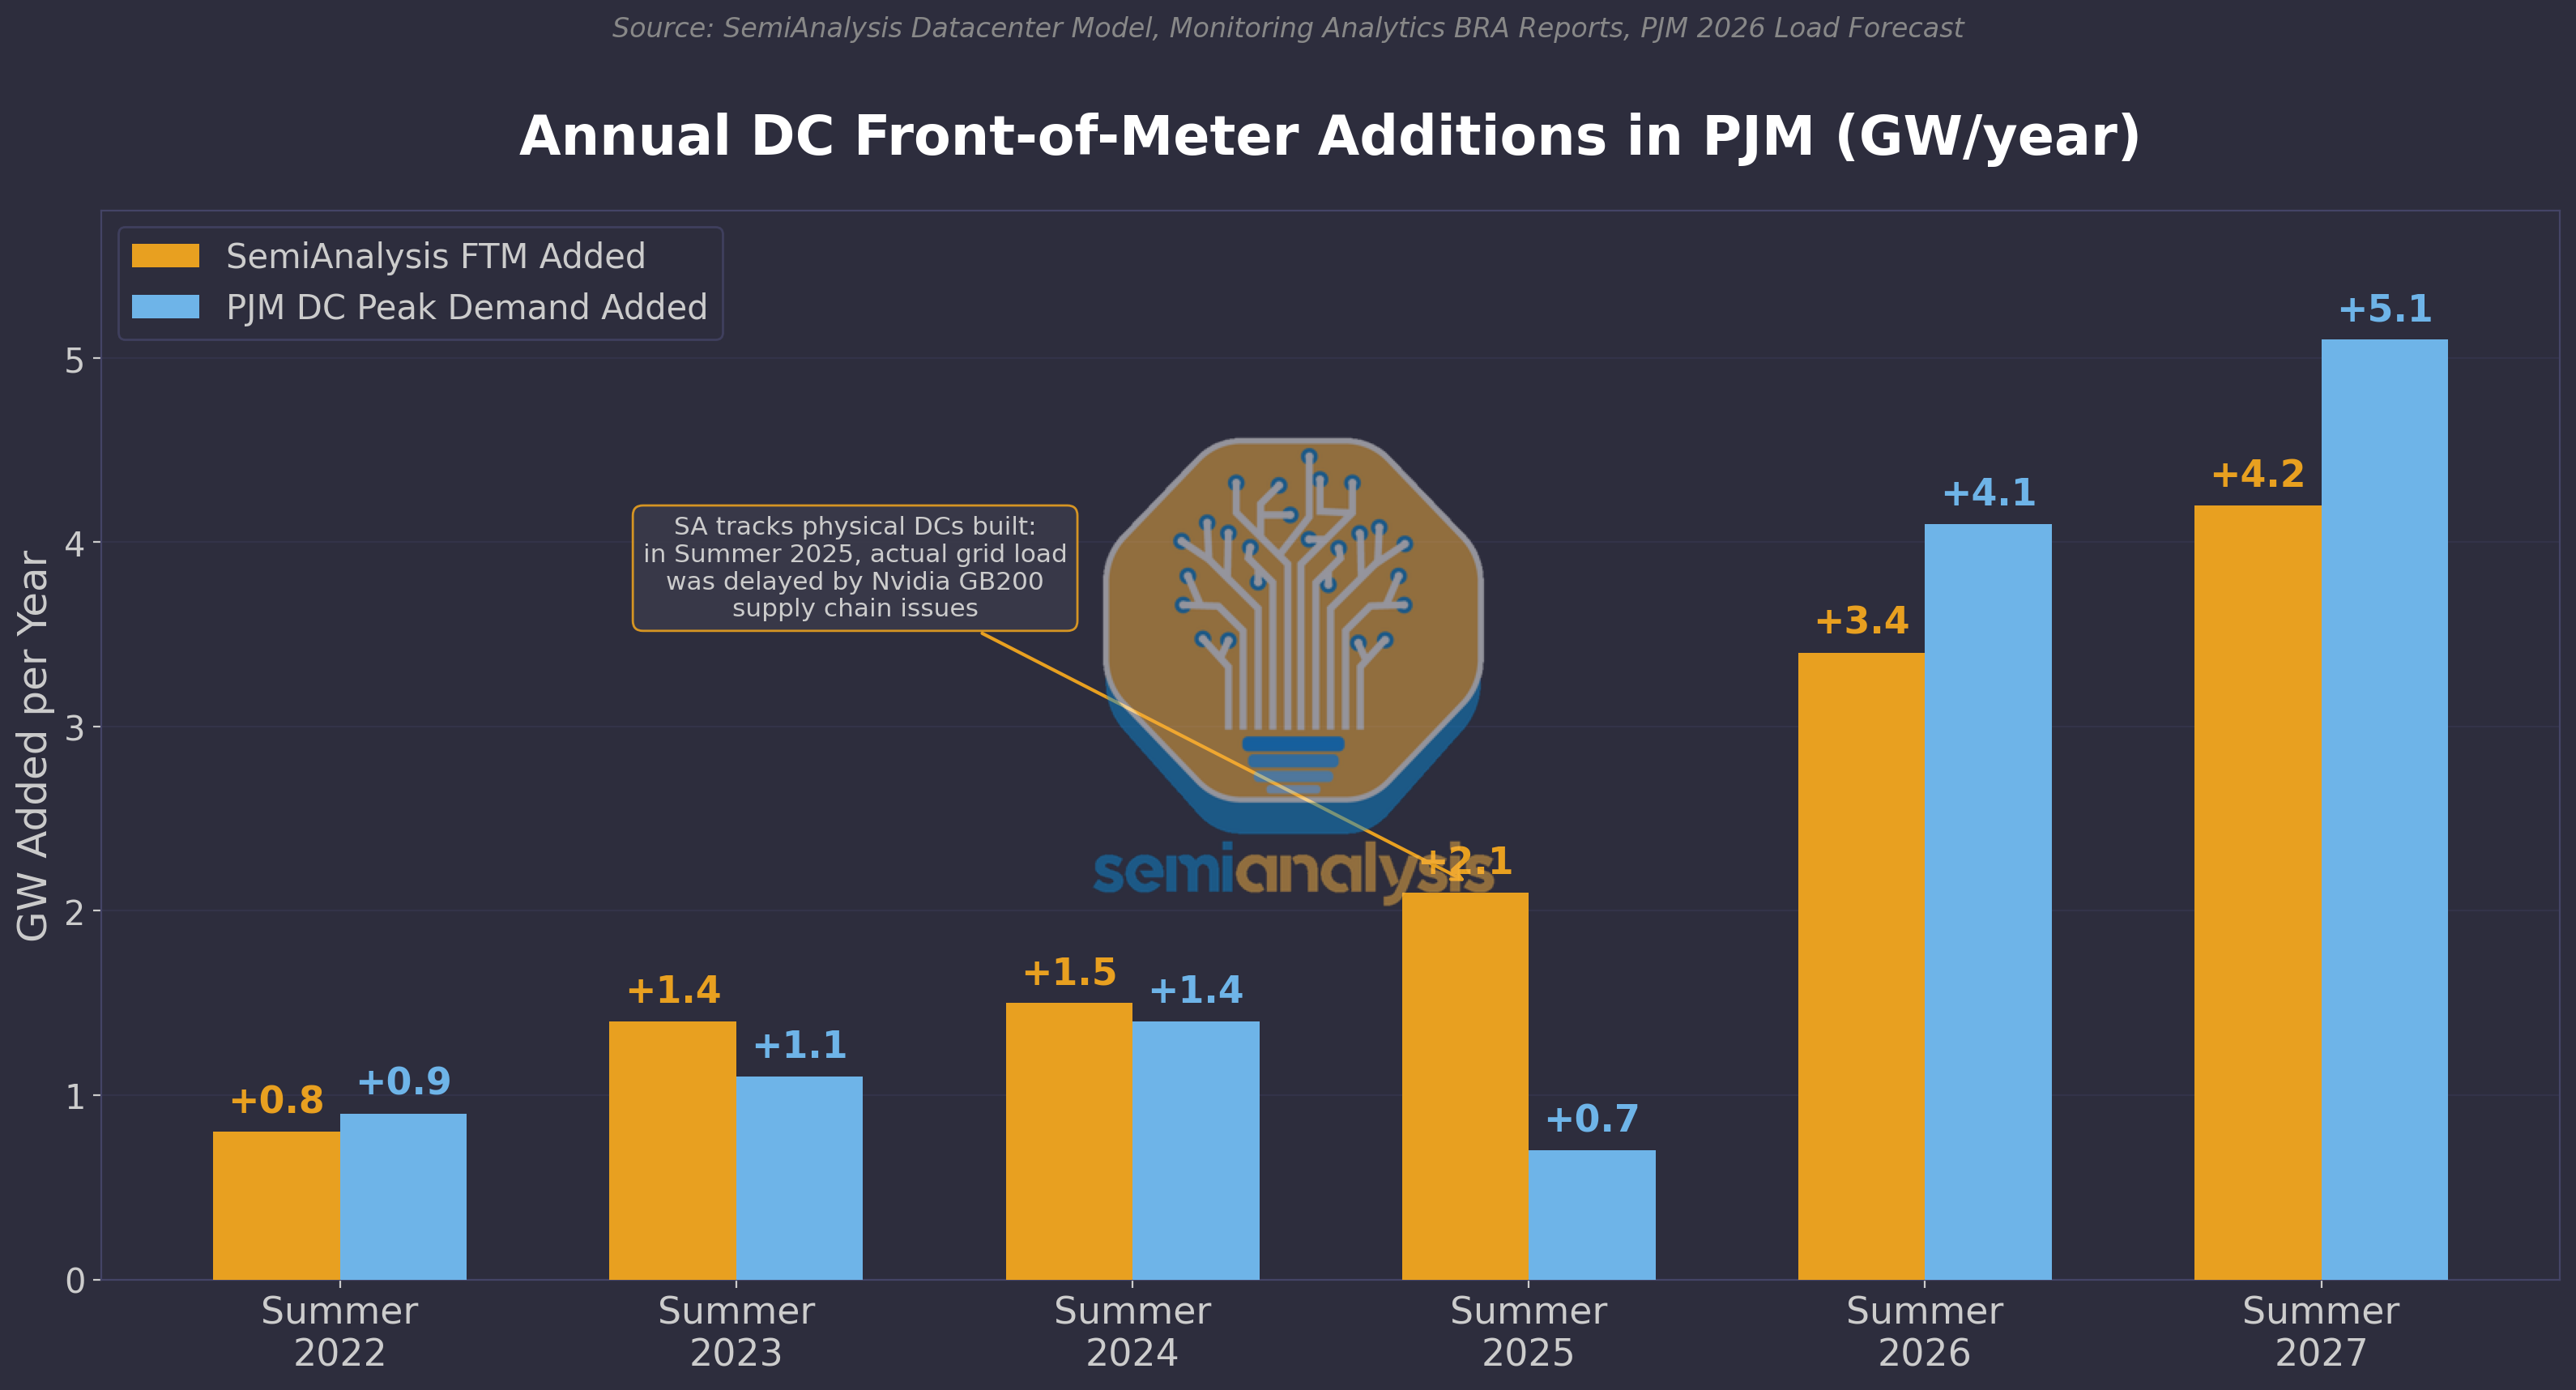
We show below a great example of this. PJM’s own data shows an inability to forecast even one year out. In 2024, the datacenter load forecast was cut by 800MW versus the 2023 load forecast. In 2025, it happened again: the datacenter load forecast was cut by 1.1GW versus what had been forecasted just a year ago, in 2024 !
Forward Energy Prices Tell a Different Story
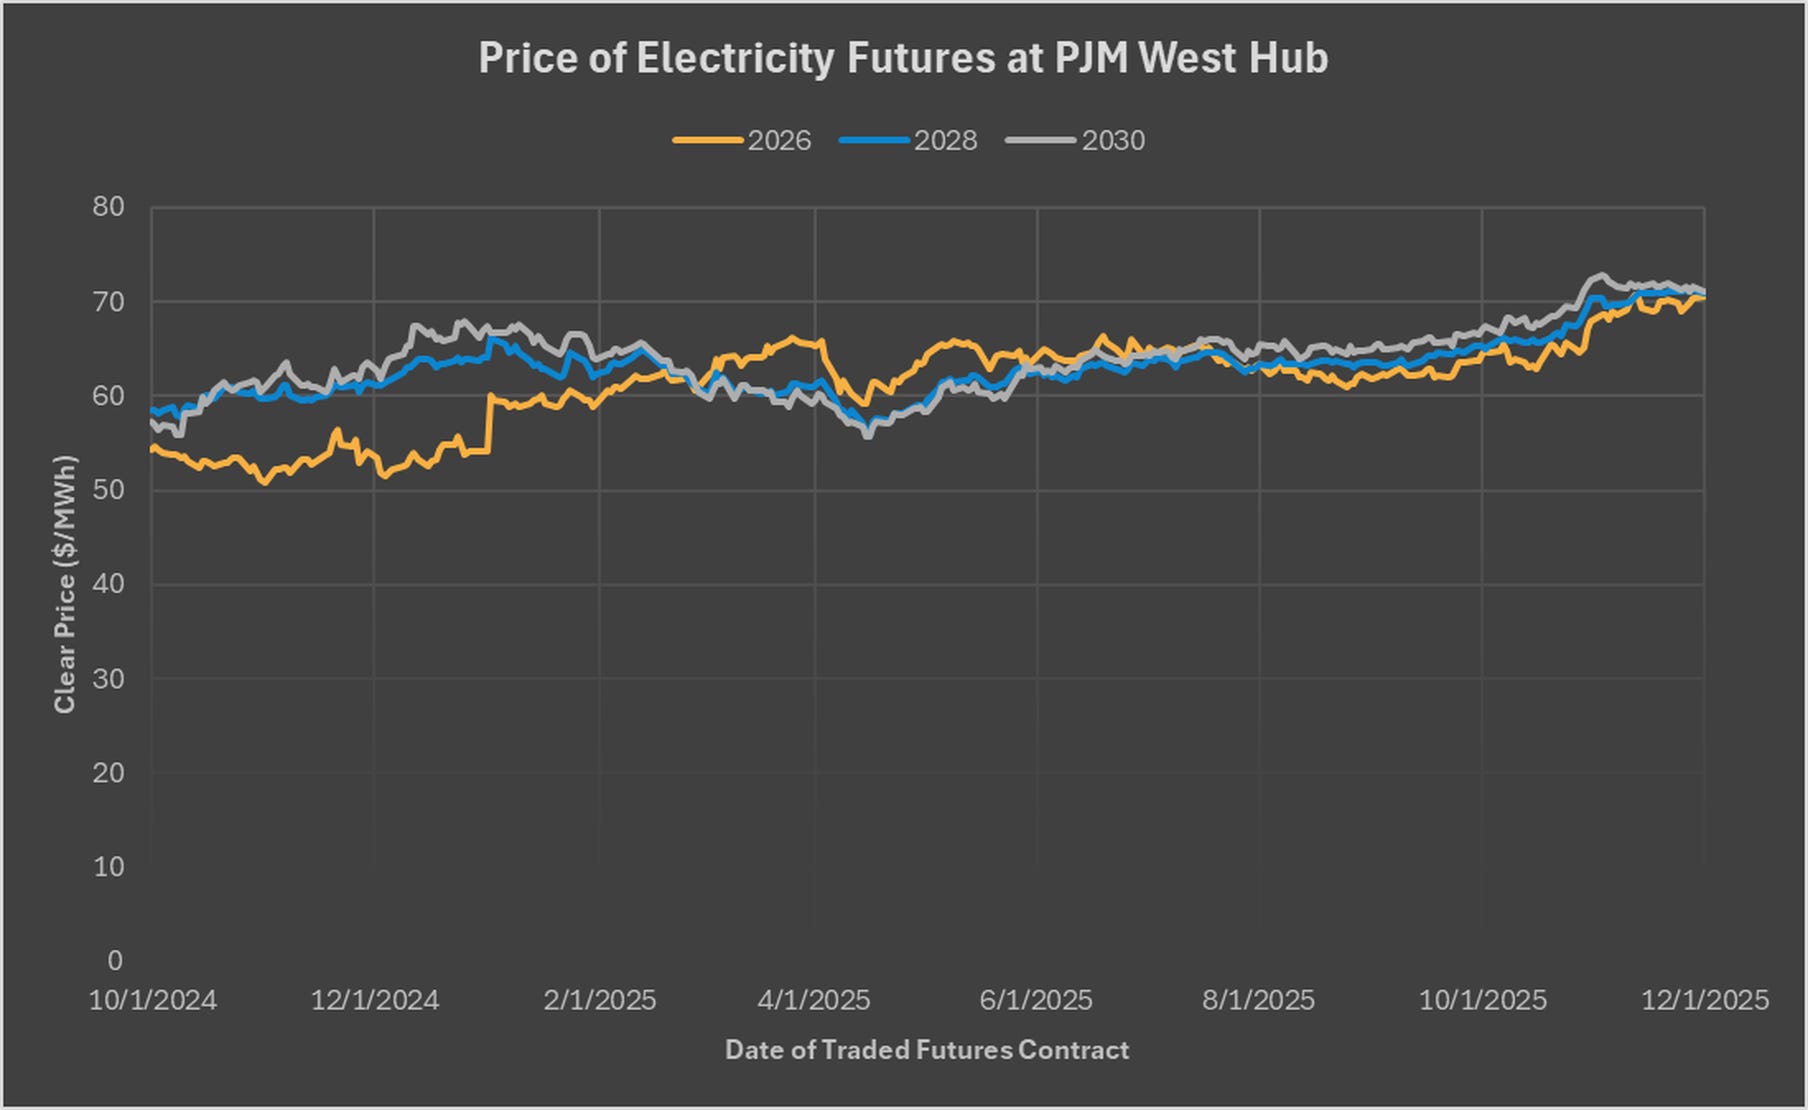
The energy market in PJM remains closer to a real market, with supply and demand balances that return a moving price per MWh of electricity. These prices spike during heat waves, fall during mild weather, and use distributed market actors to track gas prices, transmission congestion, and renewable output -- like a market should.
PJM Western Hub forward prices -- the most liquid benchmark for energy traders’ view of the future -- have increased 12-20% in the 2028 and 2030 windows, with the 2026 window jumping somewhat higher. These are meaningful increases, but nothing resembling the 9.3x explosion in the capacity market. PJM’s simulation-heavy capacity construct is producing a price shock that the forward energy market does not validate. Traders, using real money and real risk, are not pricing in the same panic that PJM’s simulated VRR curve produced.
PJM’s supply-side forecast is also simulated
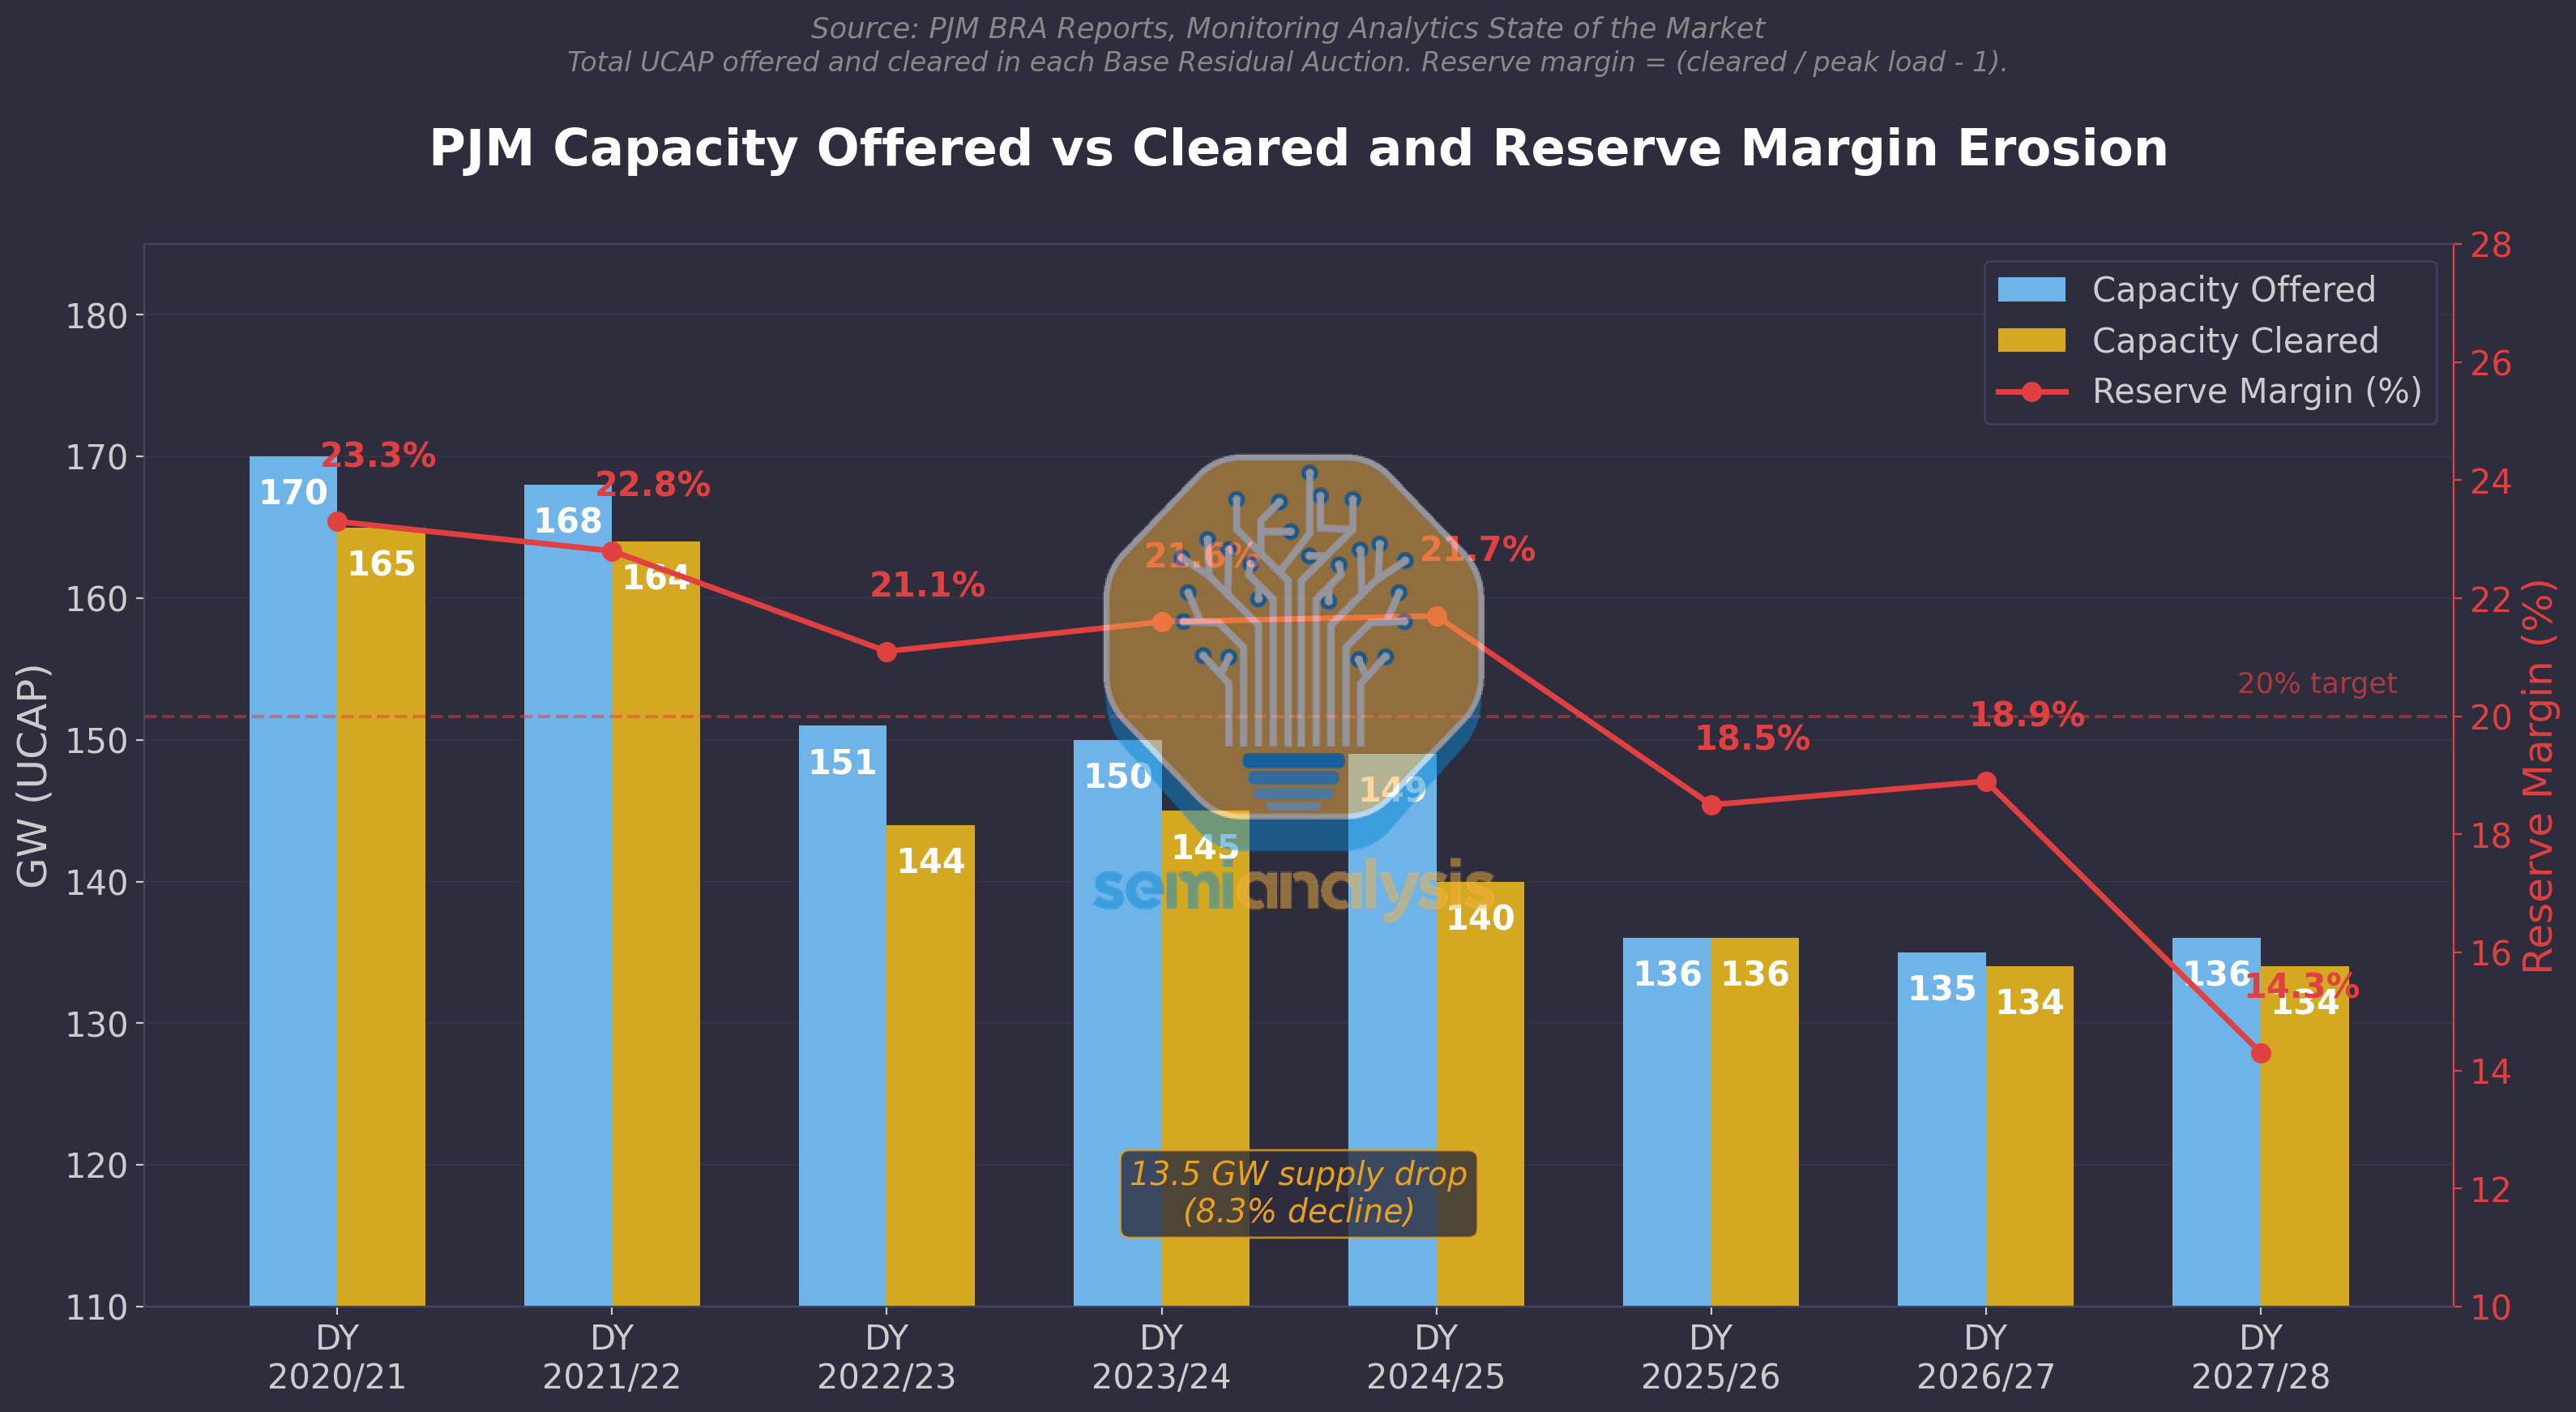
PJM’s forecast and methodology are also impacting the supply side of the forecast. A year before the AI Datacenter boom, issues had already begun to rise. As shown below, total offered capacity has been reduced by ~35GW in just four years. Where did that supply go?
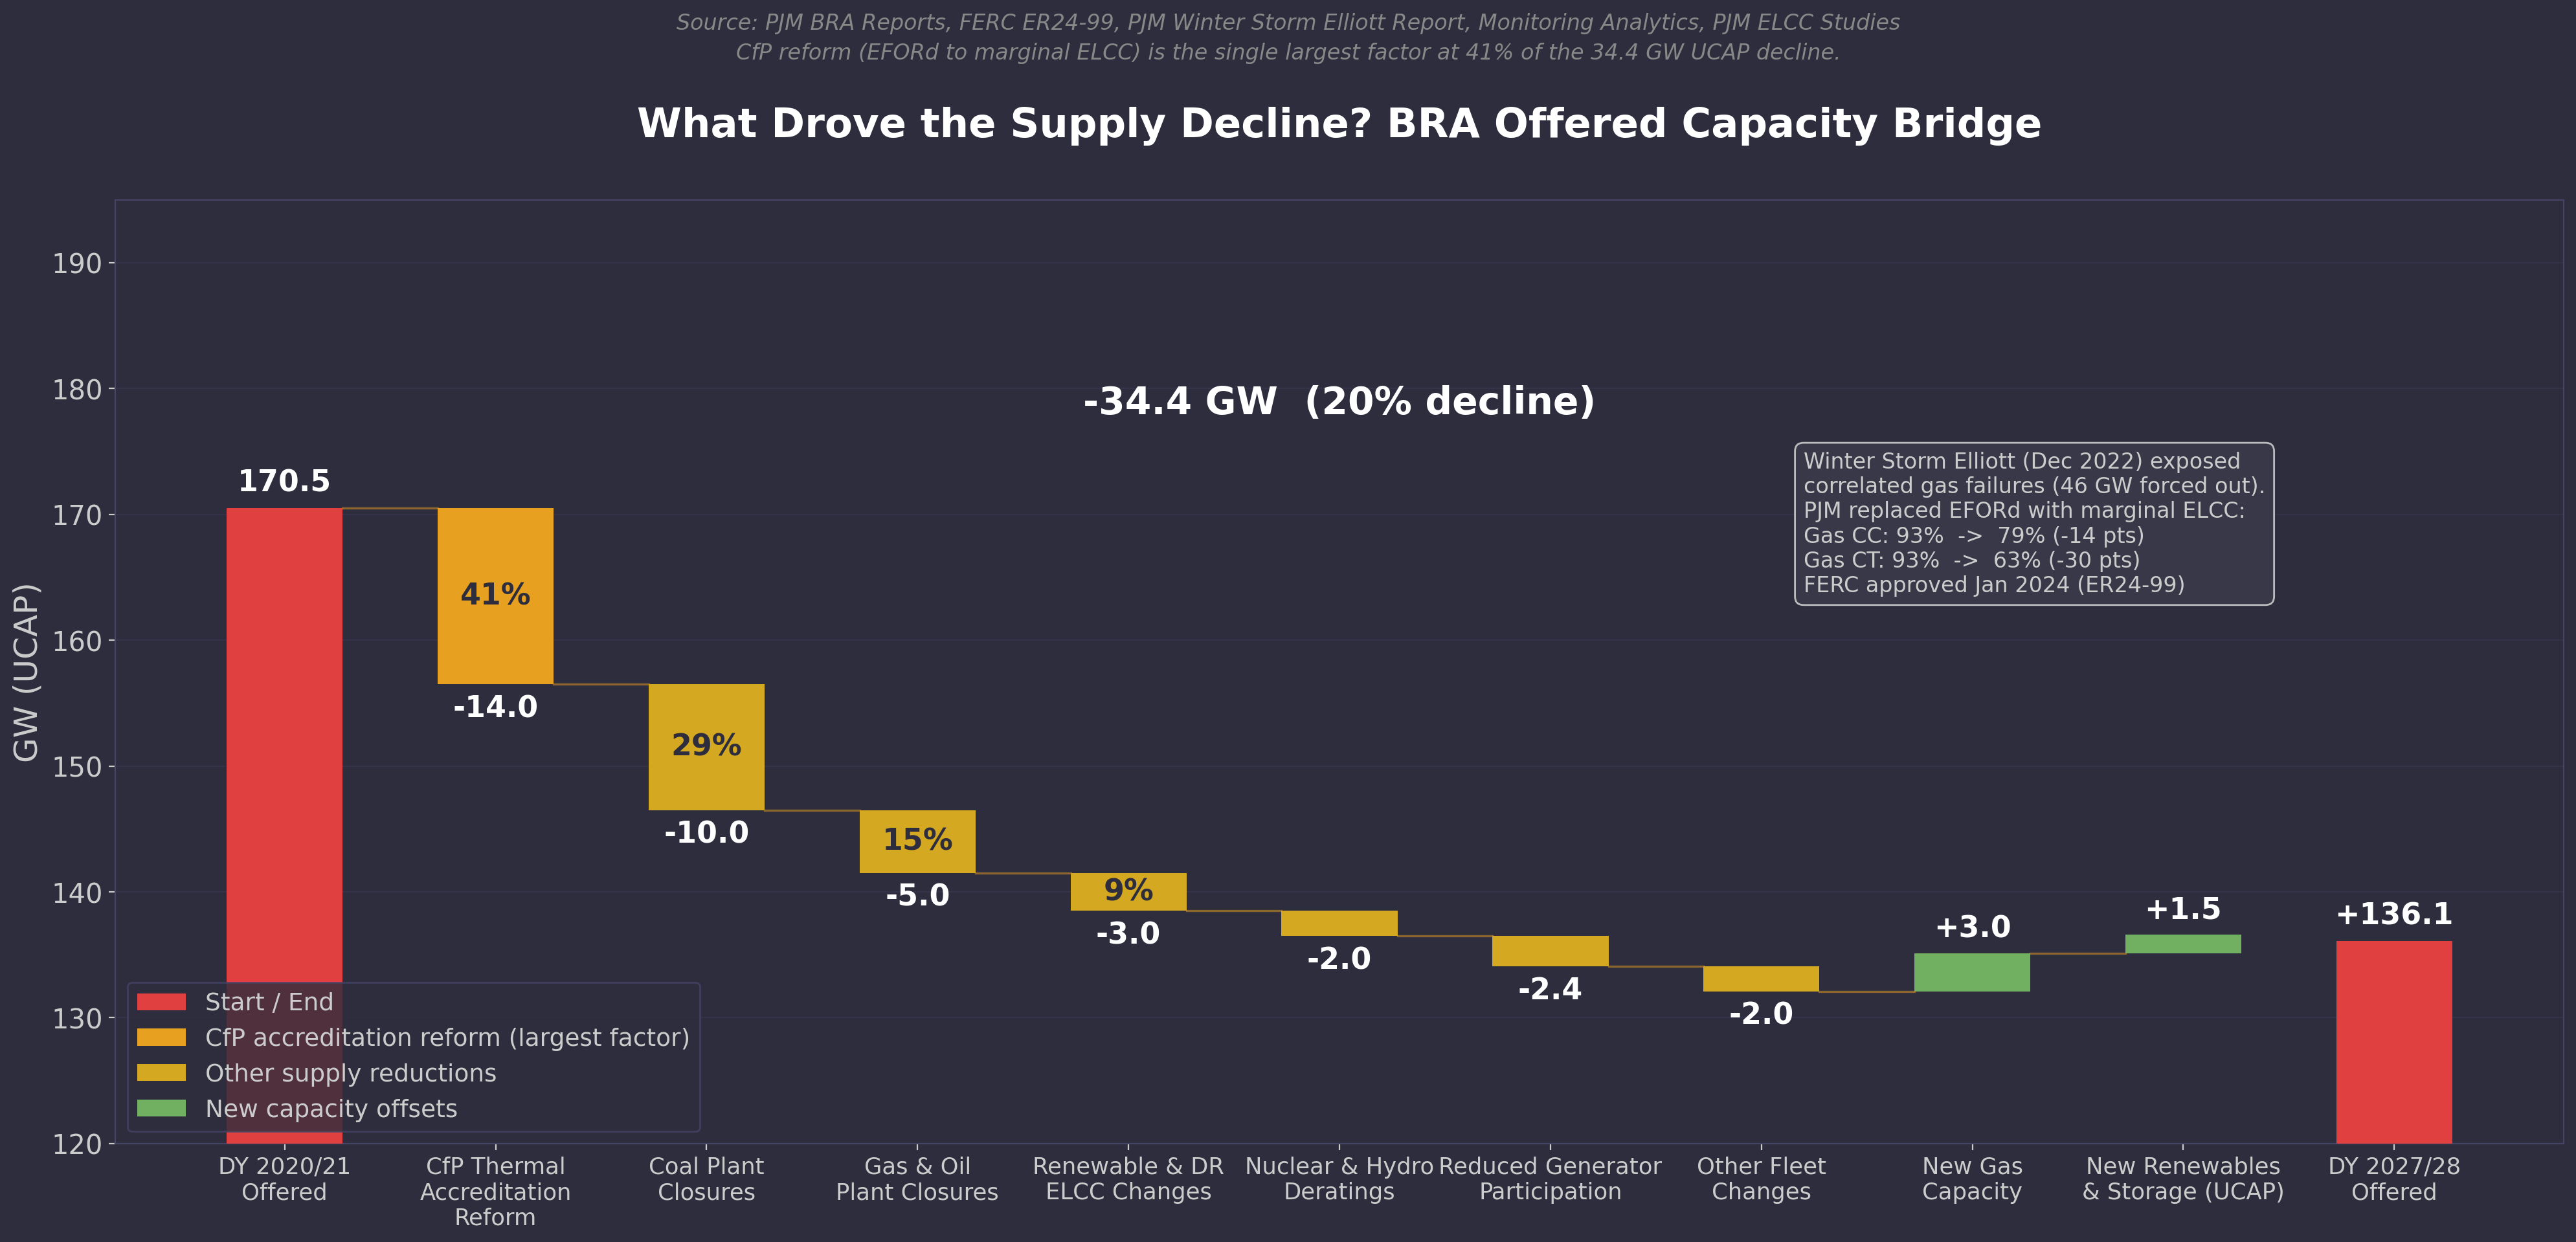
As shown below, while coal retirements were the biggest drivers, PJM also introduced major methodology changes that caused close to 20GW of supply to disappear. A methodology change on how PJM accounts for natural gas power plants made 14GW disappear overnight.
How Capacity Prices Hit Household Bills
The 2026/27 Base Residual Auction (BRA) clearing price of $329/MW-day represents a tangible cost increase for every load in PJM. These costs are ultimately recovered through retail rates, appearing as higher capacity charges for utilities, suppliers, and large customers. In total, the auction translates to approximately $16 billion in total capacity payments, or roughly $120,000 per MW.
To estimate the impact on retail bills, we need the following datapoints:
· Average power consumption per household: in PJM, that’s 880 kWh per month.
· “Load factor”, i.e. average usage to peak usage. Empirical data shows 40% as a common value.
· Capacity prices: at $329/MW-day, we can divide this by the number of hours per day, and apply the 0.4 load factor, to get $34/MWh (or 3.4c/kWh).
Multiplying 3.4 by the monthly consumption (880 kWh) gets us a $29.9 monthly payment. Given the auction has already been cleared, we have near-certainty that households will pay $25-30 more per month than two years ago!
Let’s now turn our attention to Texas, to see how power prices have responded to the massive AI Datacenter surge.
ERCOT: Same Load Growth, No Price Shock
The Electric Reliability Council of Texas (ERCOT) is a much simpler market to understand. It runs a unified market mechanism balancing supply and demand based on real-time prices. ERCOT does not have two separate markets, and does not make forecasts that impacts directly market needs.
Scarcity Pricing Instead of a Capacity Auction
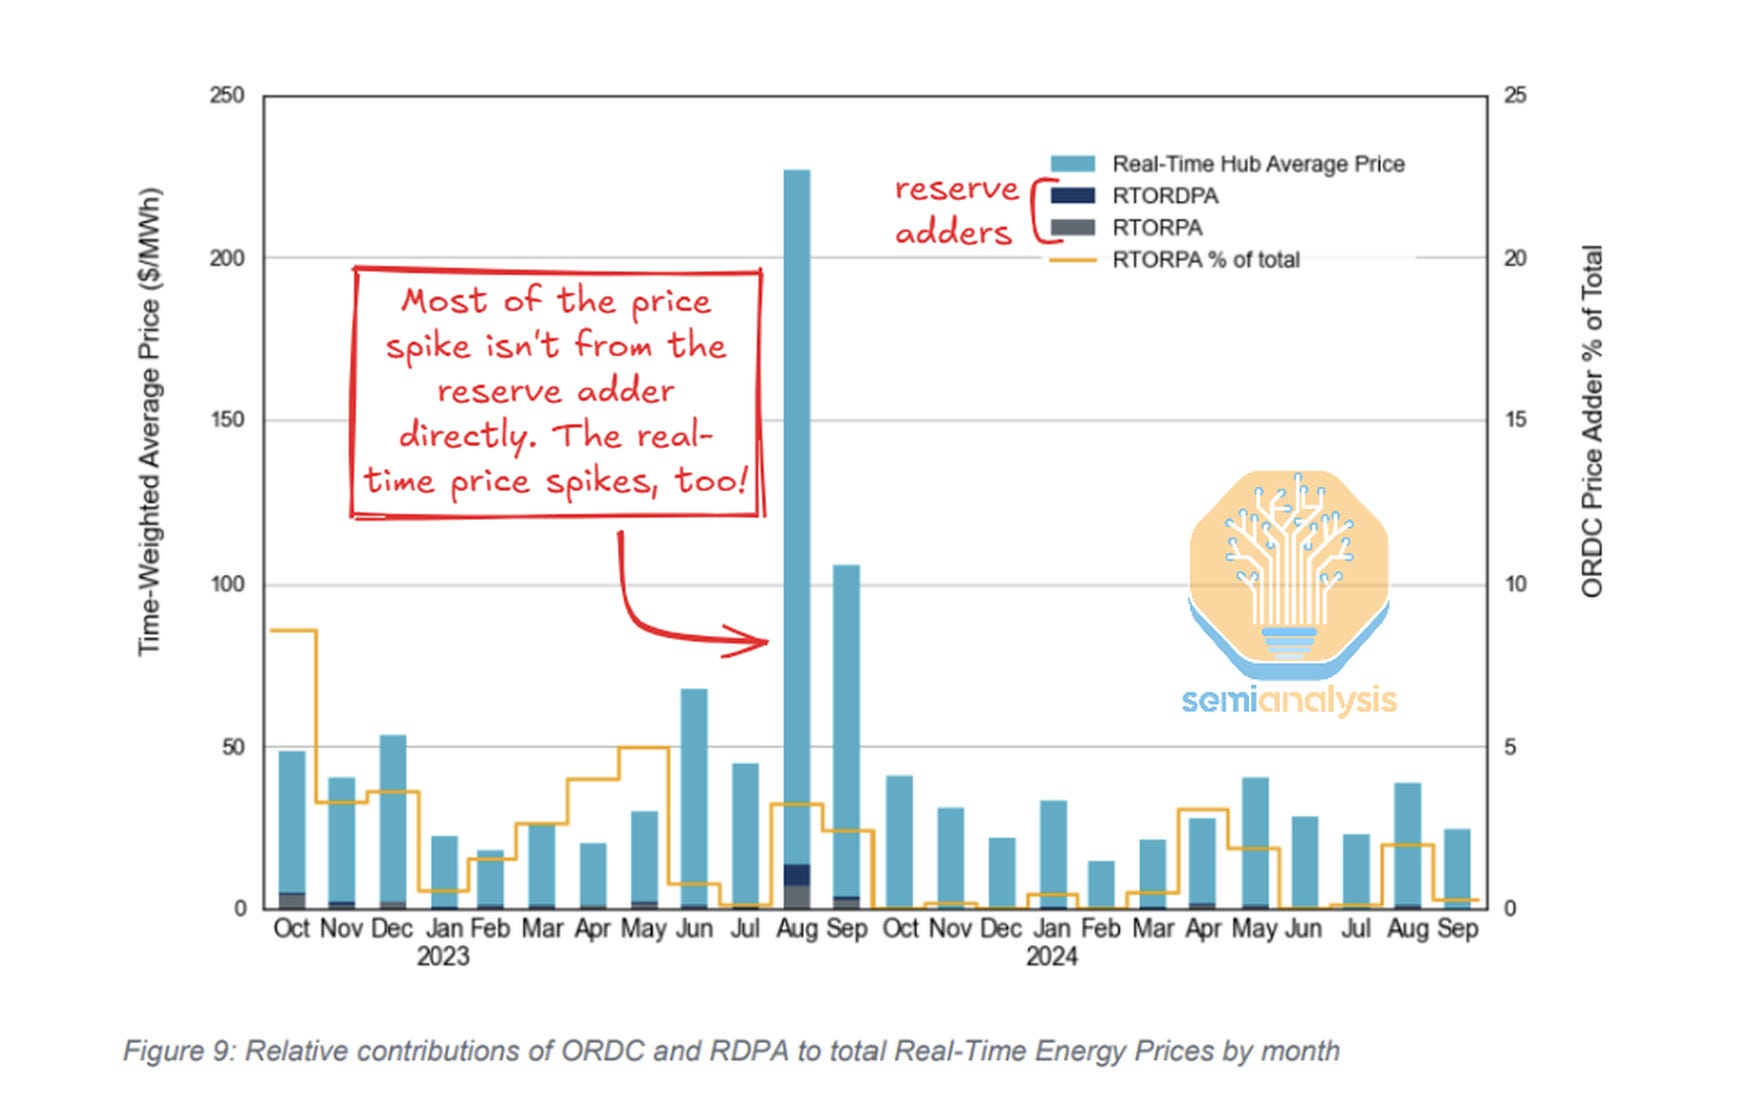
Instead of a capacity market driven by a once-a-year auction, ERCOT uses a real-time scarcity price adder based on an Operating Reserve Demand Curve (ORDC). When the balance between electric supply and demand gets too tight -- when everyone’s air conditioner runs at the same time -- the real-time energy price spikes, from normal prices of $10-50/MWh to a cap of $5,000/MWh, with additional adders in transmission-constrained areas.
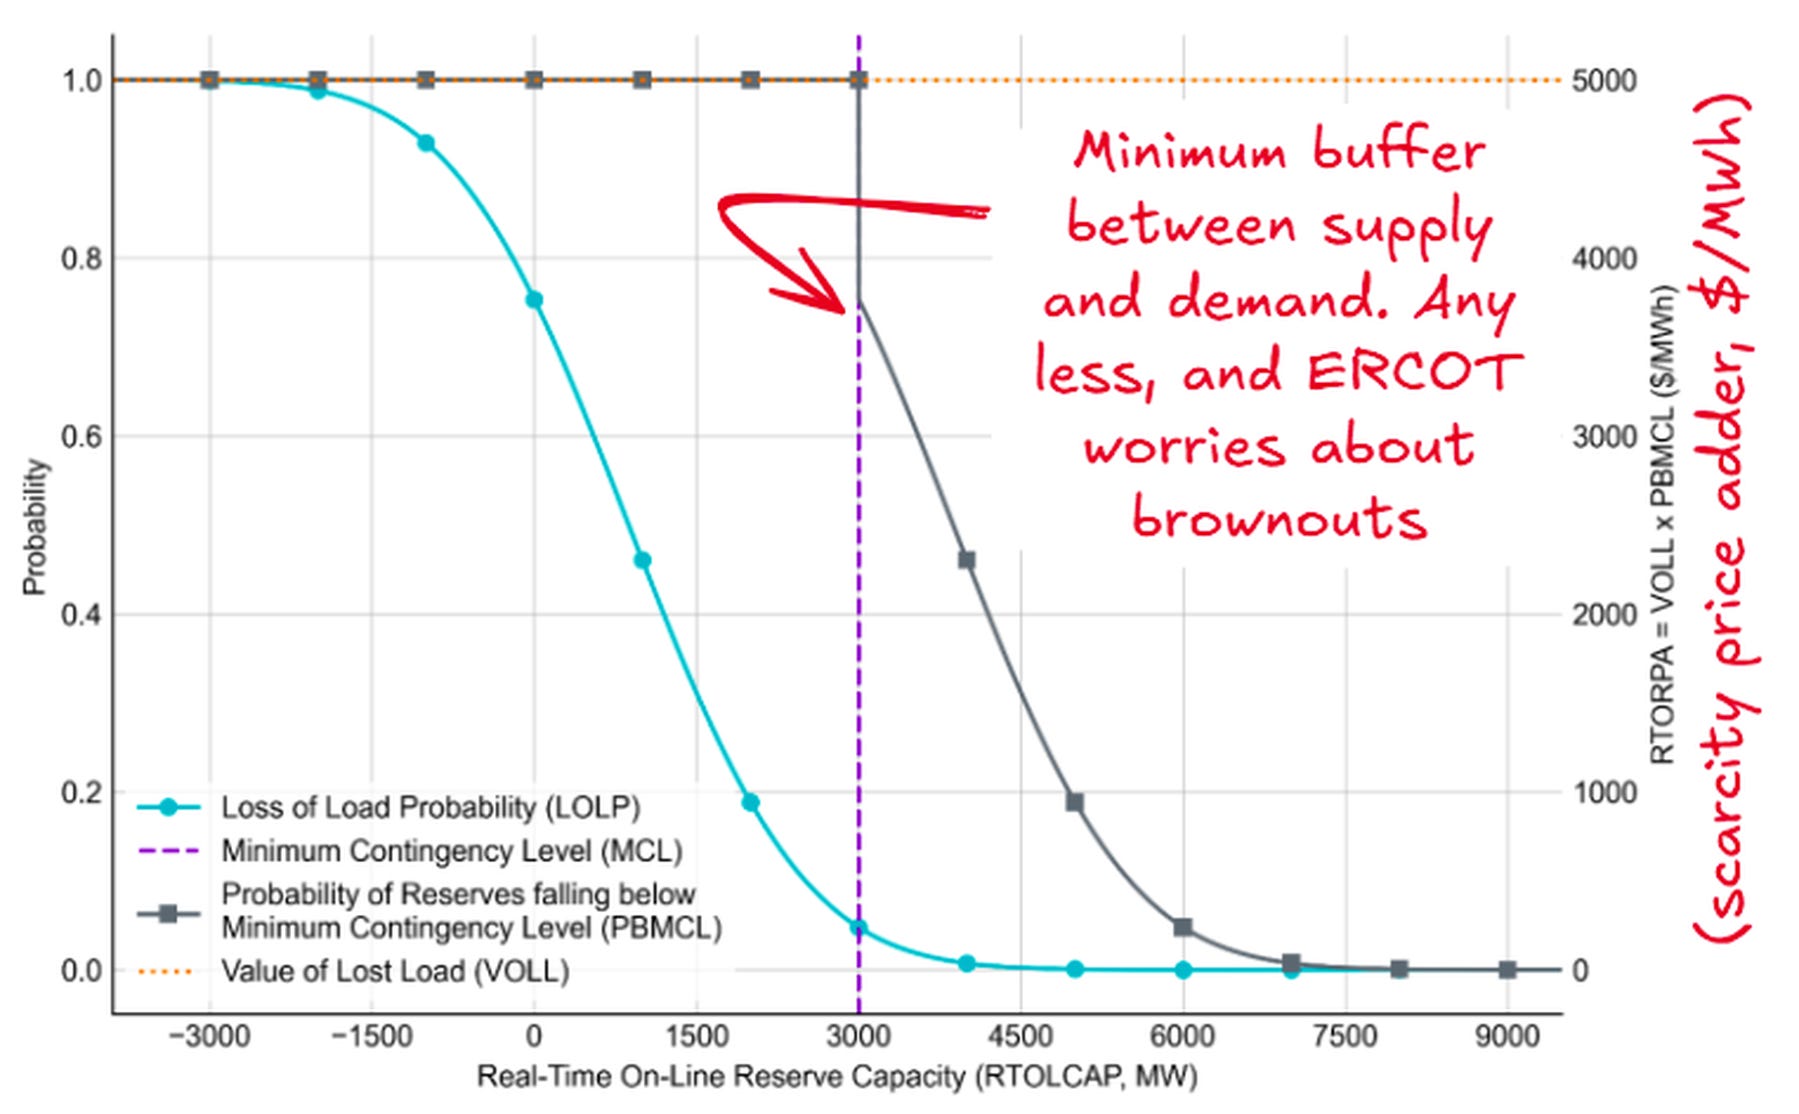
This scarcity-price structure allows capacity resources that run fewer than 100 hours per year (gas peaker plants, batteries, etc) to pay for themselves, because that handful of run-hours can still be worth millions of dollars in annual revenue to a 50 MW power plant or battery system.
Said differently: in PJM, the central operator has the responsibility to analyze the system, determine capacity needs, and guarantees payment to power plant owners to provide capacity. In ERCOT, there’s no guarantee and it falls on the asset owners to make analysis and use their judgement on whether the market has enough capacity or not. Real-time pricing signals are a proof of market constraints.
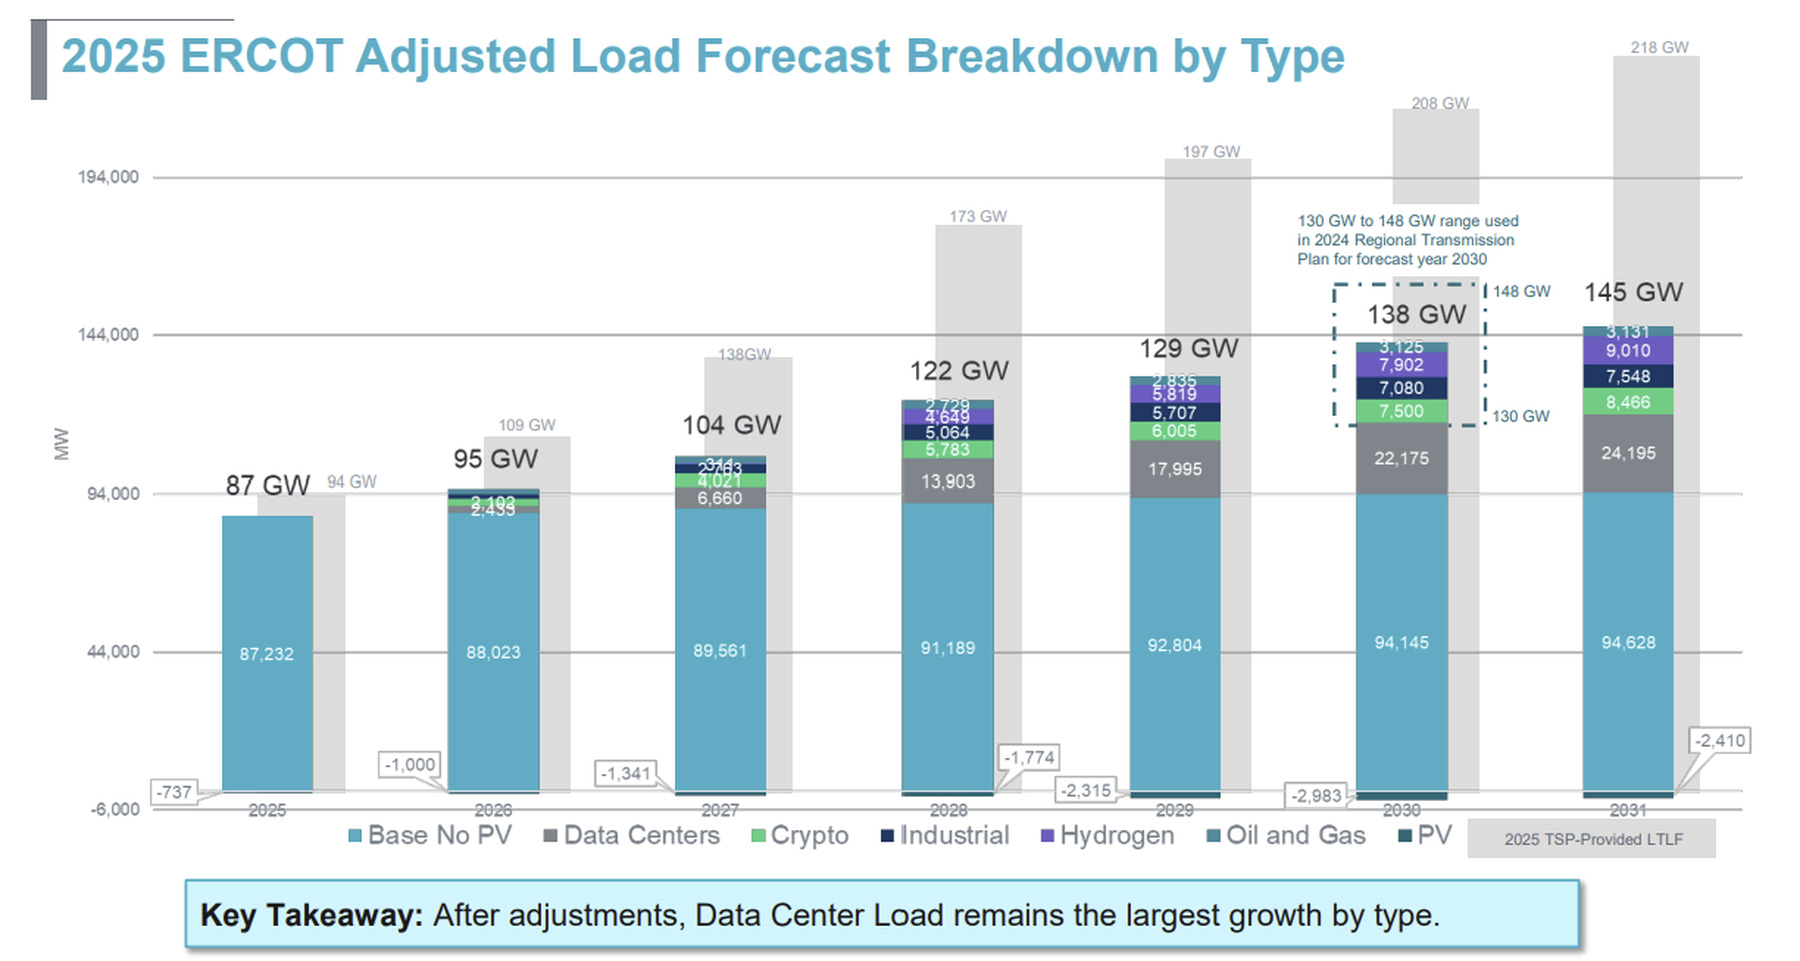
ERCOT’s Demand Forecast: Extraordinary -- and Largely Ignored
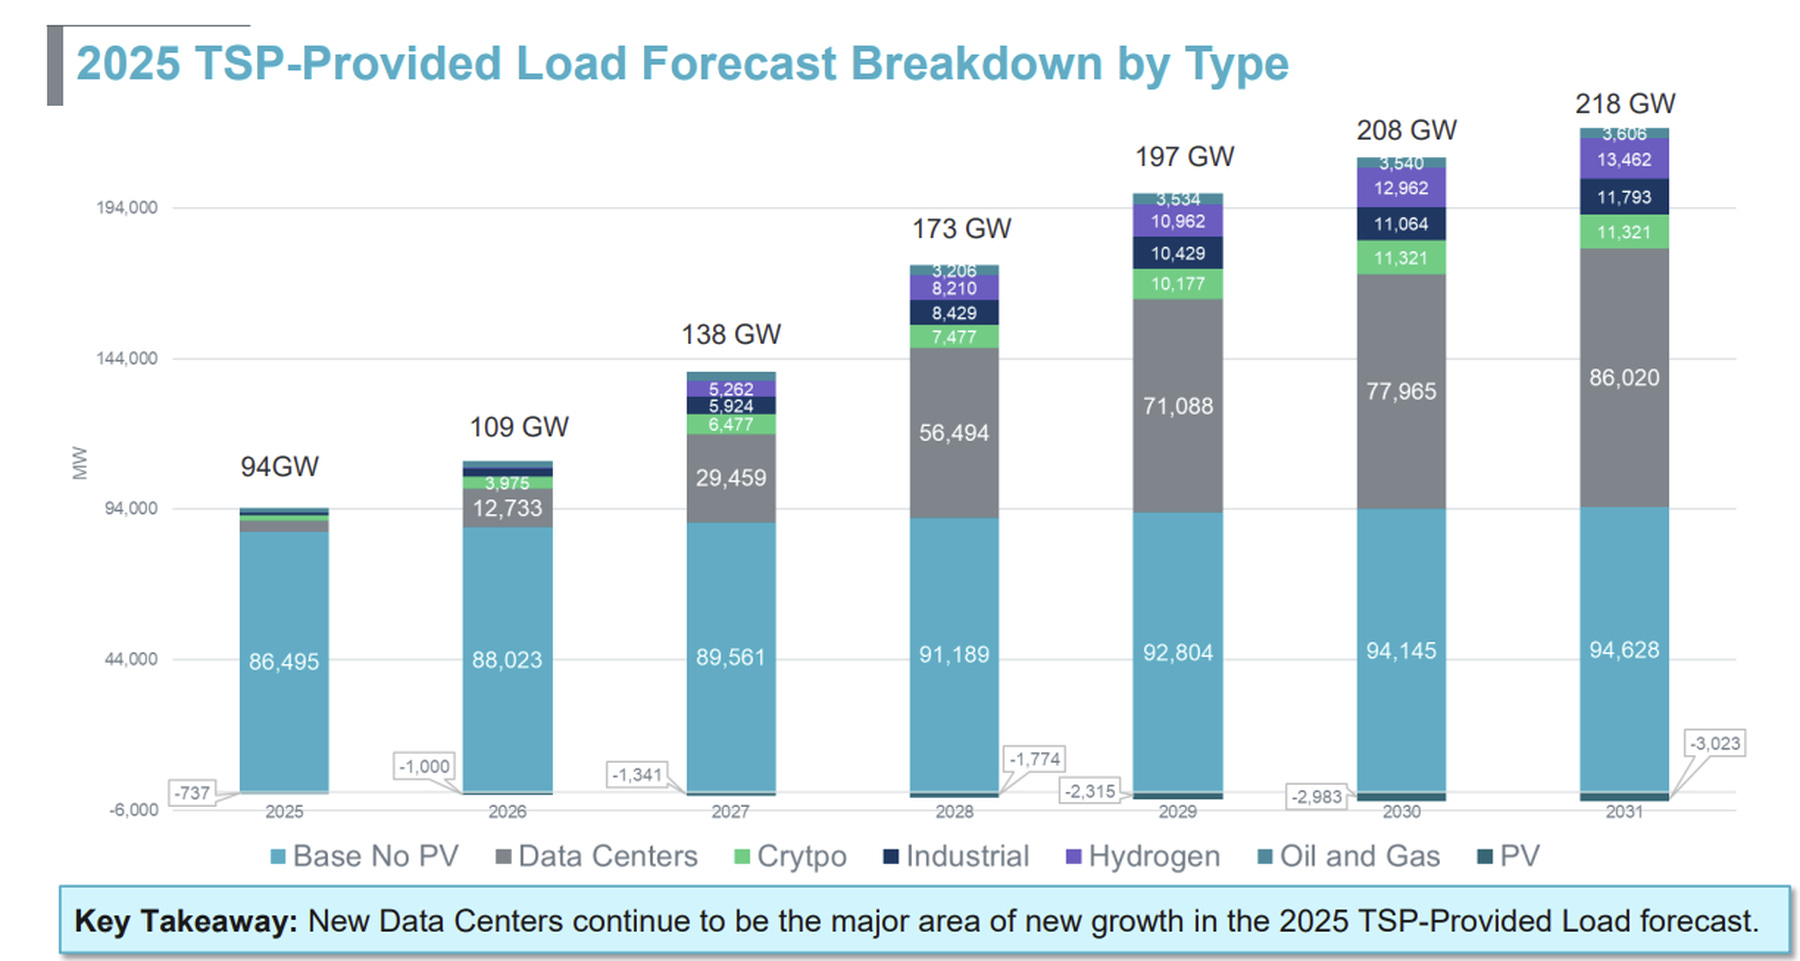
This difference is particularly interesting as ERCOT also provides demand forecasts. And the outlook is staggering. The 2025 Long-Term Load Forecast, released April 2025, identified datacenters as the single largest driver of incremental peak growth. Based partly on attestation from Texas transmission service providers, ERCOT projected 77.9 GW of potential datacenter load by 2030 -- more than double the 29.6 GW in the prior year’s outlook, an unprecedented one-year revision.
Taken at face value, that forecast implies a structural demand shock on the order of an entire new ERCOT system layered on top of today’s load curve. In reality, no one believed in these numbers, and the market largely ignored them.
Even ERCOT recognized that their forecast was not realized and changed course. In the May 2025 Capacity, Demand and Reserves report, they applied a deliberate haircut: generic requests were discounted to 49.8%, officer-attested requests to 55.4%, and all in-service dates pushed back by 180 days. ERCOT’s internal grid analysts effectively said they would not plan for 100% of what developers claim until shovels actually move.
But the difference here is that ERCOT’s load forecasts and interconnection queue constraints do not directly drive electricity prices. PJM’s forecasts drive a simulated supply-demand curve, which in turn directly determines the bounds of what system capacity can cost. ERCOT uses its demand forecasts to guide system planning, transmission expansion, and resource adequacy studies -- not as a direct pricing input. ERCOT’s approach embeds skepticism that filters speculative demand before it can influence market outcomes.
More Datacenter Load, Less Scarcity
The physical system confirms ERCOT’s approach is working. The grid has already experienced record-breaking peaks of over 90 GW in summer 2024 and a spring record of 78.4 GW in May 2025. Hyperscaler demand growth in Texas is already enormous, and there have been no brownouts since.
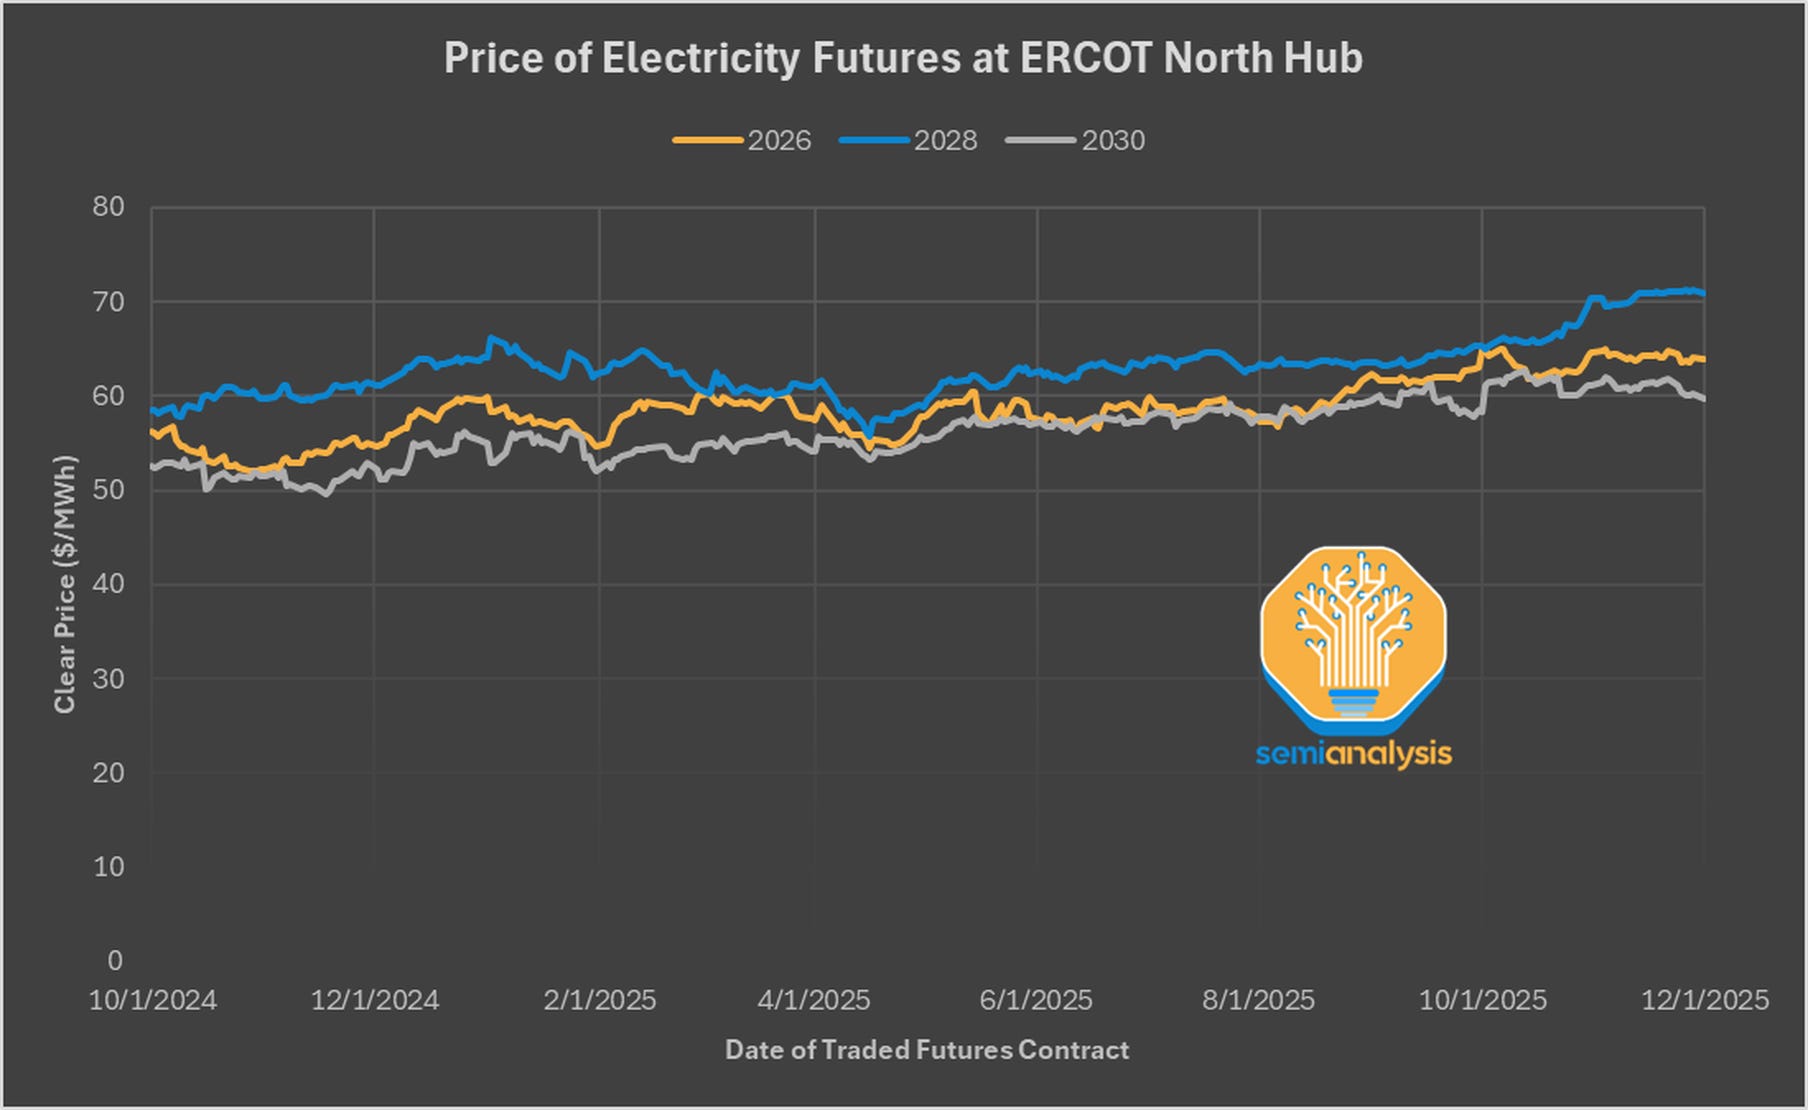
The prices that energy traders see have not gone to the moon either. Forward prices -- particularly 2026, 2028, and 2030 contracts -- have increased 11-17% in the past year, a notable increase and roughly similar to that of PJM, but no 9x surge in capacity prices.
The 2024 Biennial ORDC Report explains that more online reserves were available than in prior cycles, allowing for steady, calm growth. Solar, wind, batteries, and fossil fuel peakers all came online in sufficient volume to cushion the system. The measurable effect was that the number of hours with scarcity pricing and the total spend on scarcity pricing fell relative to previous years. Energy is now less scarce in ERCOT territory despite the increase in electric demand. It takes more incremental gigawatts of demand to push the system into true scarcity conditions than it did even two years ago. In their public messaging, ERCOT’s concerns about datacenter growth leave out resource scarcity worries.
The forward wholesale price curve tells us that traders believe ERCOT can absorb the growth. They are betting on supply expansion, improved reserves, and SB 6 curtailment authority to mitigate scarcity in the long term. That skepticism mirrors ERCOT’s own haircutting of developer submissions. The system operator discounts the raw datacenter claims in its forecast; the market discounts them in its forward prices.
ERCOT also moves much faster: one of its key advantages over PJM is that it only covers one state and is not subject to FERC jurisdiction. On the other hand, PJM has to deal with FERC and with 13 states.
Winter Storm Fern: Paying for Reliability vs. Delivering It
Winter Storm Fern (January 24-27, 2026) was the first real-world stress test of PJM’s record-high 2025/26 capacity prices and of ERCOT’s market discipline under operational pressure.
ERCOT: No Crisis
ERCOT’s grid held through the January freeze. The Weather Watch issued by the grid operator remained precautionary. Demand ran below forecasts, no emergency procedures were triggered, and the system maintained adequate reserves. Beyond the standard poles-and-wires outages common to winter storms, the Texas grid faced no problems.
This was the proof that Texas had learned its lesson from the disastrous Winter Storm Uri. The post-Uri reforms -- mandatory winterization of gas production and generation facilities, improved coordination between gas and electric systems, and strengthened operational protocols -- proved effective under real conditions
Real-time prices in ERCOT peaked around $300/MWh.
PJM: $270/MW-Day Bought a 21 GW Failure
PJM’s grid fared dramatically worse. Despite capacity markets having already priced in datacenter load risk through record-high clearing prices, the grid lost approximately 21 GW of generation capacity -- 15% of the fleet that cleared in the auction -- to frozen equipment and fuel delivery failures.
The Department of Energy was forced to issue emergency orders under Section 202(c) of the Federal Power Act, authorizing grid operators to bypass environmental limits and access roughly 35 GW of backup generation capacity at datacenters and industrial sites nationwide -- capacity that would have been ineligible for the BRA.
Real-time electricity prices reflected the operational stress. PJM averaged $700/MWh system-wide, with Virginia’s datacenter-heavy Dominion zone spiking to $1,800/MWh.
That also demonstrates another failure of PJM’s capacity market. In PJM, plants get paid no matter what, even if they fail when needed. In ERCOT, power plants only generate significant revenue during tight reserve margins when they actually generate and deliver to the grid — so they have a strong reason to keep equipment working in cold weather.
What the Storm Revealed
The storm exposed the fundamental disconnect in PJM’s capacity market. High capacity prices had been driven by forecasts of datacenter load growth -- a risk that did materialize. But the actual operational failures came from inadequate winterization and fuel infrastructure vulnerabilities that the capacity market had not incentivized addressing. PJM’s 9.3x capacity price increase was supposed to buy reliability. It did not.
ERCOT had not priced speculative datacenter growth into elevated capacity charges, yet its mandatory operational reforms delivered grid stability when tested. Lower cost, better outcome.
The 35 GW of datacenter backup generation identified by DOE during the storm also demonstrated something important: datacenters can function as grid resources when properly integrated. While ERCOT managed the storm without requiring activation of these backup resources, their availability represented a significant reliability buffer that neither market had systematically priced into forward planning. This is an untapped asset class that both regulators and investors should be watching.
What Comes Next
The Political Fallout Is Already Here
PJM’s simulation-driven pricing has made the capacity market a political target. After the 2025/26 auction spike, Pennsylvania Governor Josh Shapiro filed a FERC complaint alleging the BRA rules were unjust. A FERC-approved settlement imposed a tighter price cap — a temporary collar for the 2026/27 and 2027/28 delivery years. This is why the 2027/28 auction cleared at nearly the same price as the prior year.
But the cap didn’t fix the underlying mechanism. The VRR curve, the demand forecast methodology, all remain unchanged. The bandaid also created a new problem: a reserve margin below PJM’s own reliability targets. The grid still performs and maintains a reserve margin, but the margin is shrinking, and the capacity market’s ability to attract new generation investment is now compromised by regulatory uncertainty over future price caps.
Attempts have been made to change the PJM’s structures, but regulations and considerations are fierce. PJM’s attempt to introduce Non-Capacity-Backed Load (NCBL) rules — essentially a mechanism to curtail large loads that haven’t secured their own capacity — was uniformly condemned by stakeholders and withdrawn. FERC’s Advance Notice of Proposed Rulemaking (ANOPR) on large loads and datacenters signals increased federal scrutiny, but all in all, any rulemaking from FERC will take years and face legal challenges.
The Regulatory Asymmetry
ERCOT can move faster because its regulatory structure is simpler. ERCOT’s service territory is entirely within Texas, so the Texas legislature and Public Utility Commission regulate it directly. SB 6 was passed, signed, and operational within a single legislative session. PJM’s service territory spans 13 states and the District of Columbia, and its regulatory authority comes from FERC. Replicating anything like SB 6’s curtailment authority would require FERC approval and potentially federal legislation, taking years instead of months.
This structural asymmetry is durable and investable. ERCOT will continue to be able to adapt its market rules and operational requirements faster than PJM can reform its capacity construct. For hyperscalers making 10-year site-selection decisions, this regulatory agility matters as much as the current price differential.
Winners & losers and the shifting market bottlenecks
This takes us to the next section: winners and losers. A key issue in PJM’s forecast is their inability to see the big picture. Below, we discuss the shifting constraints, what it means for equipment vendors of onsite gas solutions like GEV, CAT and Bloom Energy, equipment suppliers like Vertiv, IPPs like Vistra and Talen, and datacenter developers & cryptominers.
Paid subscribers can scroll down below the disclaimers to access the rest of the report.
Disclaimers
SemiAnalysis Disclaimer
Analyst Certifications and Independence of Research.
Each of the analysts whose names appear in this report hereby certify that all the views expressed in this Report accurately reflect our personal views about any and all of the subject securities or issuers and that no part of our compensation was, is, or will be, directly or indirectly, related to the specific recommendations or views of in this Report.
SemiAnalysis LLC (the “Company”) is an independent equity research provider. The Company is not a member of the FINRA or the SIPC and is not a registered broker dealer or investment adviser. SemiAnalysis has no other regulated or unregulated business activities which conflict with its provision of independent research.
Limitation of Research and Information.This Report has been prepared for distribution to only qualified institutional or professional clients of SemiAnalysis LLC. The contents of this Report represent the views, opinions, and analyses of its authors. The information contained herein does not constitute financial, legal, tax or any other advice. All third-party data presented herein were obtained from publicly available sources which are believed to be reliable; however, the Company makes no warranty, express or implied, concerning the accuracy or completeness of such information. In no event shall the Company be responsible or liable for the correctness of, or update to, any such material or for any damage or lost opportunities resulting from use of this data.
Nothing contained in this Report or any distribution by the Company should be construed as any offer to sell, or any solicitation of an offer to buy, any security or investment. Any research or other material received should not be construed as individualized investment advice. Investment decisions should be made as part of an overall portfolio strategy and you should consult with a professional financial advisor, legal and tax advisor prior to making any investment decision. SemiAnalysis LLC shall not be liable for any direct or indirect, incidental or consequential loss or damage (including loss of profits, revenue or goodwill) arising from any investment decisions based on information or research obtained from SemiAnalysis LLC.
Reproduction and Distribution Strictly Prohibited.
No user of this Report may reproduce, modify, copy, distribute, sell, resell, transmit, transfer, license, assign or publish the Report itself or any information contained therein. Notwithstanding the foregoing, clients with access to working models are permitted to alter or modify the information contained therein, provided that it is solely for such client’s own use. This Report is not intended to be available or distributed for any purpose that would be deemed unlawful or otherwise prohibited by any local, state, national or international laws or regulations or would otherwise subject the Company to registration or regulation of any kind within such jurisdiction.
Copyrights, Trademarks, Intellectual Property.
SemiAnalysis LLC, and any logos or marks included in this Report are proprietary materials. The use of such terms and logos and marks without the express written consent of SemiAnalysis LLC is strictly prohibited. The copyright in the pages or in the screens of the Report, and in the information and material therein, is proprietary material owned by SemiAnalysis LLC unless otherwise indicated. The unauthorized use of any material on this Report may violate numerous statutes, regulations and laws, including, but not limited to, copyright, trademark, trade secret or patent laws.
ADMIS Disclaimer
The data, comments and/or opinions contained herein are provided solely for informational purposes by ADM Investor Services, Inc. (”ADMIS”) and in no way should be construed to be data, comments or opinions of the Archer Daniels Midland Company. This report includes information from sources believed to be reliable and accurate as of the date of this publication, but no independent verification has been made and we do not guarantee its accuracy or completeness. Opinions expressed are subject to change without notice. This report should not be construed as a request to engage in any transaction involving the purchase or sale of a futures contract and/or commodity option thereon. The risk of loss in trading futures contracts or commodity options can be substantial, and investors should carefully consider the inherent risks of such an investment in light of their financial condition. Any reproduction or retransmission of this report without the express written consent of ADMIS is strictly prohibited. Again, the data, comments and/or opinions contained herein are provided by ADMIS and NOT the Archer Daniels Midland Company. Copyright (c) ADM Investor Services, Inc.
Sources & References:
1. Semianalysis Datacenter Industry Model
4. https://insidelines.pjm.com/maintaining-grid-reliability-through-highest-peaks-in-a-decade/
7. https://www.ercot.com/files/docs/2025/04/29/Long-term-Load-Forecast-RPG.pdf
8. https://www.ercot.com/files/docs/2025/05/15/CapacityDemandandReservesReport_May2025.pdf
9. https://www.ercot.com/files/docs/2025/06/17/ERCOT-Monthly-Operational-Overview-May-2025.pdf
10. https://www.ercot.com/files/docs/2024/10/31/2024-biennial-ercot-report-on-the-ordc-20241031.pdf
14. https://elibrary.ferc.gov/eLibrary/docinfo?accession_number=20241230-5225
17. https://www.ercot.com/files/docs/2026/01/28/ERCOT-Post-Event-Report-Winter-Storm-Fern.pdf