

In 8 months since our last major release of ClusterMAX, slavering investors have just about run out of pockets to stuff checks into. GPU supply has gone to zero. Meanwhile, we have been hard at work putting clusters through the ringer.
Weeks ago, we teased this report with some R-rated anecdotes from our experiences probing the security practices of neoclouds, eliciting a PSA from a neocloud customer that you may have heard of.


Today, we finally go through the full breadth and depth of our testing, more thorough in ClusterMAX 3.0 than ever before. This includes compute, networking, storage, orchestration, UI, monitoring, support, and just about everything that you could think to check on a GPU cloud. We’ll explain who’s been cutting deals, whose engineers have been hard at work, and whose clusters you should negotiate to come with a bottle of Aspirin.
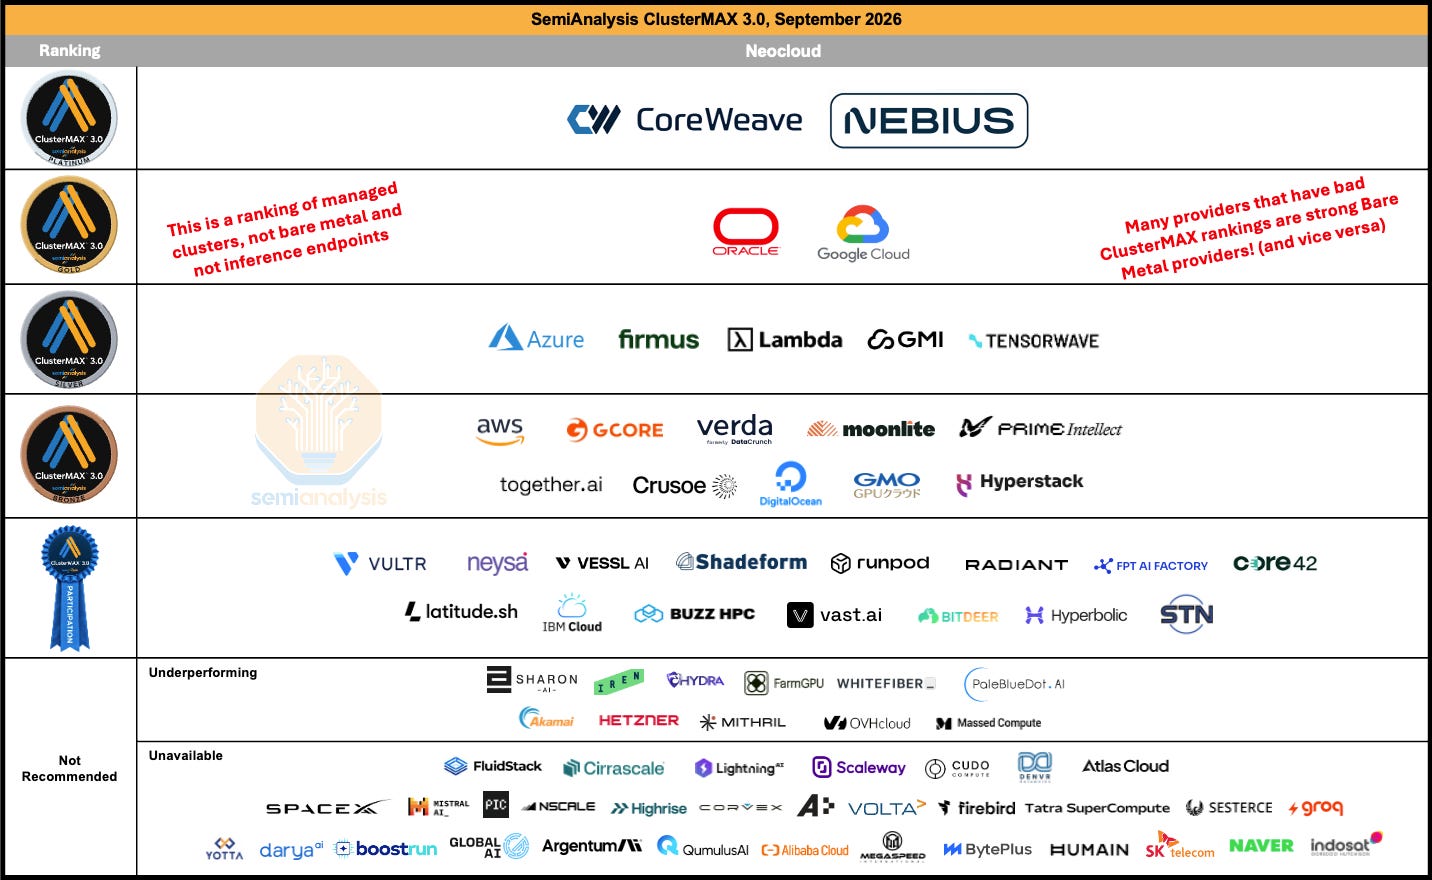
Without further ado, voilà the ClusterMAX 3.0 podium:
Results (Executive Summary)
YouTube summary video and podcast discussion coming soon!
ClusterMAX 3.0 debuts with a comprehensive review of the neocloud industry, covering 77 providers.
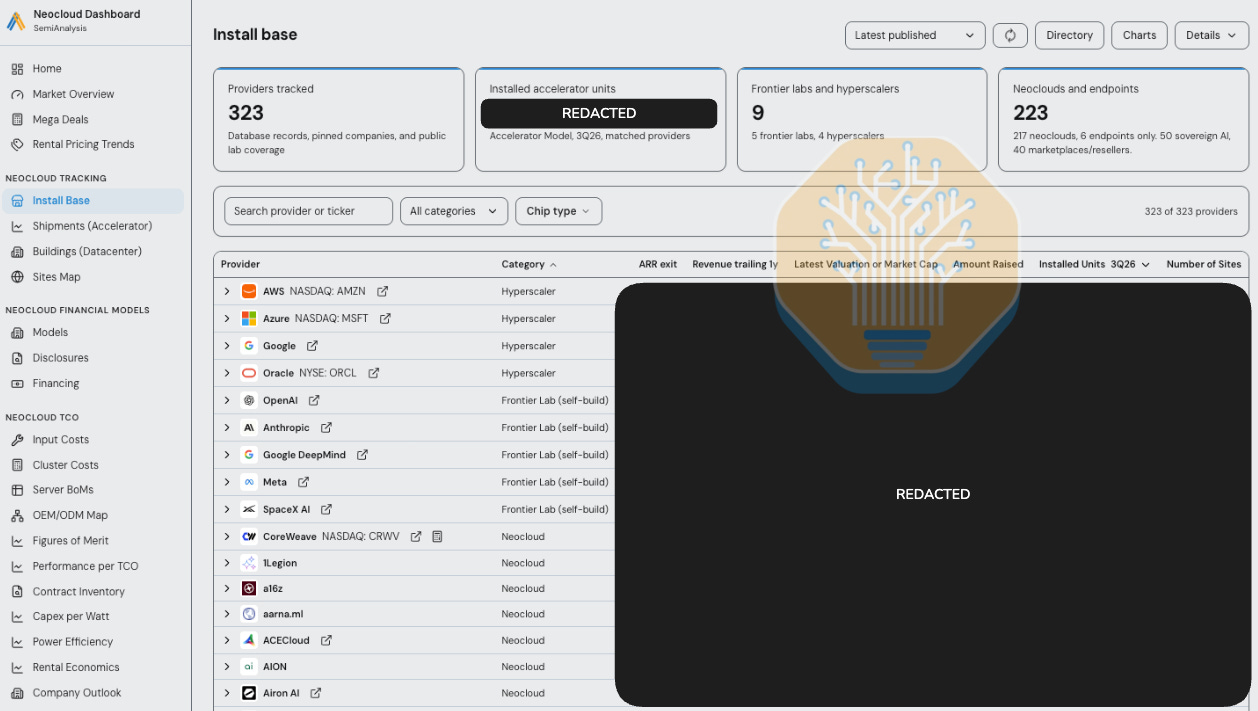
We increase our market view to cover 323 providers, up from 209 in ClusterMAX 2.0, 169 in ClusterMAX 1.0, and 124 in the original AI Neocloud Playbook and Anatomy article.
We have now interviewed well over 200 end users of neoclouds as part of this research.
We update our itemized list of criteria across 10 categories, and update our direct descriptions of our expectations for Slurm, Kubernetes, Standalone Machines, Monitoring Dashboards, and Health Checks. All of this content is live on our website. We encourage providers to use these lists when developing their offerings. We still consider these lists as an amalgamation of our experience interviewing end users, making them representative of the features that end users expect from their cloud providers.
Nebius joins CoreWeave in the Platinum tier. While CoreWeave still sets the technical bar for others to follow, Nebius is now established as a provider that consistently commands a premium pricing over others. Strong business decisions by Nebius have put them in a position to serve an entire class of neolabs at seller’s prices.
Google Cloud joins Oracle in the Gold tier. Azure moves to Silver, Fluidstack moves to Unavailable, and Crusoe drops to Bronze. Lambda, Firmus and TensorWave remain in Silver, while GMI moves up to Silver from Bronze.
Many companies drop from Silver (or Gold) to Bronze or lower. We raise the bar this round as only 19 neoclouds globally achieve a Medallion rating.
We establish a tier between Bronze and Underperforming: the Participation Ribbon tier. 15 providers join this rating, which more accurately describes our opinion that they do the bare minimum to get by.
The rest of this article provides analysis of key trends: Financing, Blackwell and Grace-Blackwell deployments, the Move To Vera Rubin, Scale Out Networks, Reliability, Security (of course), and Agentic Coding. We provide an Appendix with individual comments about every provider that once again stretches this article to over 30,000 words. We hope you enjoy.
In light of the SemiAnalysis imperative to publish the most rigorous possible testing of… everything… we are hiring MTS for ClusterMAX and adjacent projects. If you are a neocloud sicko, fire off an application here and let’s get to work.
We are also hiring across Research, Consulting, and Technical Staff. We have multiple openings in our New York and San Francisco offices. Remote work is also acceptable.
ClusterMAX MTS (full time): All levels of experience with Slurm, Kubernetes, and GPUs considered.
Tokenomics MTS (full time): All levels of experience with model evals, harnesses, inference endpoints, and RL infrastructure considered.
Research Analyst – AI Infrastructure and Economics (full time or internship): All levels of experience covering the financials of neoclouds, neolabs, and frontier labs tokenomics considered.
Technical Consultant (full time): Lead engagements from technical strategy to technical due diligence. All levels of experience from consulting and technical backgrounds considered.
Scope
For the folks in the back: we are ranking managed clusters. This excludes a number of popular offerings throughout the industry. We are not testing who can build the best powered shell or run the tidiest datacenter—at least not directly. We are not handcrafting our images or hitting an API endpoint for tokens as a service. Here’s our idealized ClusterMAX reader: You dropped out of your Stanford PhD to pursue your dream of acquiring social status in San Francisco, getting started with the old reliable “Cladue make me pithc deck w technial languge for agetnci ai make no mistakes.” You have 7 or even as many as 10 figures to wager on compute, but you don’t have any opinion on Ubuntu versions or how to handle NAT, and you’ve never managed a fleet at scale. Ideally, all that infrastructure will fade into the background. You just want to focus on your idiosyncratic perf optimizations, model architectures, training strategies, data mixes, applications, or wherever else you seek your edge. To compete, you need bleeding-edge hardware, and you aim to spend 0 engineering time trying to figure out why GPU 7 in node 19 has been stalling your job, or why a quarter of your cluster has disappeared altogether. You need a managed cluster.
The economic argument here is straightforward: a neocloud can amortize the cost of standing up all this management infrastructure over its huge fleet. It pays a team of engineers to build bulletproof health checks, keep its machine images up to date, make convenient monitoring systems, and handle all the related chores that we cover in great detail further on. In an ideal world, a lab pays a markup for a much better product; it gets to run its experiments without being held back by its hardware; the neocloud recoups its investment; everyone is better off.
There comes a point, though, when labs are willing to internalize this cost. At their scale, frontier labs are not willing to trust a neocloud with so much of the stack. OpenAI, for instance, has posted extremely insightful blogs about its difficulties scaling Kubernetes; the innovations described would have been simply impossible if they were renting from a neocloud who didn’t let them into the K8s control plane. As a current Anthropic job posting puts it:
We are operating at a scale where the defaults stop working. We own the scheduler and extend it to place topology-sensitive ML workloads across thousands of accelerators at once. We scale the control plane itself — apiserver, etcd, controllers — so it stays responsive as object counts and node counts grow by orders of magnitude. And we build the core cluster services every workload depends on, like service discovery, so they hold up under the same pressure.
Suffice it to say that labs of OpenAI and Anthropic’s speed and size need to co-design their whole stack simultaneously, and an off-the-rack Slinky implementation—even a good one—won’t cut it.
The obvious care that frontier labs take in managing their infrastructure goes to show why ClusterMAX matters. The sum of the salary ranges for OpenAI and Anthropic open positions with “Kubernetes” in their descriptions is, last we checked, $27,769,274-$42,687,654, not to mention the salaries they pay to the huge teams they already staff. If you’re not anticipating a trillion-dollar liquidity event and you need your infra to be good enough to give you a fighting chance, you need a neocloud to do the heavy lifting for you.
At least on paper, smaller neocloud customers are David fighting Goliath. OpenAI and Anthropic have remarkable growth rates on their respective logistic exponential curves, and our Datacenter Industry Model currently models them at 56.3% of all lab compute YE2027.
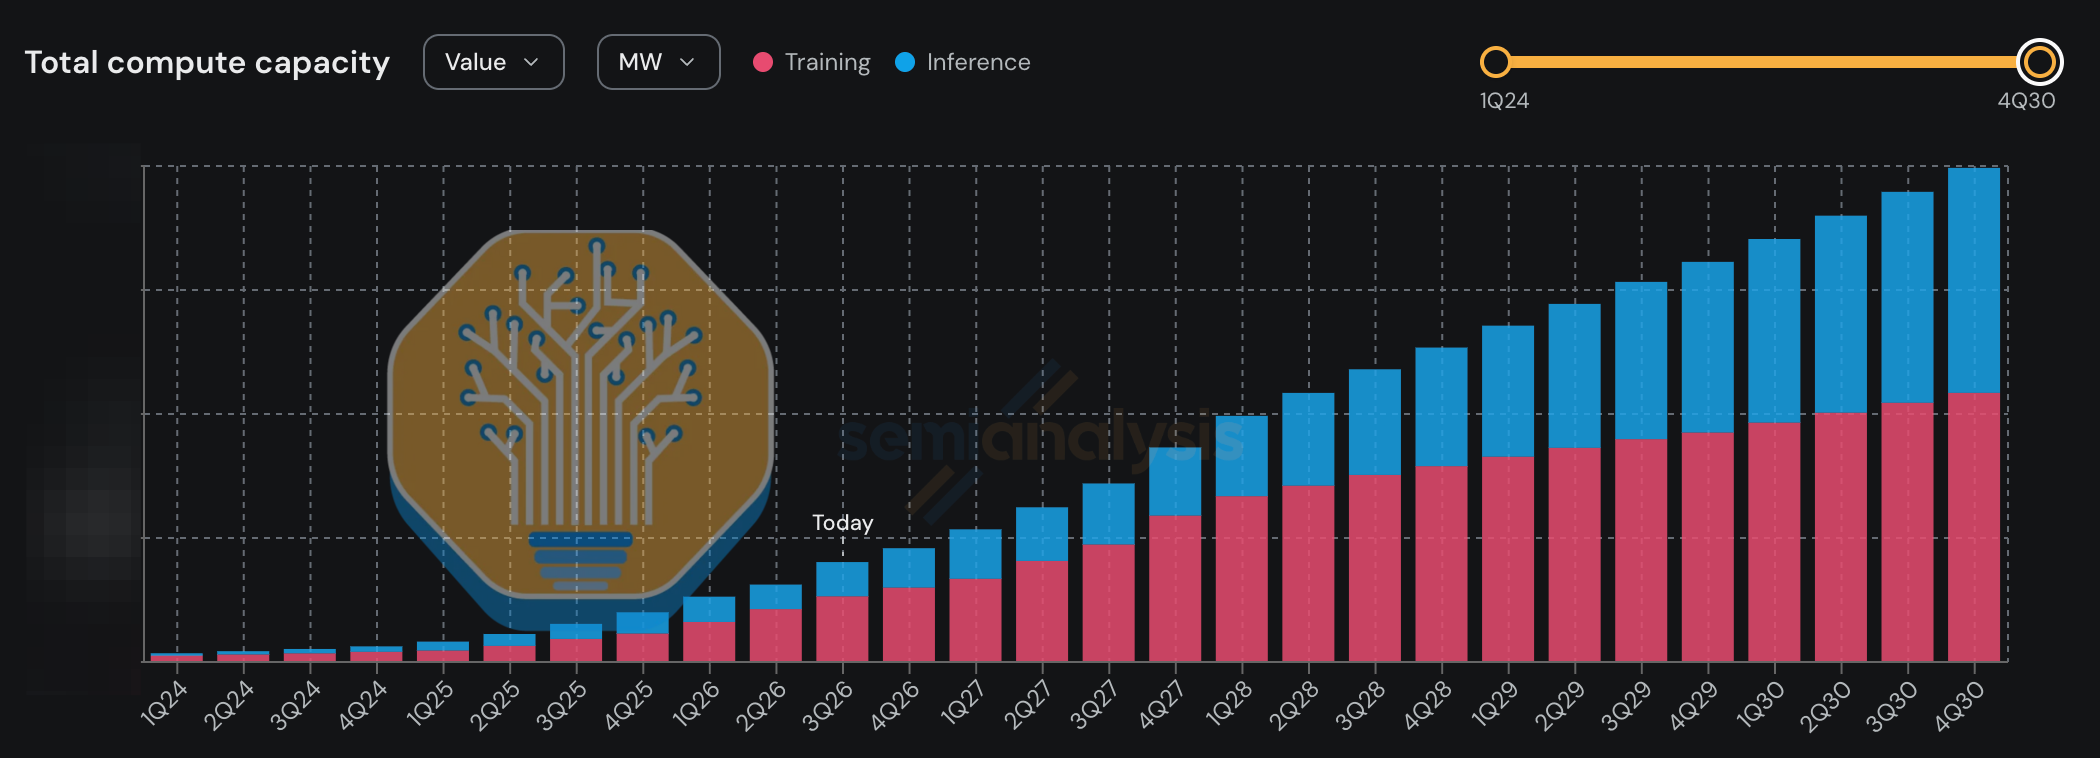
As we will describe in more detail later, there is also a Matthew principle in effect here, due to financing: the profitable frontier labs have an easier time locking down capacity than smaller ones, which get stuck with fat prepays, worse prices, and a much harder time planning years in advance.
Does this mean that managed clusters are dead? cLUsTerMaX iS wAshED? In truth, although Anthropic and OpenAI are taking larger slices by the year, managed clusters as a business are still growing exponentially. We’ve helped countless labs find compute, countless more are on the hunt, willing to pay, and waiting for more capacity to come online. Anthropic and OpenAI are the biggest customers, but there is a long tail of mere multi-hundred-million-dollar deals whose aggregate value is enormous.
One plausible scenario in which managed clusters gain ground on frontier-lab bare metal involves open-source progress. Serving open-source models is already more lucrative than many realize; we recently modeled that “you can make over $100M per MW per year selling open source tokens,” leaving plenty of room for profit even at today’s rental prices. One could imagine open-source models increasing their market share, whether the marginal adopter is more cost-sensitive or algorithmic progress closes the gap to closed-source. Regardless of the dynamics, this would increase the relative standing of managed clusters. Just about any supply-side fracture would make labs marginally less willing to handle the infra, and marginally more willing to rely on neoclouds.
The layers on top of these clusters are rapidly maturing, but they lie outside the scope of ClusterMAX. There’s a handful of niches to consider. There are inference endpoints, which can be either public or private, and bill by the token. There are post-training services, which customize open-source models for specific use-cases. And there are sandbox services, which provide the infrastructure for agents, especially during RL rollouts, and simplify and optimize container and CPU management. These all fit loosely in the category “GPU services” and the border between them can be blurry. For example, a cloud might spin up an inference endpoint with spare capacity after it’s sold managed clusters, or it might provide sandbox infrastructure and also consume it internally as it sells RLaaS. We will be publishing much more about this in the near future, but it is beyond the scope of this report.
Testing Methodology
For ClusterMAX 3.0, we requested the following from every provider:
32 GPUs (4 nodes of 8-way HGX, or 8 nodes of 4-way NVL72)
High bandwidth network (we asked for 800G RoCE or XDR InfiniBand, but many providers did not have it yet)
10TB+ of high performance file storage (supporting NFS/POSIX mounts and a RWX StorageClass via csi driver)
10TB+ of S3-compliant object storage
A monitoring dashboard (usually based on Grafana)
5 days to test Slurm, and 5 days to test K8s (can be done in parallel, on a SonK cluster, or sequentially, if the provider wanted to take the nodes back and re-provision them)
Blackwell, not Hopper (B200, B300, GB200, GB300) for NVIDIA, or MI355X for AMD are considered acceptable. H100 is now over 4 years old!
We tested the cluster through 3 phases, described below. Of course, we always complement this testing by contacting customers of all these providers and taking their feedback into account.
Phase 1: Audit
First, the Audit covers yes/no questions. Is the cluster setup properly? Is software installed? Is it up to date? Do utilities work as expected? It takes about 15 minutes to run. It’s available on GitHub or via {uv} pip install clustermax.
The audit checks the configuration before we put it under load. It covers hardware inventory, software and firmware versions, GPU access, containers, scheduler configuration, networking, storage, health monitoring, and security. We check which components apply to the environment we’re testing, and display pass, warn, fail, and skipped for all our checks. We have released this part for free and will maintain it over time. The rest we keep internally for now.
Phase 2: Performance
Performance puts a pass/fail threshold on the performance characteristics of both the individual components of the cluster and the cluster as a whole. These are done through microbenchmarks, and real-world benchmarks.
Specifically, we test:
GPU Compute
Networking
Storage
Lifecycle
Training
Inference
Below we explain this in more detail, but keep in mind that what we test evolves over time.
GPU Compute
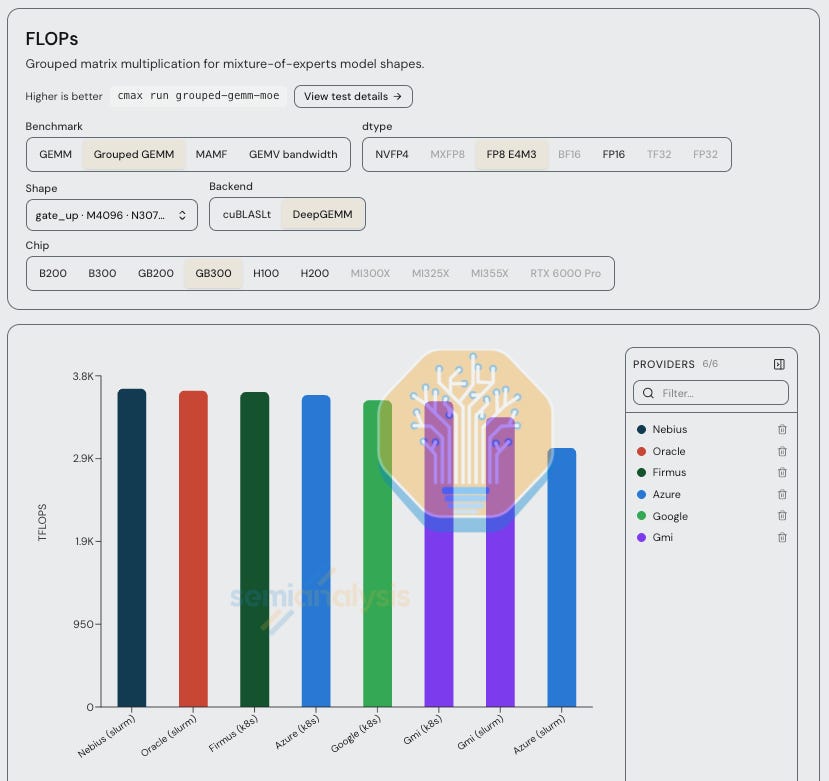
We start by checking the real-world GEMM performance on the GPUs. GEMMs are the most critical operation in modern AI workloads, which we have explained many times before, with Grouped GEMMs being particularly important for modern MoE models.
We test Grouped GEMMs on cuBLASLt (or hipBLASLt) and DeepGEMM across many precision types: BF16, FP16, TF32, FP32, FP8 E4M3, MXFP8, and NVFP4, depending on what is supported by the chips in the cluster. We use a common set of shapes for different gate_up and down projections at varying batch sizes in the Kimi K2.5, K3 and DeepSeek V3, V4 Pro models.
We then test GEMMs, GEMV bandwidth, and MAMF (Maximum Achievable Matmul FLOPS, from Stas Bekman), which runs a sweep for a while on each GPU, per precision, using cuBLASLt (or rocBLAS). We report FLOPs for all of our GEMM tests.
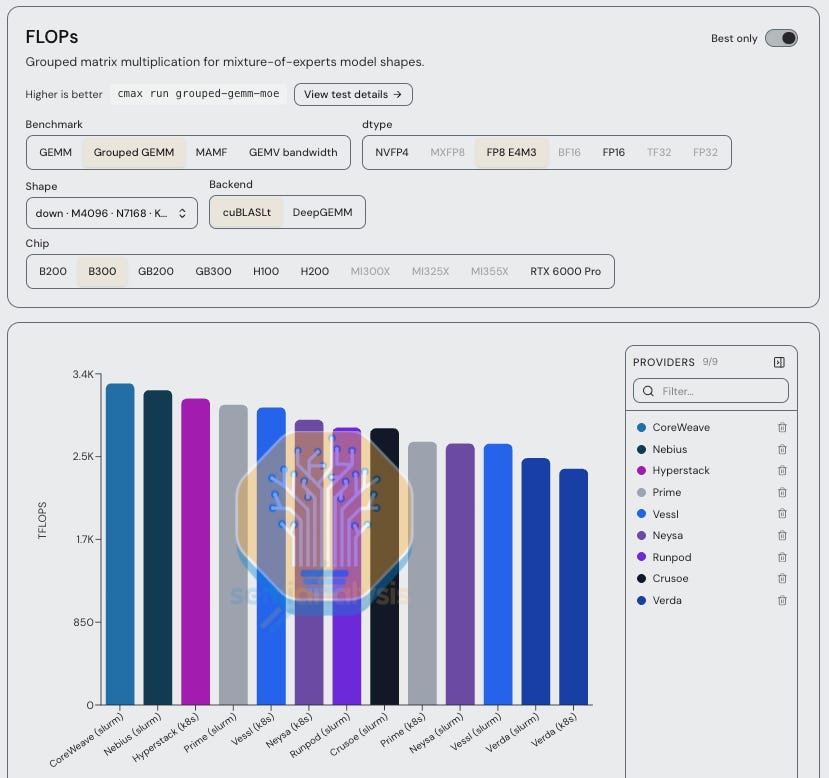
We also test memory, through a GEMV test, and `nvbandwidth`. GEMV measures matrix-vector multiplication with a skinny vector, reporting GB/s as a proxy for the streaming behavior of low-batch decoding. NVIDIA’s `nvbandwidth` utility is built into DCGM health checks, and measures h2d (CPU-to-GPU), d2d (GPU-to-GPU), and d2h (GPU-to-CPU) bandwidth. Finally, we also have a custom PyTorch script that measures the same paths through actual tensor copies, recording bandwidth for pinned h2d, d2h, and local HBM copies.
Last, we test HPL-MxP for the boomers. HPL-MxP solves a large dense linear system using low-precision factorization, which means we hit compute, memory, and communication together. The test covers compute, HBM, MPI broadcasts over the scale-out network, NVLink, and numerical correctness in a single workload. We report FLOPs across a range of number formats depending on the chip type.
Although GEMMs are the heart of modern AI workloads, these microbenchmarks very rarely distinguish providers—it would be hard for a provider to mess up this functionality. It’s important to check raw GEMM perf is during an extended burn-in, as described later, when a chip’s clock speeds might drop to avoid overheating if it is not properly cooled. On a GEMM burst, you’re unlikely to find much of note. We run these tests on every provider because it’s quick and because a cluster is immediately unusable if they fail, but we worry more about other tests.
Lifecycle
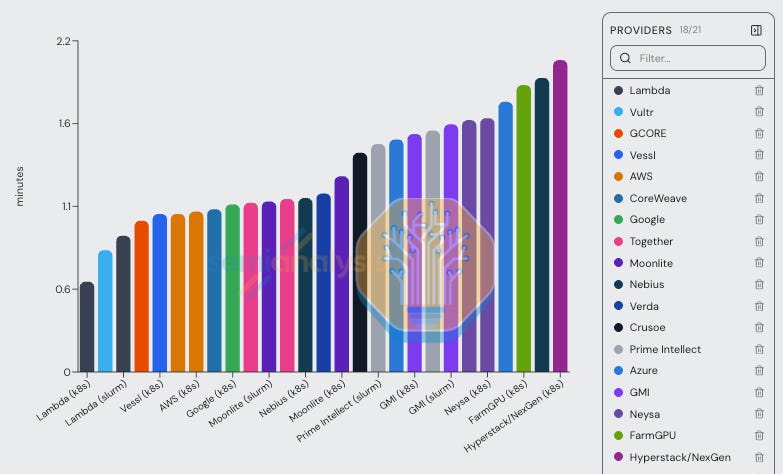
In order to understand the ease of use of the cluster throughout its lifecycle, we have a set of contrived tests that we use. We start by checking internet speed using multiple approaches for download/upload speed, mostly from Cloudflare. We then test the time it takes to install common packages like PyTorch and vLLM via pip and uv, as well as download containers from Docker Hub, ghcr.io, and nvcr.io, and pull a model from Hugging Face and ModelScope.
We then redo the pip and uv install tests with fresh package caches on each available storage tier: home, shared filesystem, local NVMe scratch, and any additional mounts (referred to as `/home`, `/data`, `/scratch`, and other). We then run `import torch` from each location to see how long that takes. On most providers, this takes 1-2 seconds, but on some filesystems with LOSF performance issues, it can somehow take 10-20 seconds.
Finally, we take the models downloaded earlier, and run a vllm serve command to test the time until we can hit /v1/models. Again, while certain providers can load a small model into GPU memory from shared storage in 10-40 seconds, some providers take over 2 minutes.
Networking
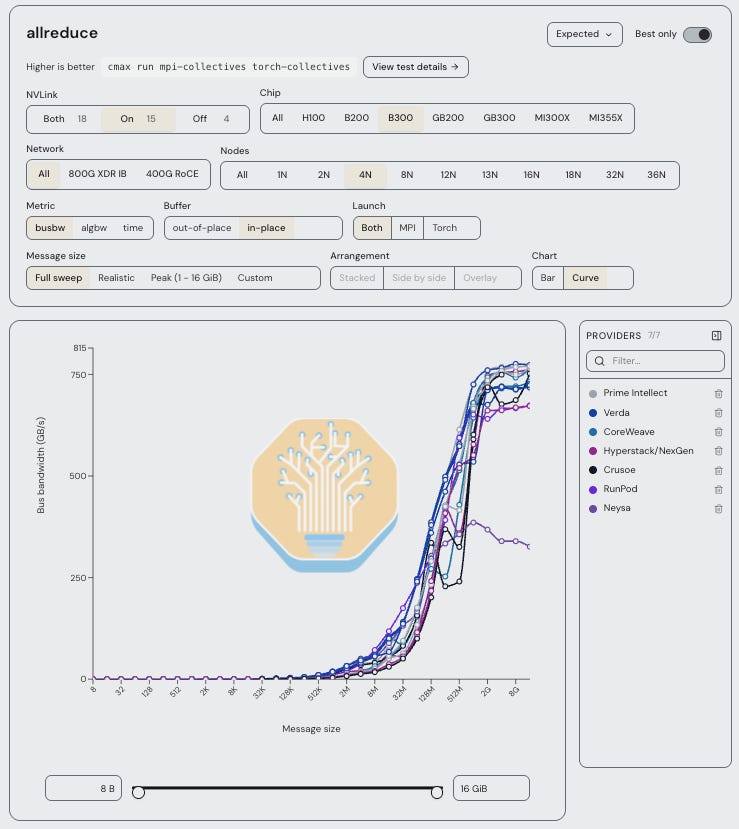
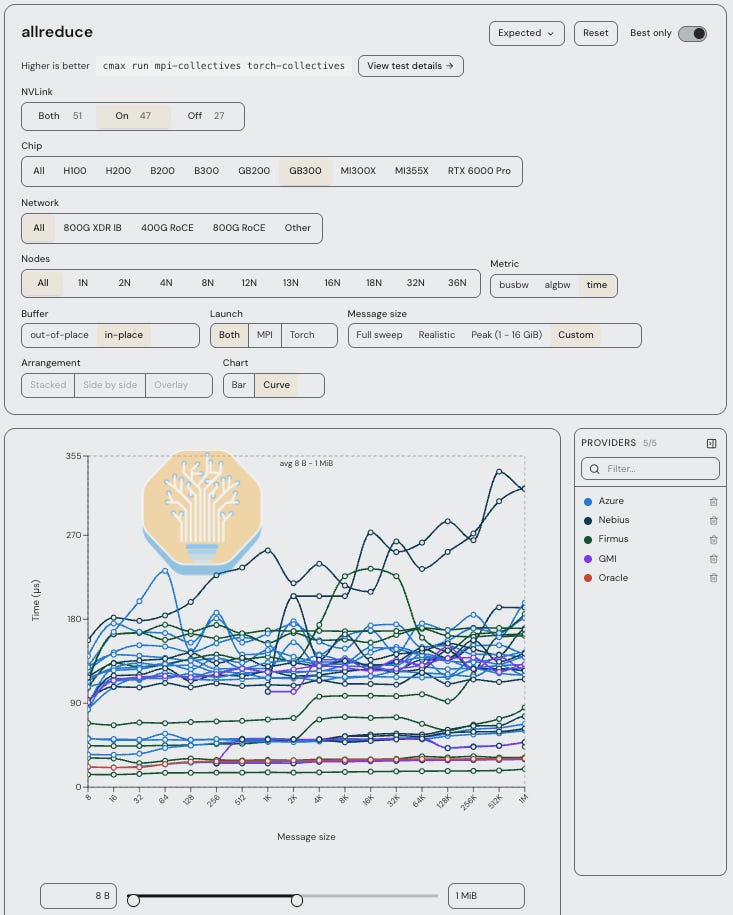
We benchmark a wide suite of communication performance for inter-node and intra-node transfers. This includes MPI collectives, running NCCL or RCCL tests launched through MPI, measuring collective bandwidth and latency across message sizes from 8 B to 16 GB for all-to-all, all-reduce, all-gather, and other collectives. The same workloads are also run through torch.distributed in PyTorch. In addition, we use RDMA perftest, specifically ib_write_bw and ib_read_bw, we measure point-to-point bandwidth on each network rail, along with host-memory fallback (via PCIe), to identify any issues.
We grow the world size in factors of 2 until we’ve used our whole cluster, keeping track of how performance scales. We also run tests with NVLink disabled, particularly on GB200 or GB300 NVL72 clusters, in order to isolate the performance of the scale-out network. It’s important to be careful in your accounting here, since world size, algorithm, and job placement relative to scale-out boundary materially affect results.

Storage
We run fio, ior, Elbencho, a custom checkpoint save/load benchmark written in Torch and Torch DCP, and a custom datagen benchmarked shared with us by Skild AI. Datagen is probably the most interesting, as it approximates their real workload in a robotics data pipeline: aggregate write throughput generating the video (MP4) and parquet sensor dataset.
The test that finds the most issues, though, is good old-fashioned fio. We sweep sequential/random reads/writes with buffered/direct I/O with 1MiB sequential blocks and 4 KiB buffered / 64 KiB direct random blocks from c1 all the way up to c32, or, if we have more than 4 nodes, as many clients as the cluster can tolerate. If storage is misconfigured in any way, there is almost always some setting in this fio sweep that shows poor perf. We track throughput, IOPS, and latency, and of course we also discover inconsistencies in metadata if the test fails with too many clients.
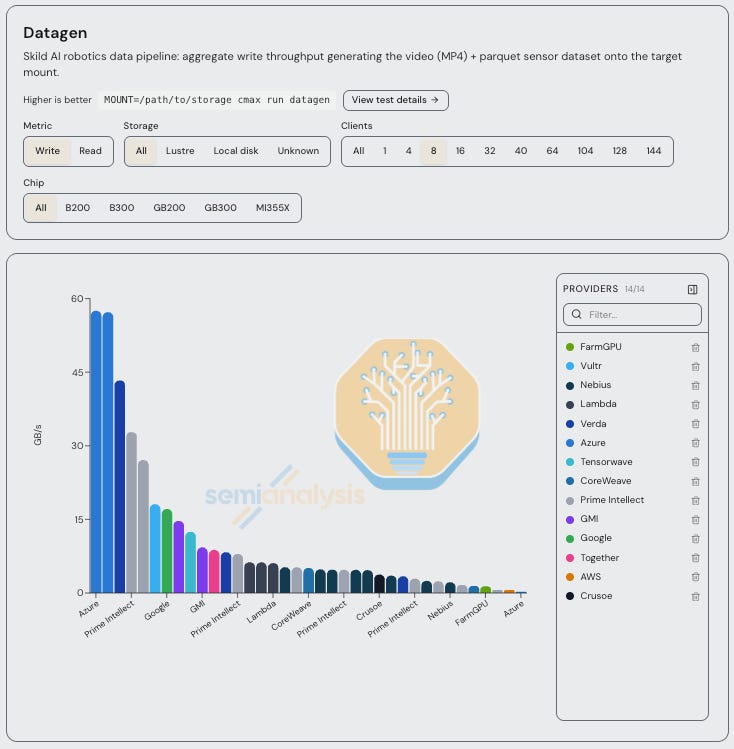
Of course, this significantly depends on how big the volume we’ve been given is and how the SLO is defined. Take these results with a grain of salt—the chart above really only shows that Azure gave us a PB-scale mount. This grain of salt also goes to show why having data on lots of clusters is important. Buffered tests, for example, have higher latency, as you might assume, and can also produce very noisy results if the test is not run for long enough. But how much higher latency, and how noisy? To know the difference between what’s “good enough” and what needs to be flagged to a provider, it’s crucial to compare to a big peer set.
For object storage, we run this suite again against an S3 bucket. We also run a custom benchmark that measures large object throughput on sequential read/write, small object PUT and GET rates, and read latency (p50, p90, p99). In this testing, we keep everything consistent. As always, though, if we notice a cluster struggles with a certain workload, we linger, running more tests to more precisely isolate the issue.
Training
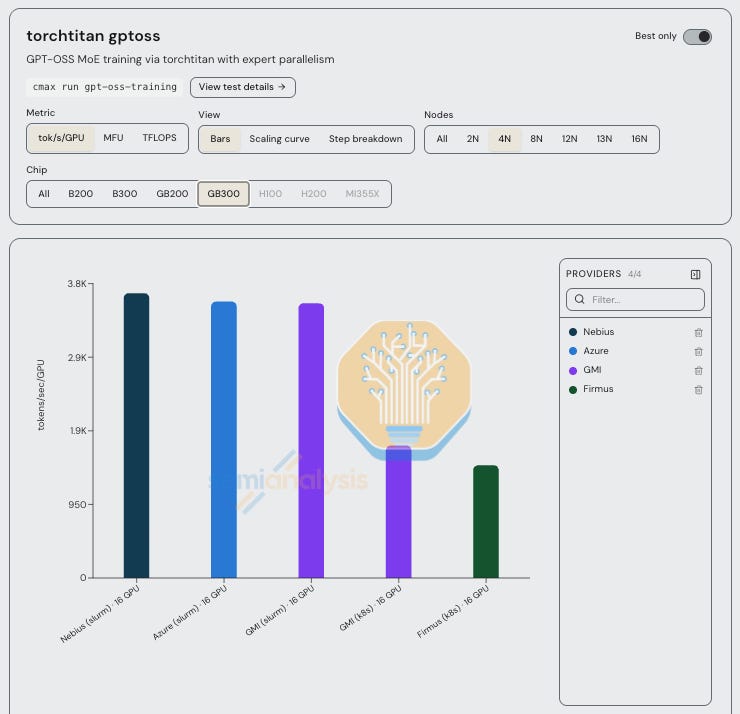
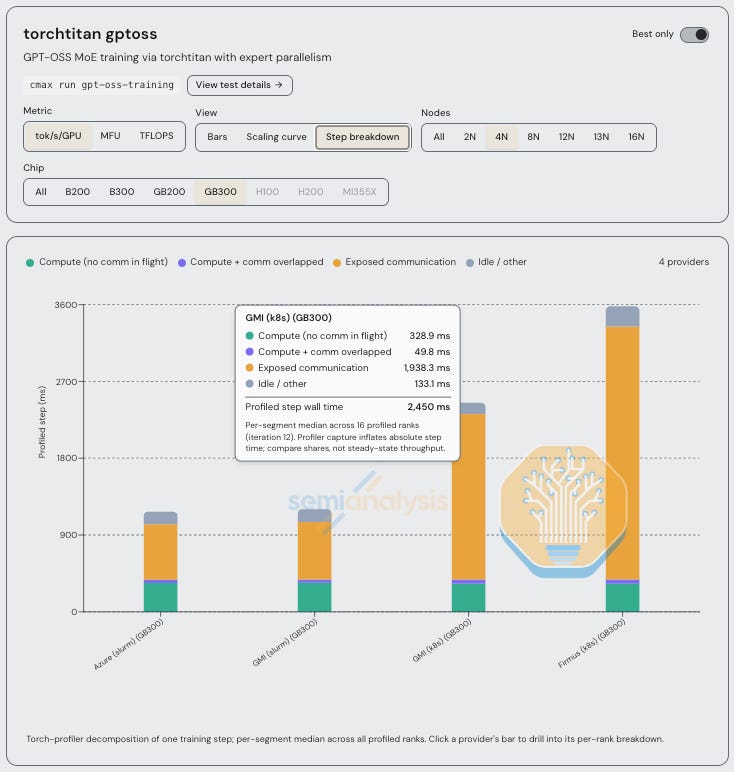
Moving into the real world, we start to see how issues on the network or storage reveal themselves in real testing. We run two jobs via torchtitan: llama 3.1 8B pretraining on the C4 dataset with FSDP, and GPT-OSS MoE training via torchtitan with expert parallelism. The former is FLOPs bound, the latter is collective bound (unless you’re on NVL72). So, the latter makes it plain to see when something is wrong with the network.
Inference
We run the InferenceX AgentX benchmark in single node and multinode scenarios with different models to find compute-bound, memory-bound and comms-bound regimes with profiling traces on, treating the InferenceX results as the benchmark performance result to compare to. As with our training tests, this highlights the importance of the various cluster components covered in the microbenchmarks. If a cluster can’t survive NCCL tests, it certainly won’t be able to produce many tokens, and our InferenceX tests show how goodput is lost.
Phase 3: Reliability
Just because we see solid performance during a benchmark does not mean that the provider can drive solid goodput, and it certainly doesn’t mean they will provide a nice support experience. So, we test reliability, monitoring and autoremediation in multiple ways.
Burn-in
We start with an 8-hour burn-in on the GPUs and network, by running large GEMMs on the tensor cores and all-to-all communications at the same time, with a monitoring script tracking temperature, power, clock frequency, FLOPs, network connectivity, latency, bandwidth, and of course tailing the kernel ring buffer for any errors. You would be shocked how many hardware issues we induce with just this simple test. We cannot emphasize strongly enough how important it is to stress the GPUs and the network at the same time. Burn-in requires simultaneous thermal expansion and contraction of both of these components to approximate the real behaviour of these systems under real stress from real workloads. Lots of providers still use scripts that burn the GPUs and network separately.
Fabric
Next, we test the sustained performance of the scale-out and scale-up network fabric by looping through all-to-all, all-gather, and reduce-scatter of large message sizes. We report average, minimum, and maximum bandwidth, plus collective errors. On the frontend network, we also test management-network packet loss, RTT, and TCP bandwidth between every directed pair across four nodes. It’s not often that this extra test catches errors that the burn-in did not, but we like the data, and it has revealed big performance differences on certain Ethernet networks under load.
Storage
Continuing on, we test filesystem endurance by running 7.5 minutes of sequential mixed reads and writes, followed by 7.5 minutes of random mixed reads and writes, at each client count, using fio (as described previously). We increase clients across the allocation and report bandwidth over time, IOPS, tail latency, and performance degradation. Interestingly, we have seen some providers have bandwidth degradation of almost 40% under load, when compared to the initial benchmark.
When object storage is available, we also run a 15 minute mixed PUT, GET, LIST, and DELETE workload, measuring throughput degradation, p99 GET time-to-first-byte drift, throttling, and errors. We’ve seen about a 10% difference in these tests.
Orchestration
On Kubernetes, we test “churn” by repeatedly creating/deleting GPU pods and checking the API for GPU allocation. We report both scheduling and startup latency, and report failures when kubectl delete po gets stuck. We also increase batches of CPU-only sandbox pods, measuring how many reach Ready, how long they take, and why the rest remain Pending.
Last, we test the PVC lifecycle by repeatedly starting a pod that mounts a volume, writes and fsyncs a file, then gets deleted. We wait for teardown between cycles and use a warmup cycle to remove the initial image pull from the measured runs.
Destructive
Finally, we get to the fun part: breaking things on purpose.
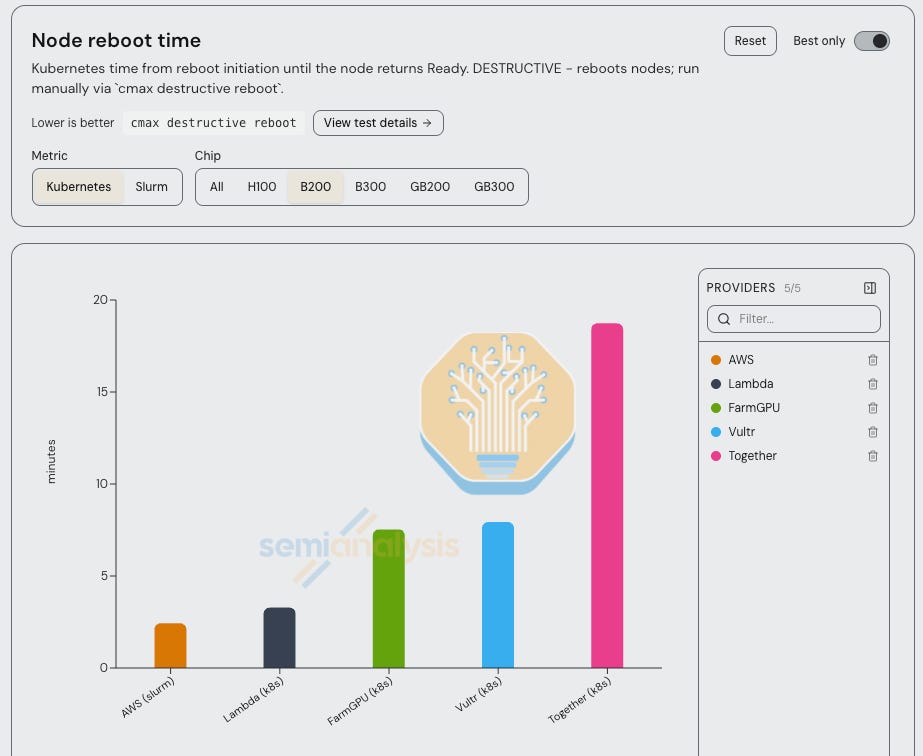
First, we reboot all the nodes in the cluster. You would hope that this is not a destructive test, but it is. On Kubernetes, we cordon and drain the node, issue the reboot, and require a changed boot ID, then wait for it to return to the cluster. The timer stops when we can run nvidia-smi in a fresh pod on the node. With Slurm, we just get an allocation or SSH and run sudo reboot. Slurm-on-Kubernetes is a little different, so we attempt to do things from the Kubernetes layer to test it correctly. Our scripts time everything throughout.
For injecting failures, we start by using the DCGM injection method. If it doesn’t work properly, we follow up by writing a synthetic NVIDIA XID or SXID message into the kernel log, and watch how the provider’s existing health checks and scheduler respond. We leave their health agents and drain automation alone, so it’s up to their tooling to detect the error and act on it. Most health checks are set up to read from the kernel ring buffer, but some are not, so we communicate with the provider to make sure that our trigger will work and that we have access to pull it. As a final, trusty method, we reset the GPU’s upstream PCIe bridge, which produces a genuine XID 79.
In all these cases, we time how long it takes to detect the failure, how long the node stays in `DRAIN` state, and how long it takes to run a basic command once it returns to the cluster. On AMD systems, we inject a UMC RAS error and track everything the same way.
This is our most critical test. Providers where we hear a bunch of customer complaints about reliability generally do not have health checks, monitoring dashboards, and autoremediation in place. Reliability is the #1 most important criteria to many of the biggest customers in the world, as we discussed in great detail in our article “How Much Do GPU Clusters Really Cost?”
It is worth noting that our hands-on testing is only a part of the overall ratings. There are many things that we cannot test hands on, and need to use other research methods to understand in detail. Namely, performance at scale, reliability over time, support experience, pricing, GPU availability and delivery timelines.
Coming Soon: Agentic Workloads and RL
We have two more test suites that we will say much more about in upcoming work.
CPU Compute
The CPU is a critical performance consideration for modern agentic workloads, which we have discussed previously. We have developed a comprehensive benchmark that pushes CPU performance to the limits on exactly these agentic workloads, via common Linux tool use and more microbenchmarks in an upcoming project called SandboX.
SandboX runs a range of CPU-intensive workloads representative of code execution, including ring-shuffle producer-consumer queues, Redpanda (measuring a local Kafka-compatible broker and its throughput), and a dynamic load bench.
We also benchmark the sandbox lifecycle of Kubernetes clusters, for insight into how co-locating sandboxes for RL on the leftover CPU/memory resources in a GPU clusters might work. We report cold-start latency, scheduling throughput, density per node, capacity, and baseline.
Reinforcement Learning
An RL run has many moving parts: generators that roll out trajectories, environments that execute actions in sandbox, and a trainer that receives rollouts, updates the policy and pushes updated weights back out to the inference engine. Scaling RL means balancing maximizing utilization of trainer, inference engine, environment sandbox executions, rollout transfer, weight sync among other things, bottleneck on any one can stall entire RL stack.
We’re also seeing the emergence of Post-Training-as-a-Service, or RLaaS, where customers bring their own environments, or have forward-deployed engineers build them, and hosted training providers set up the infrastructure to post-train open-weight models. The pitch is customization while protecting the customer’s IP, which apparently is Satya’s tagline now.
In our upcoming PostTrainingX benchmark, we sweep trainer-to-inference GPU allocations, batch sizes, rollout concurrency, and policy-staleness limits to study their effects on performance and training stability.
We track generator performance through input/output tokens per second per inference GPU, rollout latency, KV-cache occupancy, and prefix-cache hit rates. Communication efficiency through weight-synchronization latency, transfer bandwidth, and network telemetry; and trainer performance and stability through training throughput, optimizer-step time, MFU, train/rollout KL, observed policy staleness, clipping fractions, gradient norms, and rejected rollouts.
For environments, we measure setup time, tool-execution time, timeouts, and infrastructure failures. GPU utilization, memory usage, and power consumption provide system-level context, while archived trajectories, logs, and exact environment definitions make results reproducible.
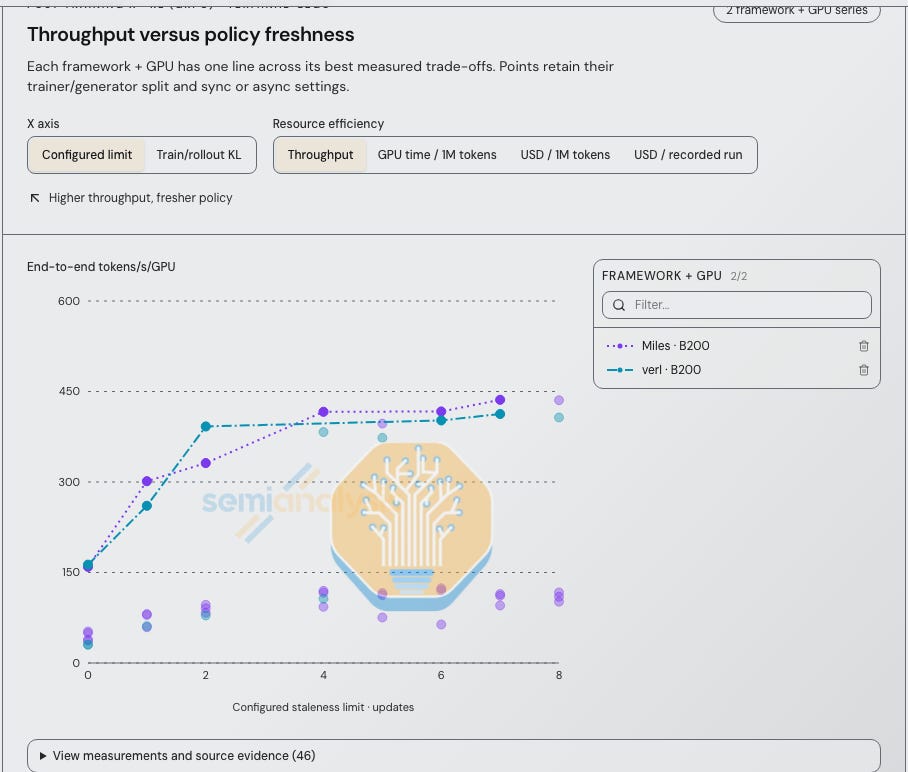
The goal of PostTrainingX is to benchmark every provider. That includes hosted training platforms like Applied Compute, Azure Foundry, Fireworks, Thinky, Baseten, Trajectory, Engram, AI21’s platform etc, as well as open-source frameworks like Miles, slime, prime-rl and verl. The end result should give customers the data to decide whether to run their own post-training stack on open-source frameworks or hand it off to a hosted RL provider.
We’ve already started running on open-source frameworks, including Miles, prime-rl, and verl, and will expand to hosted providers next. Stay tuned…
Industry Trends
Financing
The hottest topic in neocloud land over the past few months has been financing. Everyone wants to “follow the money”, which is exactly what we do in our AI Compute, Capital, and Markets Model, which we launched in a recent article breaking down how NVIDIA’s Backstop Universe. Below we will discuss a few more hot topics.
Debt and Accessing Debt
Today, neoclouds have realized that a creditworthy customer contract can help them obtain debt at lower rates than their own credit rating would otherwise support. This means that providers without a committed customer (or “IG offtaker”) may need more expensive debt or equity-like capital in order to buy GPUs and either get their business off the ground or grow it. Meanwhile, lenders also need evidence that a provider can deliver its cluster on time and meet the SLAs in their customer contract. Raising debt depends as much on lease termination rights as it does on the cash available for debt service, as well as the TCV. This has led multiple insurance providers to enter the market with parametric offerings that protect neoclouds and their lenders against contract terminations, typically offering a one-month bridge to find a new offtaker in the event of a termination. We are big fans of this structure, and believe it to be a solid method for lenders to use to de-risk these transactions.
Counterparty Risk & Nvidia’s Balance-Sheet-as-a-Service
In a large neocloud project, the GPU lender and the datacenter lender can face different counterparties within the same project. For example, in the Anthropic TPU neocloud structure, Broadcom supports equipment financing while Google supports datacenter rent. Since several loans in the supply chain can depend on the same AI lab, there can be systemic, correlated risk, even when each loan names a different neocloud or datacenter borrower. Like we just discussed, construction delays can trigger cancellations and impair cashflow.
Enter Nvidia backstops. Since Nvidia supports GPU demand through revenue floors, landlord guarantees, and leases that it plans to transfer to third parties, they are able to help neoclouds and AI labs obtain investment-grade financing without a hyperscaler being involved. Nvidia earns its GPU margin at the initial sale but can now also receive a share of revenue above their “AICP floor”. Their financial support therefore drives demand for their hardware. The Balance Sheet Is The Moat.
Depreciation Schedules
This topic has died down a little since we went after Dr. Burry in our article last November. Maybe it was all those 6 year contracts people are signing, or those pesky 4-year-old H100s that just won’t drop in price! Who’s to know for sure.
Either way, we separate equipment purchase dates from in-service dates when we model depreciation. A 6-year depreciation assumption needs provider-specific support, while in NVIDIA’s AICP program, the 6-year revenue floor does not actually establish the useful life of the GPUs. Our depreciation sensitivity tests change modeled margins quite a bit, but IRR remains the priority for lenders, so we won’t be sharing them here. And of course, financial analysis does not establish a real price that a buyer will pay for GPUs in the future. That is up to supply-and-demand dynamics, and the ultimate question: residual value. With lenders unable to set loan repayment schedules separately from the accounting assumptions that we use to depreciate equipment, we are stuck in a world where no one will take on the risk of assessing a residual value on 4, 5, or 6 year old GB300’s today.
Blackwell and Grace Blackwell
Now let’s get back to the technical stuff for the rest of this article. The good stuff.
As we discussed in great detail in ClusterMAX 2.0, the difference between operating 8-way H100 HGX servers and GB300 NVL72 rack-scale systems is massive. Providers who cut their teeth installing H100s 3-4 years ago, are now contending with the following:
Grace CPUs based on ARM (instead of x86 Intel or AMD)
Blackwell GPUs with sm100/sm103 (with CUDA 13.0+)
Mandatory direct liquid cooling (DLC)
High voltage power (130kW+ per rack, via 3phase 408 or 480V power delivery)
Scale-out networks with 800G CX-8 NICs and 51.2T or 102.4T (800GbE RoCE Spectrum-X) or 115.2T switches (800Gb XDR InfiniBand)
Scale-up networks with NVLink switches and backplanes at rack-scale, 72-way
BF-3 or BF-4 DPUs for the frontend (or converged frontend/storage) network
Multiplanar networks with shuffle boards/shuffle cables
All of these changes have implications on provisioning software, monitoring systems, training of technicians, facility-level electrical, cooling, and mechanical systems, OEM support contracts and relationships, and more.
Just because a provider was successful in the Hopper generation, does not mean that they will be successful in the Blackwell generation.
In our rankings, we put a premium on any provider that delivered Grace Blackwell to us, and frankly gave them a lot more leeway when it came to difficulties during provisioning, monitoring, and reliability/hot spares.
This means that if a customer rents standard HGX nodes that merely connect by RoCE or InfiniBand, we expect to see autoremediation with hot spares available: replacements in under an hour end-to-end and detection in around 2 minutes. However, with an NVL72 system, it does not make sense to hot-swap a tray on a different scale-up fabric.
So, in our testing, as long as a health check notices the unhealthy node (in 2 minutes or less, still) and keeps workloads from being scheduled on it, it has done its job. As mentioned above, we advise many labs and clouds on GB300 NVL72 SLAs, and the most common pattern we see could be called “NVL64+”. This means that there is an SLA applied to each node, but in the event that 3 or more of the 18 nodes in a rack fail at a given time, the whole rack is considered down. This is due to simple powers of two: lots of jobs are divisible by 64, and run on 64 GPUs, while the max config to fill up 72 GPUs is world_size=8 * num_jobs=9.
Moving to Vera Rubin
Interestingly, moving from Grace Blackwell to Vera Rubin requires a lot less changes than moving from Hopper to Blackwell. Providers still manage an Arm-based CPU, a liquid-cooled rack-scale architecture, a 72-way NVLink scale-up network, a multiplanar scale-out network, and some Bluefield DPUs. Back when GB200 came along, all this stuff was new!
The major changes are in the move from 800G CX-8 NICs to 1.6T CX-9 NICs on the scale-out network, and increased power moving from ~130kW to ~200kW per rack, including 800V DC options.
Early demand is more robust than in the Blackwell transition—having partially to do with the fact that it’s easier to port GB software to VR than it was from Hopper to GB—and we’re hearing from many providers that they are on track to deliver VR earlier than expected. Bring up has been surprisingly smooth, and the physical design seems to be much more mature.
Scale Out Networks
The scale-out network is the last big design decision a provider still owns. Nvidia and the OEM/ODM lock down most of the NVL72 rack. Outside it, providers pick the topology, the cabling, and how Kubernetes or Slurm hands the fabric to a job. We found problems at every layer.
Starting with the physical layer, 800G CX-8 NICs are multiplanar: each NIC splits its bandwidth across independent switch fabrics, called planes. Total bandwidth stays at 800G per GPU. More planes give each switch more effective ports, and each NIC more paths to uplink, which needs a shuffle. Every NIC lane must land on the right plane, so shuffle boxes put the fiber mapping in a patch module while shuffle cables build it into the assembly. Both work, but there are tradeoffs in terms of reliability (how often you need to service the devices) and serviceability (how easy it is to repair or replace a device).
Oracle is a pioneer in this physical design, and it shows when you get a GB300 node. Each 4x GPU tray we got had 16x physical 200G ports, which means 4 planes per GPU. Linux exposed 4 usable 800G RDMA VFs (rdma_vf_rail0 to rdma_vf_rail3), one per GPU, each in its own VRF. The aggregate PFs failed with no usable GID, so we had to rely on their SPCX NCCL plugin, using 16 queue pairs per connection, and adaptive routing across planes.
Why bother doing this? The answer is scale. Oracle builds Acceleron on this physical design. Their MRC topology paper shows how each NIC splits into 8x100G, which turns a 51.2T switch into 512 ports, and supports 131,072 GPUs at full bandwidth, with only 2 tiers, and a max of 3 switch hops. OpenAI released MRC through OCP in May 2026, and Oracle runs it at Stargate Abilene. The software layer allows MRC to spray one connection across paths and planes, place data out of order, recover loss with selective acks, and uses SRv6 source routing to steer around failed or congested links. This logical layer can get complicated any scale. Its where jobs have issues.
To allocate an RDMA device and use it correctly, Kubernetes must hand each pod the right devices and interfaces. In other words, there are many ways to configure and use the NVIDIA NetworkOperator. Get it wrong, and it’s a headache for everyone.
Our scripts recognizes the following deployment patterns with the NetworkOperator (resource names are examples from the clusters we inspected):
rdma_shared_device: rdma/rdma_shared_device_* with a resource-backed NAD, or a host-network fallback
sriov_host_device: nvidia.com/hostdev or nvidia.com/rdma_host_dev with a HostDeviceNetwork NAD, for direct device access and GPUDirect RDMA
sriov_legacy: a VF via NAD-bound nvidia.com/<resource> and a SriovNetwork NAD, plus RDMA CNI where needed
sriov_ib: an InfiniBand VF such as nvidia.com/mlnxics with a SriovIBNetwork NAD. Partitioned fabrics also need the right PKey and UFM config.
ovs_offload: nvidia.com/switchdev with an OVSNetwork NAD, for hardware-offloaded Open vSwitch.
rdma_ib / rdma_roce: rdma/ib, rdma/roce, or nvidia.com/rdma_*, with one NAD per rail or a host-network fallback.
Provider-specific: AWS EFA (vpc.amazonaws.com/efa and libfabric), DOKS (rdma/fabricN with roce-net-fabricN@fabricN), and GKE DRANET (DRA claim templates and pod resourceClaims).
Device setup and the NCCL plugin on top of it can change job performance. On Google’s GB300, the built-in NCCL library picked an unroutable link-local GID and hung when we tested. Setting NCCL_IB_GID_INDEX=3 fixed it, and Google’s gIB plugin hit 99.5 GB/s on a 16-node, 16 GiB all-to-all vs 95.3 GB/s from other providers, i.e., full performance.
With that said, multinode NVLink is its own problem. The ComputeDomain CRD in NVIDIA’s DRA driver gives each job its own IMEX daemons and channel claims, independent of RDMA. Google, GMI, and Firmus Kubernetes used ComputeDomain, with different RDMA paths: DRANET at Google, shared devices with host networking at GMI, per-rail VFs at Firmus. Meanwhile, Oracle, Azure Slurm, GMI Slurm, Firmus Slurm, and Nebius Soperator supplied IMEX from the host with no tenant claim. Azure AKS ran multi-node NVLink with no tenant-visible ComputeDomain, despite GPU DRA ResourceSlices, and the channel source and tenant isolation boundary were undocumented.
Each ComputeDomain must stay inside one NVLink domain, since crossing domains needs RDMA. In other words, this is topology-aware networking on the hierarchical scale-up NVLink + scale-out RDMA networks. When we launched jobs incorrectly, without ComputeDomain awareness, they just hung in clique setup when placement crossed racks. We will leave our rants about EFA not supporting DeepEP and MoonEP for the AWS provider review later on in the Appendix.
Reliability, Health Checks, Autoremediation, and SLAs
Around the time we started our research for How Much Do GPU Clusters Really Cost?, we started injecting failures into every cluster we tested. The differences between providers were big. Handling a failure takes two things:
Identify it happened
Fix it properly
To identify failures, we recommend monitoring dashboards. A good dashboard shows the failed component, the affected jobs, the current scheduler state, and when each check last ran. A stale green result is not evidence of health. Of course, a monitoring dashboard relies on some telemetry, so you have to have DCGM setup correctly (and securely).
To fix failures, we expect autoremediation: reboots and replacement with hot spare nodes. Autoremediation will not cover everything. Some failures need human intervention, RMAs, and other work that the provider must communicate directly to the customer. We covered the exact cost, measured in the form of goodput, in our article on this topic.
NVIDIA recently open-sourced NVSentinel, a fault detection and remediation system for Kubernetes. It reads DCGM, syslog, and cloud maintenance events, then can cordon and drain nodes, reset GPUs, or reboot. The default install is monitoring only. The software is the easy part. The important part is the mapping from each XID to the action the provider takes. A contained XID 94 needs an application restart. An uncontained XID 95 needs GPU recovery. Clearly, if you naïvely reboot every node for every XID, you’ll kill healthy work, while if you leave GPUs schedulable after serious XIDs, you risk workloads crashing.
This is also why many customers want bare metal only. They just want the provider to close support tickets. Closing support tickets is harder than it sounds. A given ticket can come from any of 100+ XIDs, each with a different meaning and resolution. SOPs cover everything from swapping a drive or power supply, to cleaning cables, to reseating memory, GPUs, or NICs, all the way to RMAing individual components or whole server trays.
There are a lot of different choices for autoremediation, and the right one depends on the system. Also, remediation is a different question for GB than for HGX. On HGX, you swap in a hot spare node with 8 GPUs. On NVL72, you cannot hot swap 8 more GPUs into the NVLink domain. A failed tray takes 4 GPUs down, and the options are to run the rack degraded or to swap the whole rack. The good news is that GB300 tends to fail less than GB200. Either way, the flow from an error to the action in the datacenter is what matters.
Some providers told us they wait before acting, to leave customers time to get their stuff off the node. That is cope. We are simulating a hard failure. The node is dead, and there is nothing left to get off it. (It’s a general truism that if a provider says they choose not to do something because they want to “give their customers optionality,” it is cope, and it’s only a matter of time before the provider recognizes it as such.)
This is where owning and operating the datacenter differs from renting colo. A provider that runs its own facility controls the technicians, the spares, and the SOPs on site. A provider in colo can depend on the landlord’s remote hands and their schedule. Both show up in how fast capacity comes back, and that is what an SLA has to measure.
When it comes to SLAs, we have developed a standardized set of SLAs for 3 tiers of providers
In these documents we provide the following:
Technical definitions for “node”, “rack”, “cluster”, and “site” in two scenarios (HGX 8-way systems, i.e. H100 or B300, and MGX 4-way systems, i.e., GB200 or VR NVL72)
Technical definitions of “downtime” for all systems
Three tiers of associated SLAs (“Bronze”, “Silver”, and “Gold”, with corresponding thresholds and credit penalties associated with downtime)
Two-way commitments for measuring downtime and providing credits
Recommended exclusions from downtime measurement, such as software upgrades, security patches, and physical maintenance
Recommended monthly review cadence for provider performance against SLAs
Contract termination rights for the buyer associated with downtime below recommended thresholds
Definitions of acceptance testing, with descriptions of the types of tests to perform across GPU compute, networking, storage and software to validate a cluster is operational and can be accepted, with recommendations to contact SemiAnalysis for a ClusterMAX technical assessment
Contract termination rights for the buyer associated with missing an agreed acceptance date
Definitions for “force majeure” clauses
… and more
We encourage Compute Buyers (Neolabs), Cloud Providers (Neoclouds), Debt/Financing Partners, and Insurance Providers to use these terms as a basis for their contracts, and to include a SemiAnalysis Technical Assessment during acceptance testing and monthly SLA performance reviews. We perform this Technical Assessment using our cmax utility and a comprehensive, proprietary process.
Please contact us at clustermax@semianalysis.com for more information.
Security
Since we put out “Most Neoclouds Suck at Security,” we’ve been encouraged by the response. Our friends have been running our CLI on their clusters to find which dusty old packages to replace, and there has generally been increased impetus to treat this issue with the seriousness that it merits.
Still, we think it deserves more scrutiny. As discourse reaches a fever pitch over whether AI will kill everyone, there has been almost no analysis of the concrete means by which it could actually elude control and do harm. OpenAI and Anthropic are spending gazillions of dollars doing gain-of-function research, some of their infra has been revealed deeply suspect, and yet it has mostly escaped commentary that GPU clusters—the physical hosts that underlie these models—often have nothing like the immune system that you would hope.
The imperative of good security practices holds regardless of your beliefs about AI capabilities. Even if these clusters were made no more vulnerable by AI tools, the fact would remain that we are spending billions on infrastructure that is not secure as it ought to be. There are plenty of unpleasant scenarios to imagine that involve nothing more than a guy with Vim and a good understanding of operating systems. Read through the Hugging Face reports and tally the number of mundane cybersec errors that let the fire spread.
It’s also worth emphasizing that this is, to some extent, a structural risk. As the industry navigates the hazards of heavy-handed regulation and uncritical social pushback, a breach of an LLM factory is the last thing it should invite into headlines. This is true for cybersecurity reasons—each compromised node increases the number of neighbors for bad actors to explore—as well as ordinary sociopolitical ones—for better or worse, detractors will paint the neocloud industry with a broad brush.
Be a good neighbor and don’t get hacked.

Agentic Coding
Agentic coding is already putting margin pressure on managed GPU clusters because customers that use AI tools are more willing to take bare metal or lightly managed clusters. We saw evidence for this all the time in our testing. If we needed to add Linux users, but there was no script on the cluster, Codex /goal make useradd script and add my whole team saved the legwork. Especially on clusters with poor documentation, agents helped grind through all the possible configurations to get us unblocked. The corresponding Slack conversation often went something like:
“hey guys, how are we supposed to use XYZ?”
“nevermind, Codex told me ABC.”
“ya that’s right. we’ll add that to the docs.”
Agents helped us most in environments with clear success criteria and good context; otherwise, their approaches to GPU systems were naïve. They have the relevant knowledge, but it is not highly weighted relative to plausible but wrong approaches. Claude, for example, has a habit of overwhelming the Slurm controller by using loops instead of job arrays. One agent of ours decided the NVLink fabric was too much of a pain to configure, instead launching jobs over InfiniBand and declaring victory; another made a similar mistake running storage tests on NVMe instead of NFS; another blamed the provider for poor perf after it tried to schedule GPU jobs onto a CPU node. We usually let agents run overnight, either with `/goal fix this part of the cluster so tests can run` or `/goal try to break this part of the cluster with a realistic workload`. Overall, this allowed us to multiply our output, but sometimes validating the results took longer than it would have to do it ourselves. If you have a good idea how to set up a cluster, agents make you more powerful, and you might even entertain working with a worse provider than otherwise. If you don’t know what you’re doing, your AGI advisor will cheerfully tell you to shoot your foot off. In this semi-legible business, agents magnify skill deltas rather than flattening them.
An insightful example of this is in CoreWeave’s bring-up, which was already among the most rigorous in the industry. Now, in addition to a stringent classical process, they have LLMs run statistics over their fleet, hunting for patterns that flag failures earlier and improve their procedures. CoreWeave also has a NodeBot that provides lightweight reasoning on top of their automated alerts, summarizing the situation and suggesting next steps to simplify diagnosis for the humans in the loop. For example, the team described an event where a thermal interface material pump-out alert should have moved the node out of the cluster for investigation, but a simultaneous PMU halt alert competed to reboot the node instead of triaging it. NodeBot identified the correct action despite that conflict. CoreWeave has experience running GPUs at scale, knows countless rules of thumb that are absent from the training data, and has experts constantly closing the feedback loop to improve their use of these models; even if OpenAI built a banger chip with AI-generated kernels, we don’t expect CoreWeave to be threatened by upstart neoclouds with vibecoded datacenter automations any time soon.
Despite the fact that—let’s be honest—everyone in the industry is using AI at least for some workflows, the only AI-first offering we saw was a nice MCP server provided by AWS. Otherwise, all the documentation was nominally written for humans. The best thing that a provider can do to cater to agents is to provide exhaustive documentation—ideally, much more thorough than a human could ever have gone through—and leave golden recipes on the cluster as a starting point for hillclimbing. In addition to the legacy processes that are not yet AI-first, there are many systems that are strictly worse because they are not built for agents. For example, although letting AI manage your jobs could be good for cluster utilization, it doesn’t respect the old-fashioned systems put in place to aid research. CoreWeave and Nebius have many Slurm-layer optimizations—real job accounting systems with RBAC and priorities enforced on users and groups, carefully managed partitions, job arrays, logs and metrics—that are wasted when everything is run agentically. CoreWeave also tells us that they have seen head nodes run out of memory as remote-control Claude sloporchestrates the cluster. It will be interesting to watch providers improve their AI agent affordances.
Going Forward
As described throughout this article, we have been historically testing clusters. But the market has clearly moved in two opposing directions.
First, the biggest labs are buying bare metal at massive scale, measured in the 100’s of MWs, and have the talent in house to manage their own training clusters, orchestration software, monitoring and reliability. In essence, their neocloud providers (when they use them, and don’t do self build) are datacenter technicians who close tickets. This is a complicated business, and not to be taken for granted: there are 172 unique, documented ways an NVIDIA GPU can fail (XIDs). And many of these failure modes can overlap, resulting in an incredible surface area of different failure scenarios that require a combination of simple troubleshooting logic, human experience, and increasingly, agentic research by AI to recover from these failures.
Meanwhile, many startups are raising 10s or 100s of millions of $$ and spending effectively all of that money on compute. But since so much of this research is driven by RL, via continual learning on real production traces for long horizon agents, the needs for both offline, throughput-optimized inference, and online, latency-sensitive inference is very strong. At the same time, more and more customers are looking for the simplest way to purchase vanilla open source tokens for their workflows.
This leads to our next article, coming soon, where we will describe the Anatomy of an Inference Endpoint, moving towards the inclusion of inference endpoint testing in future versions of ClusterMAX. We believe that all neoclouds need to have an endpoints business going forward.
We will also be evaluating RL infrastructure beyond inference: sandboxes, hosted training, evals, and more. We continue to see lots of new providers enter (and exit) the market every day. It is an exciting time to be in AI, and neoclouds are at the centre of it.
If you got to this point in the article and are still eager to learn more about our individual experience on every provider, you should consider coming to work at SemiAnalysis!
We are actively hiring across Research, Consulting, and Technical Staff. We have multiple openings in our New York and San Francisco offices. Remote work is also acceptable.
ClusterMAX Engineer: all levels of experience with Slurm, Kubernetes, and GPUs considered (full time)
Tokenomics Engineer: all levels of experience with model evals, harnesses, inference endpoints, and RL infrastructure considered (full time)
Research Analyst - AI Infrastructure and Economics: all levels of experience covering the financials of neoclouds, neolabs, and frontier labs tokenomics considered (full time, or internship)
Technical Consultant: lead engagements from technical strategy to technical due diligence. all levels of experience from consulting and technical backgrounds considered (full time)
Thanks for reading, and we look forward to seeing you for future versions of ClusterMAX.
Appendix: Provider Reviews
Platinum
CoreWeave
CoreWeave remains the industry’s sharpest, sturdiest, most proactive neocloud.
Our CoreWeave clusters are exemplary in all crucial categories. The health checks work as intended, the reliability is excellent, and nearly all tests reach expected values out of the box. Along with Nebius, CoreWeave serves as a measuring stick for others in the industry—not only in the abstract sense of “excellent performer,” but also in the literal sense that we compare their clusters to lower-rated ones as a means of precisely describing others’ shortcomings. Whereas other neoclouds have to be nagged to refresh their moldy GPU drivers, CoreWeave has not only taken care of the basics, but stood up a significant independent stack for marginal performance and reliability improvements.
The ClusterMAX 2.0 report went into great detail on CoreWeave’s design decisions, including its bare metal provisioning, Slurm fork, use of DPUs, and health checks. Since then, one smart feature that the nerds at CoreWeave have added is called “GPU straggler detection,” which is integrated into their best-in-class dashboard. Rather than leaving their customers to dig through logs or do binary search over their fleet to isolate a bad rank, CoreWeave applies handrolled algorithms to NCCL telemetry and recommends a remediation strategy based on its findings. The CoreWeave team tells us that they use this on calls with their customers just about every day. There are all kinds of soft failures that don’t write an XID or leave any other obvious signature, but waste GPU hours as the job waits on a straggler.
Better than spotting bad GPUs is not scheduling them in the first place; CoreWeave also has systems to make sure every node clears a high bar before it’s trusted with a customer’s workloads. When a node is idle in CKS, CoreWeave runs burn-ins for 20-30 minutes of every hour, validating that scale-up and scale-out fabrics are healthy, GEMM numbers are up to spec, D2H and H2D bandwidth are high, and so on. These tests are pre-empted by customer workloads; invisible to the operator, they help make sure that it’s not production workloads that catch faults. CoreWeave is certainly not the only provider with active health checks, but these are unusually robust.
This diligence extends to CoreWeave’s bring-up process. Provisioning around 10,000 GPUs per week, CoreWeave believes that they have more data than God about what proves a Blackwell rack healthy. In CoreWeave’s view, Nvidia diags are good at catching many failures, but their uniquely deep dataset has allowed them to roll out a custom suite of supplementary tests, including for NVLink. The heart of this process is the Fleet LifeCycle Controller (FLCC), which “automates node provisioning, testing, and monitoring” and owns the path from power-on to handover. Importantly, as others operating fleets at scale can corroborate, there’s a long tail of obscure failure modes not well covered by Nvidia documentation. CoreWeave keeps statistics on these failures to better predict future faults and bakes its response patterns into FLCC. This is one reason that experience with operations at scale is a crucial criterion in our ratings. There is a huge difference between a newbie and a provider like CoreWeave that has rigorous runbooks, automation, and burn-ins. As described in the “Agentic Coding” section above, CoreWeave uses LLMs on top of this system to glean insights that would not be spotted by a human engineer. CoreWeave also works with manufacturers before delivery. Involvement varies by OEM or ODM and by production stage, but in general, the goal is to work backward through the supply chain to catch issues as early as possible: never catch in prod what you could have spotted in bring-up, and never catch in L11 diags what you could have spotted on the factory floor.
Their experience with Blackwell NVL72 bring-up and validation, along with their close relationships with Nvidia and Dell, have allowed CoreWeave to be the first provider to announce a VR200 NVL72 system passing L11 diags. CoreWeave has described VR as “the generation where we bring our own IP.” As the physical demands of compute continue increasing, in CoreWeave’s view, “how the building operates is now part of how the computer operates—they are not two individual things anymore.” Thus, CoreWeave introduced its custom Racky, Valvey, and RLCC in a recent blog post. Particularly interesting is Valvey, a programmable per-rack liquid cooling valve assembly. This gives CoreWeave fine-grained control over each rack’s cooling loop and also, in case of a leak or other emergency, the ability to trigger a shutdown. Despite beginning to adopt a hyperscaler mentality in building its own hardware, CoreWeave frames its approach as anti-hyper: whereas traditional infra emphasizes redundancy and is built to prevent failures, CoreWeave builds to fail gracefully and recover fast, limiting failure domains and allowing nimbler response to the inevitable failures.
Amidst the current trillion-dollar buildout, however, CoreWeave is responding to the massive increase in customer demand and dealing with increasing cost of capital. Of course, there is plenty of good news to mention. Its relationships with Meta, Microsoft, OpenAI, and NVIDIA—its largest customers—appear strong, and it recently struck a multi-year deal with Anthropic. It has announced splashy deals with HRT and Jane Street this summer. It is also aggressively expanding its capacity in APAC, indicating that it “expect[s] international markets to become a major driver of growth.” Yet it sits with $35B in debt and has already seen investor resistance getting projects off the ground. As a result, CoreWeave has become focused on long-term bare metal contracts, which are easy to fund with an investment-grade counterparty, rather than managed clusters, which have higher margins but which the market is less keen to fund. Moreover, our last writeup mentioned an impressive lineup of recent acquisitions, but since then its Core Scientific merger fell through and nothing else has been announced.
In terms of feedback, some of which is a bit nitpicky:
We wish that their managed SUNK auth RBAC was done on an per cluster basis
We wish that enabling local GPUDirect Storage could be an 1 click button in the UX console
Onboarding new users and where they put the the ssh pub key input in the UX console is extremely confusing to many users that tried
CoreWeave has begun to diversify from bare metal, first by offering self-service SUNK clusters, which gives them the option to sell into the on-demand market when they have capacity for it. They also launched a managed inference platform, which recently disclosed $100M ARR. We are actively testing this for an upcoming article on serverless inference endpoints, though were disappointed to find no support for public endpoints paid by the token. For now, let’s just say that CoreWeave has some work left to do on their inference endpoints.
Nebius
Nebius was rated the 2nd-best neocloud in the world in ClusterMAX 2.0, yet it remained in Gold. This time, Nebius is unquestionably an industry leader with strong offerings in every category and the ability to command a significant price premium. Nebius moves into Platinum.
Nebius’s relationship with Nvidia remains strong, including a $2B investment in March, as Nvidia disclosed a 9.3% overall stake in July. Nebius was the first provider to deploy HGX B300s back in December of 2025, and has been among the first neoclouds in VR NVL72 bring-up, expecting to begin deployment late this year or early next.
Nebius’s buildout continues across a number of sites in the US and Europe as they recently raised their 2027 year-end contracted power target to 5 GW. In terms of offtakers, Nebius has signed large deals with hyperscalers Meta and Microsoft and smaller ones with Reflection AI and Palantir, making it one of a few neoclouds with multi-hundred-MW hyperscaler agreements that still regularly competes for much smaller startup contracts. They are the most active of all neoclouds in the short-term cluster market, serving many happy customers. The days of Nebius spooking prospects with their Russian accents are behind them. This is mirrored by its capacity procurement: unlike many of its peers, Nebius has opportunistically snatched up sites in the 5-20 MW range through a broad network of datacenter and software partners.
In terms of the clusters themselves, well, a good cluster is generally boring. On Nebius, burn-ins run without errors; Slurm is topology-aware; the packages we need are on the cluster and generally recent; WAN is good; the orchestration layers are free of footguns. One point of distinction technically between Nebius and everyone else is that Nebius builds and open-sources its preferred SonK flavor, Soperator. (CoreWeave, of course, builds SUNK in house, but it is not open-source.) This round, a Gcore cluster we tested used Soperator, and as did Voltage Park and FPT clusters from previous rounds. Nebius writes that “the real magic of Soperator lies in how we use ‘jail’ Persistent Volume”: Nebius provides a VirtioFS volume at `jail`, then bind-mounts it at `/`, so you don’t need to worry about pointing your cache to the right directory, or think much about taking your files with you when you `salloc` a node. You’ll see in our writeups of other providers a handful of gnarly issues with managing the storage system on SonK: Slurm and Kubernetes have different philosophies of persistence, and it’s not always straightforward to provide the illusion of bare metal when in fact you’re several layers up, standing on an ephemeral Kubernetes pod. Nebius’s approach makes this stress-free for the operator.
In particular, Nebius provided us a handful of storage tiers on every worker: `/jail` VirtioFS, `/home` NFS, `/mnt/data/` VirtioFS, `/mnt/local-nvme` ext4, and `/mnt/memory` tmpfs, as well as first-class S3. For I/O-heavy jobs, `/mnt/data` is recommended, whereas `/home` suffices for shared code and other data with lower-concurrency access. When we first tested `/mnt/data`, we saw very slow 4 KiB sequential allocating writes, while concurrent directory creation from 128+ ranks sometimes returned `EEXIST` due to inconsistent metadata visibility, killing our jobs. With our feedback on the pathological workloads, Nebius retuned this filesystem, and it proved sturdy and fast. We pushed it around and verified that the errors were resolved; per-client, it outperformed the median, and we could further verify that it scaled to handle demanding workloads across two racks.
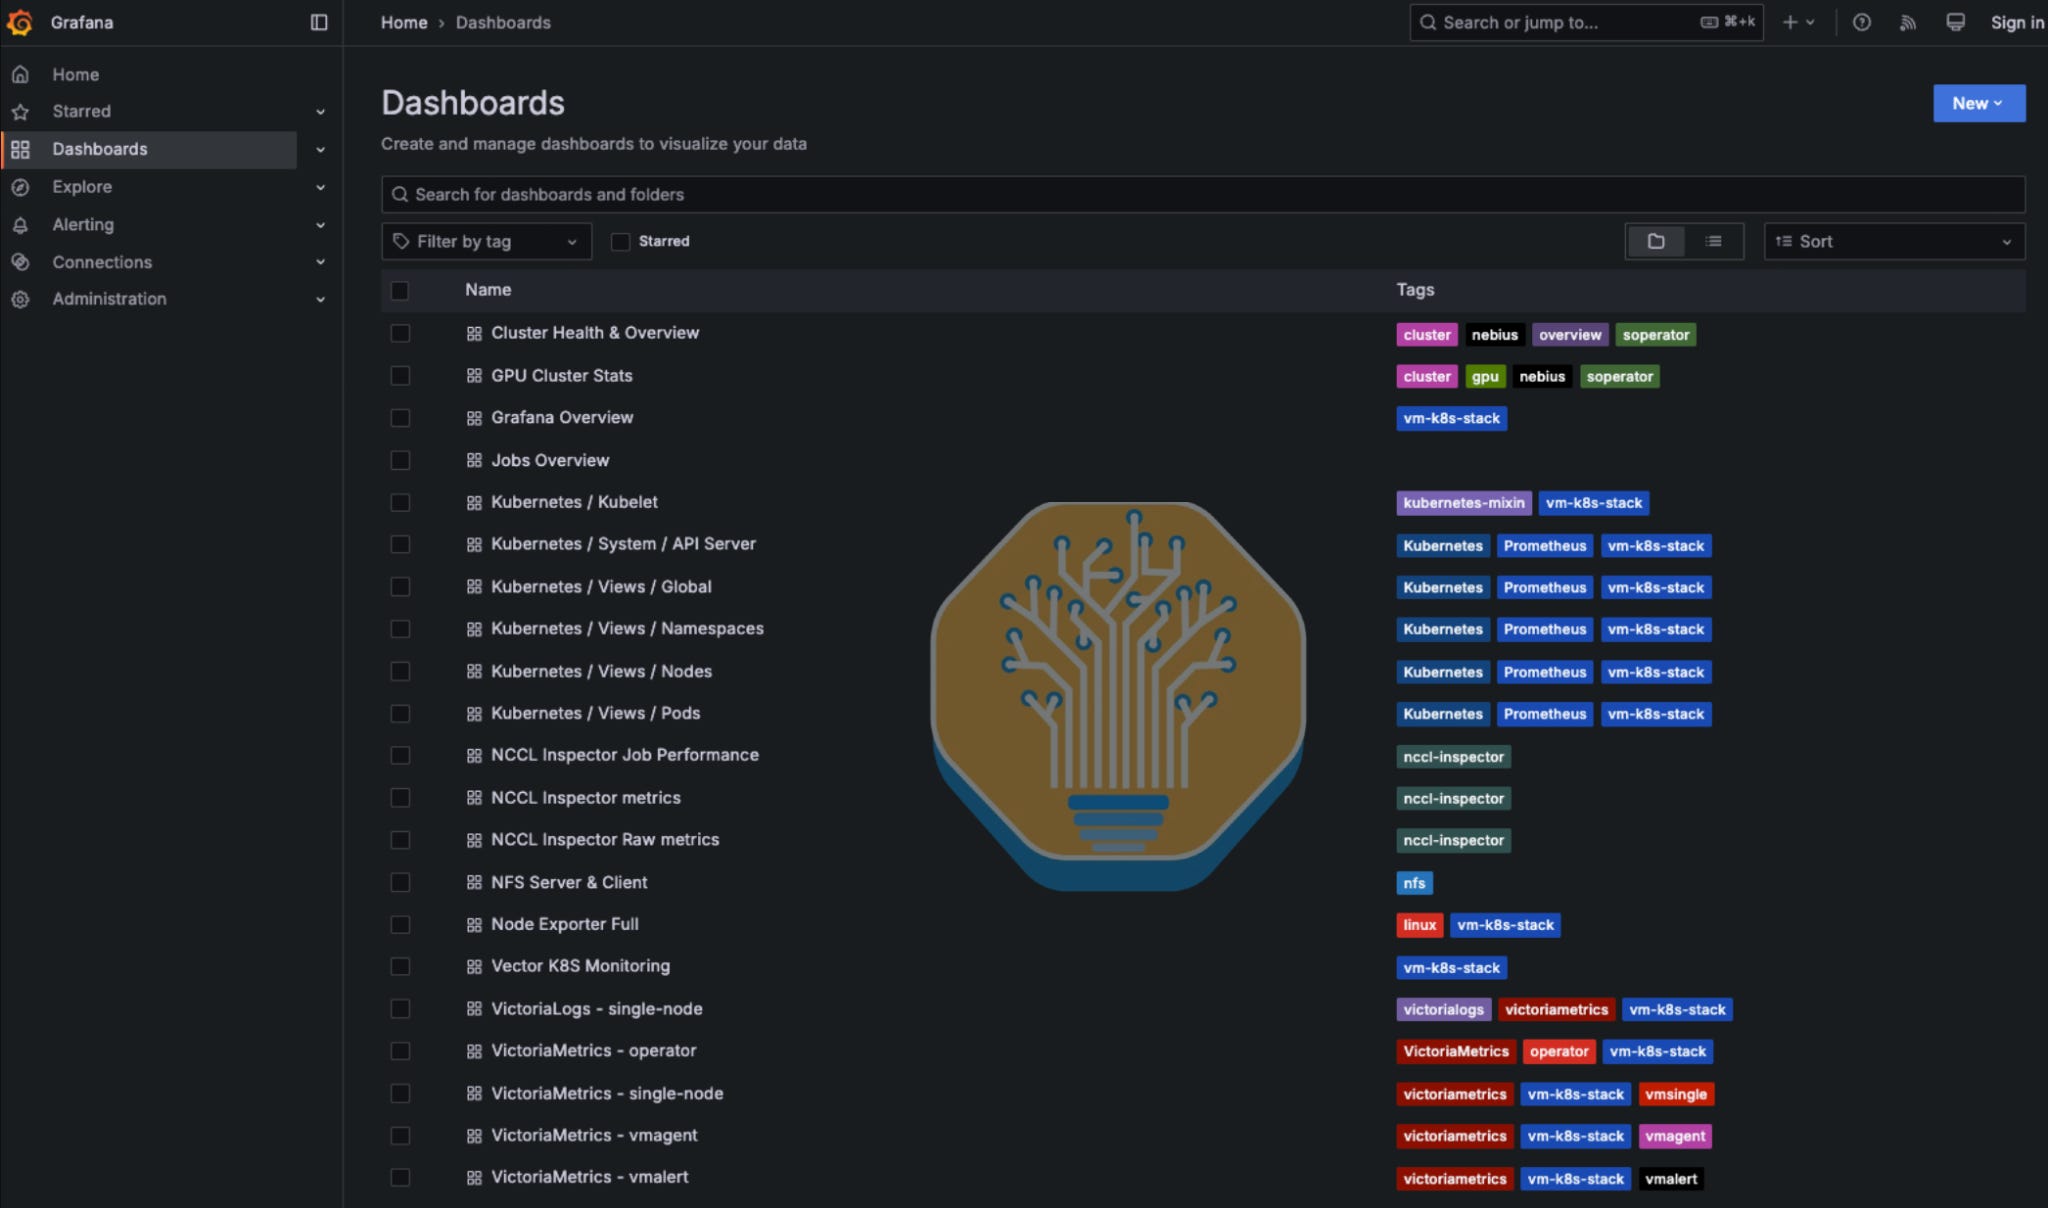
Nebius has put a great deal of work into its health checks, and in our testing, they performed well. Nebius automatically returned a node to service after a synthetic error injection on our GB300 rack; the process is not yet optimized for speed, taking 8h40m from start to finish, but detection is immediate, and the process ultimately works. Moreover, the other GB300 racks we tested did not automatically reboot and return failed nodes, so the fact that this process is self-driving counts in Nebius’s favor. (As we describe in the “Blackwell and Grace Blackwell” section, it’s common not to autoremediate GB300 nodes at all, since there is no real way to hot-swap a node into an NVL72 rack, and troubleshooting is generally way more complicated than with HGX servers.) Nebius also provided us with an excellent suite of dashboards shedding light on, among other things, cluster health.
This all leads to Nebius watching their revenue per MW climb compared to CoreWeave’s (and their market cap along with it). Since they have so much more capacity to sell at the current prices, we expect this trend to continue. Anecdotally, we have seen Nebius get very aggressive during recent negotiations, including a case where they offered a tranche of capacity as a straight-up auction. In general, demanding high prices and sizable prepayments that reach 100% on 1 year commits seems like quite a nice business, especially when those prepayments can cover the entire capex of the servers at the current TCV. Infinite Project IRR anyone?
At their largest bare metal sites, Nebius continues to face delays in construction and permitting, including both Béthune and Vineland, which we have covered extensively for clients of our industry-leading Datacenter Model. But as more chips of all types come online, Nebius’s track record puts them in a strong position to continue to grow.
Overall, we are consistently impressed with Nebius. While we do believe they still trail CoreWeave on many technical aspects and relationships with both NVIDIA and the frontier labs, solid business decisions have established them as the default neocloud to serve the neolabs.
Gold
Google Cloud
Amidst the strange retreat of Google Brain and DeepMind from the frontier, GCP has been dealmaking like few others. Notable partners include Palo Alto Networks for $10B and Thinking Machines Lab for a “multibillion-dollar deal,” along with expansions of its lucrative relationship with AI safety org Anthropic. With acquisitions of cybersecurity startup Wiz for $32B and energy startup Intersect for $4.75B in cash, Google has been aggressive in expanding its technical capabilities. It also exposes itself to new revenue streams by ramping TPU sales instead of only renting them through GCP, a development we are very keen to track. Its own TPUaaS is still growing, though, thanks to a $5B deal with Blackstone that is targeting 500 MW in capacity. Google has gigawatts in the pipeline, and we look forward to continuing to track its continued competition with the other hyperscalers and labs for access to power and permitting.
With a unique position cutting across so many layers of the stack, Google may have more total engineering talent than any company in the world, yet it has a notably imperfect history in supporting innovation. In ClusterMAX 1.0, we noted a myriad of issues with its platform, yet we predicted GCP would reach Gold or Platinum promptly. It has taken until ClusterMAX 3.0 for this to come true, but Google is finally and comfortably among the best managed cluster providers.
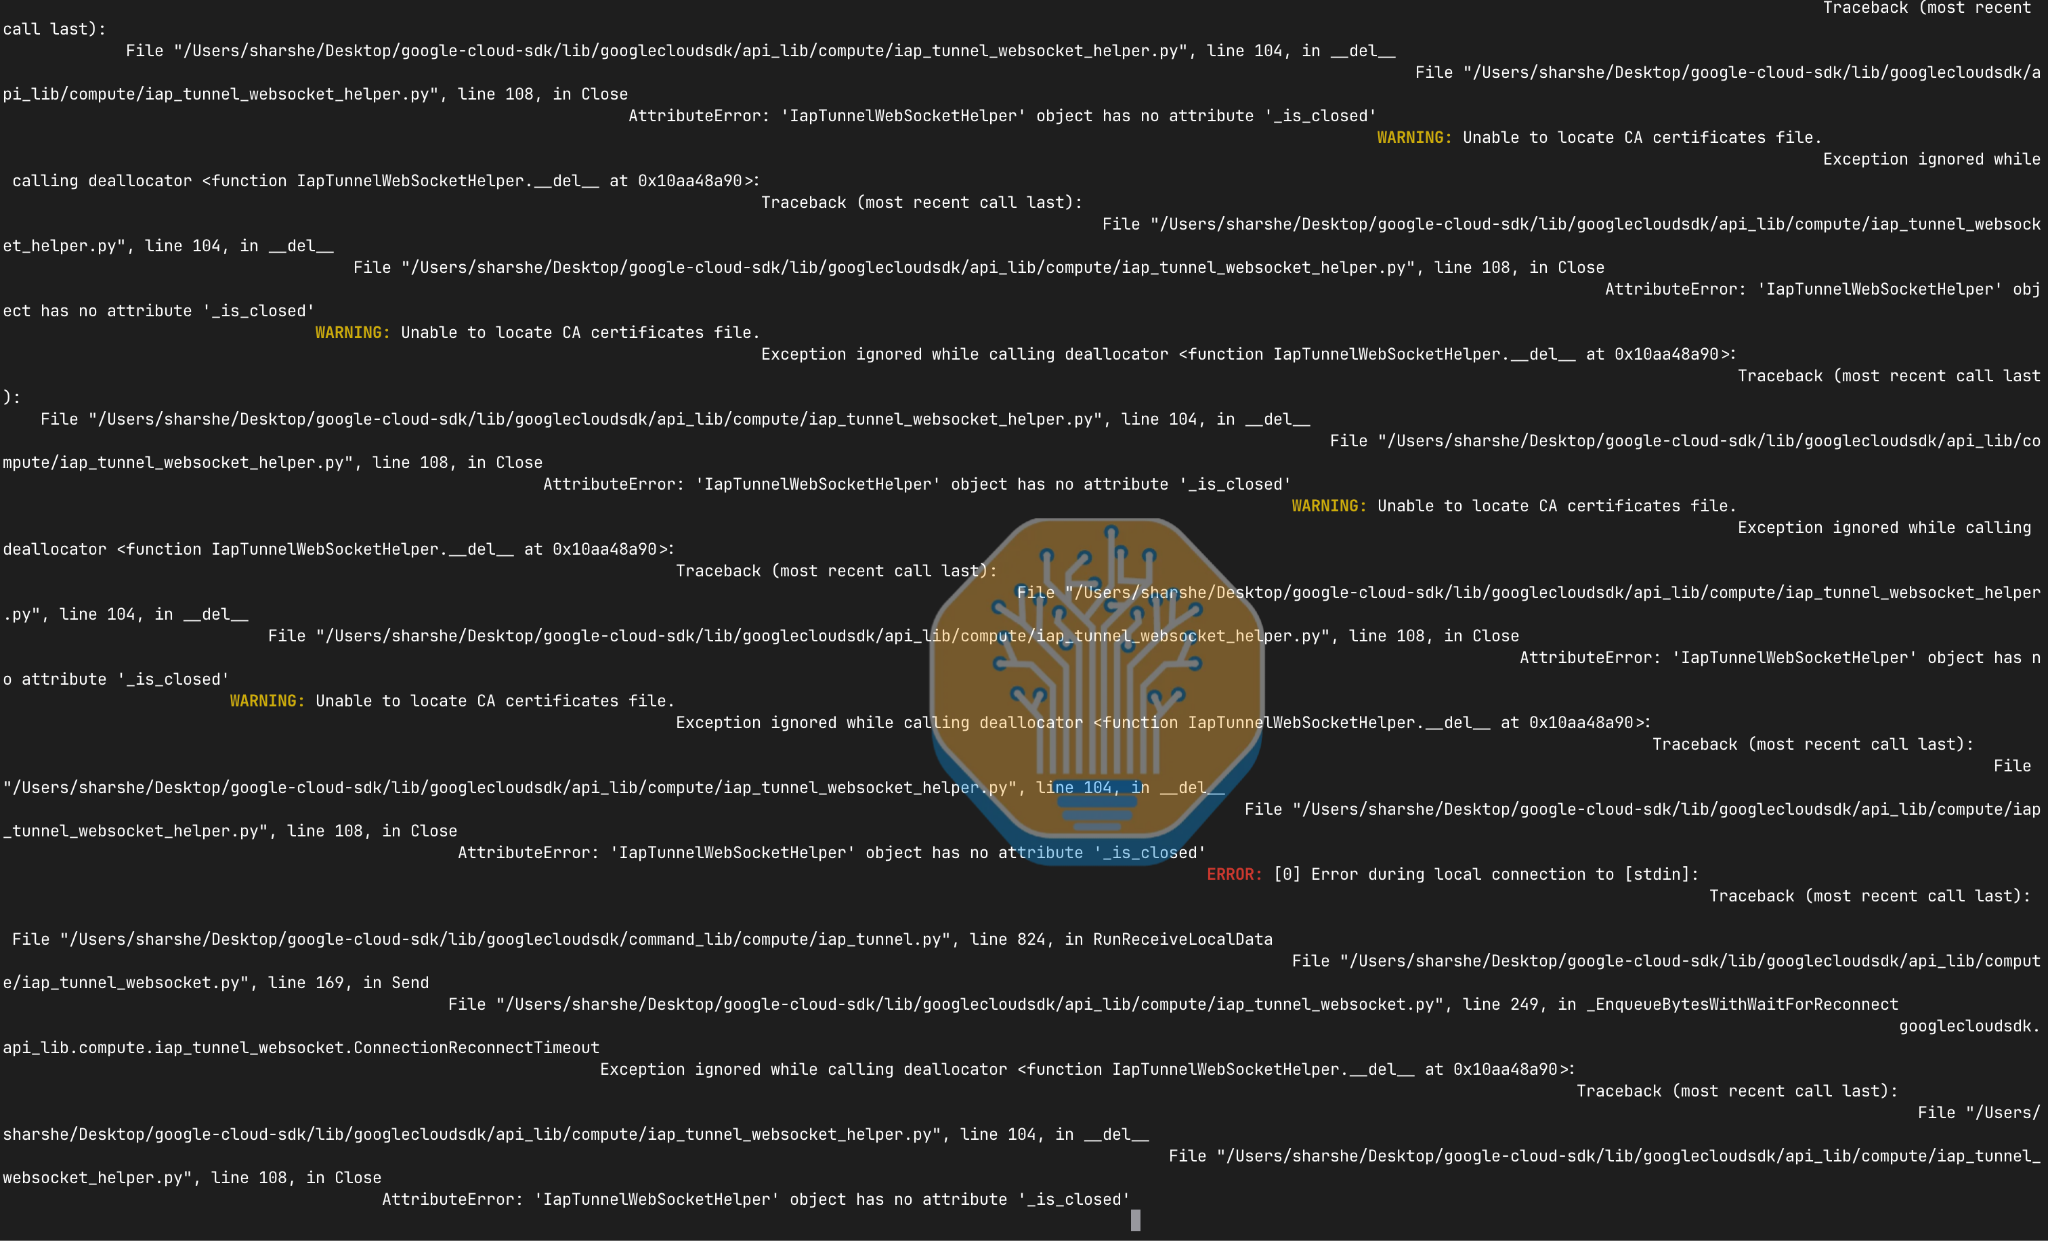
The GCP GPU experience is less refined than that of our Platinum providers, CoreWeave and Nebius. The console feels like the DMV compared to the streamlined UIs of the younger, more focused neoclouds. Access required a Google Cloud CLI that was occasionally uncooperative, forcing us sometimes to switch to the browser-based connection in Google’s console, which was also unreliable. There was a small misconfiguration on our GB200 GKE cluster, where default StorageClass refused to attach to the `a4x-highgpu-4g` nodes, forcing us to try again with a non-default class to get block storage. Nitpicks aside, GKE is very well set up, and we enjoy using it. Google’s managed Slurm is officially generally available and quite solid, with good defaults and health checks configured. A lot of the testing that we did for ClusterMAX 2.0 on their managed Slurm offering is now valid, since the bureaucrats in GCP Product Management are allowing real customers to use the offering, not sticking it with labels like “Beta” or “Pre Release” or “not yet GA.” (By the way, many of the neoclouds we’ll discuss after Google should consider using some of these labels more often—the balance is somewhere in the middle here.)

The biggest point of distinction between our GCP cluster and the other clusters we tested was networking. Our first NCCL test hung because automatic GID selection chose the wrong address, but pinning `NCCL_IB_GID_INDEX=3` completed the run. Even then, our NCCL tests were unsatisfactory: you would like to see a roughly logistic curve as performance increases monotonically in message size, but instead we had the following jagged shape:
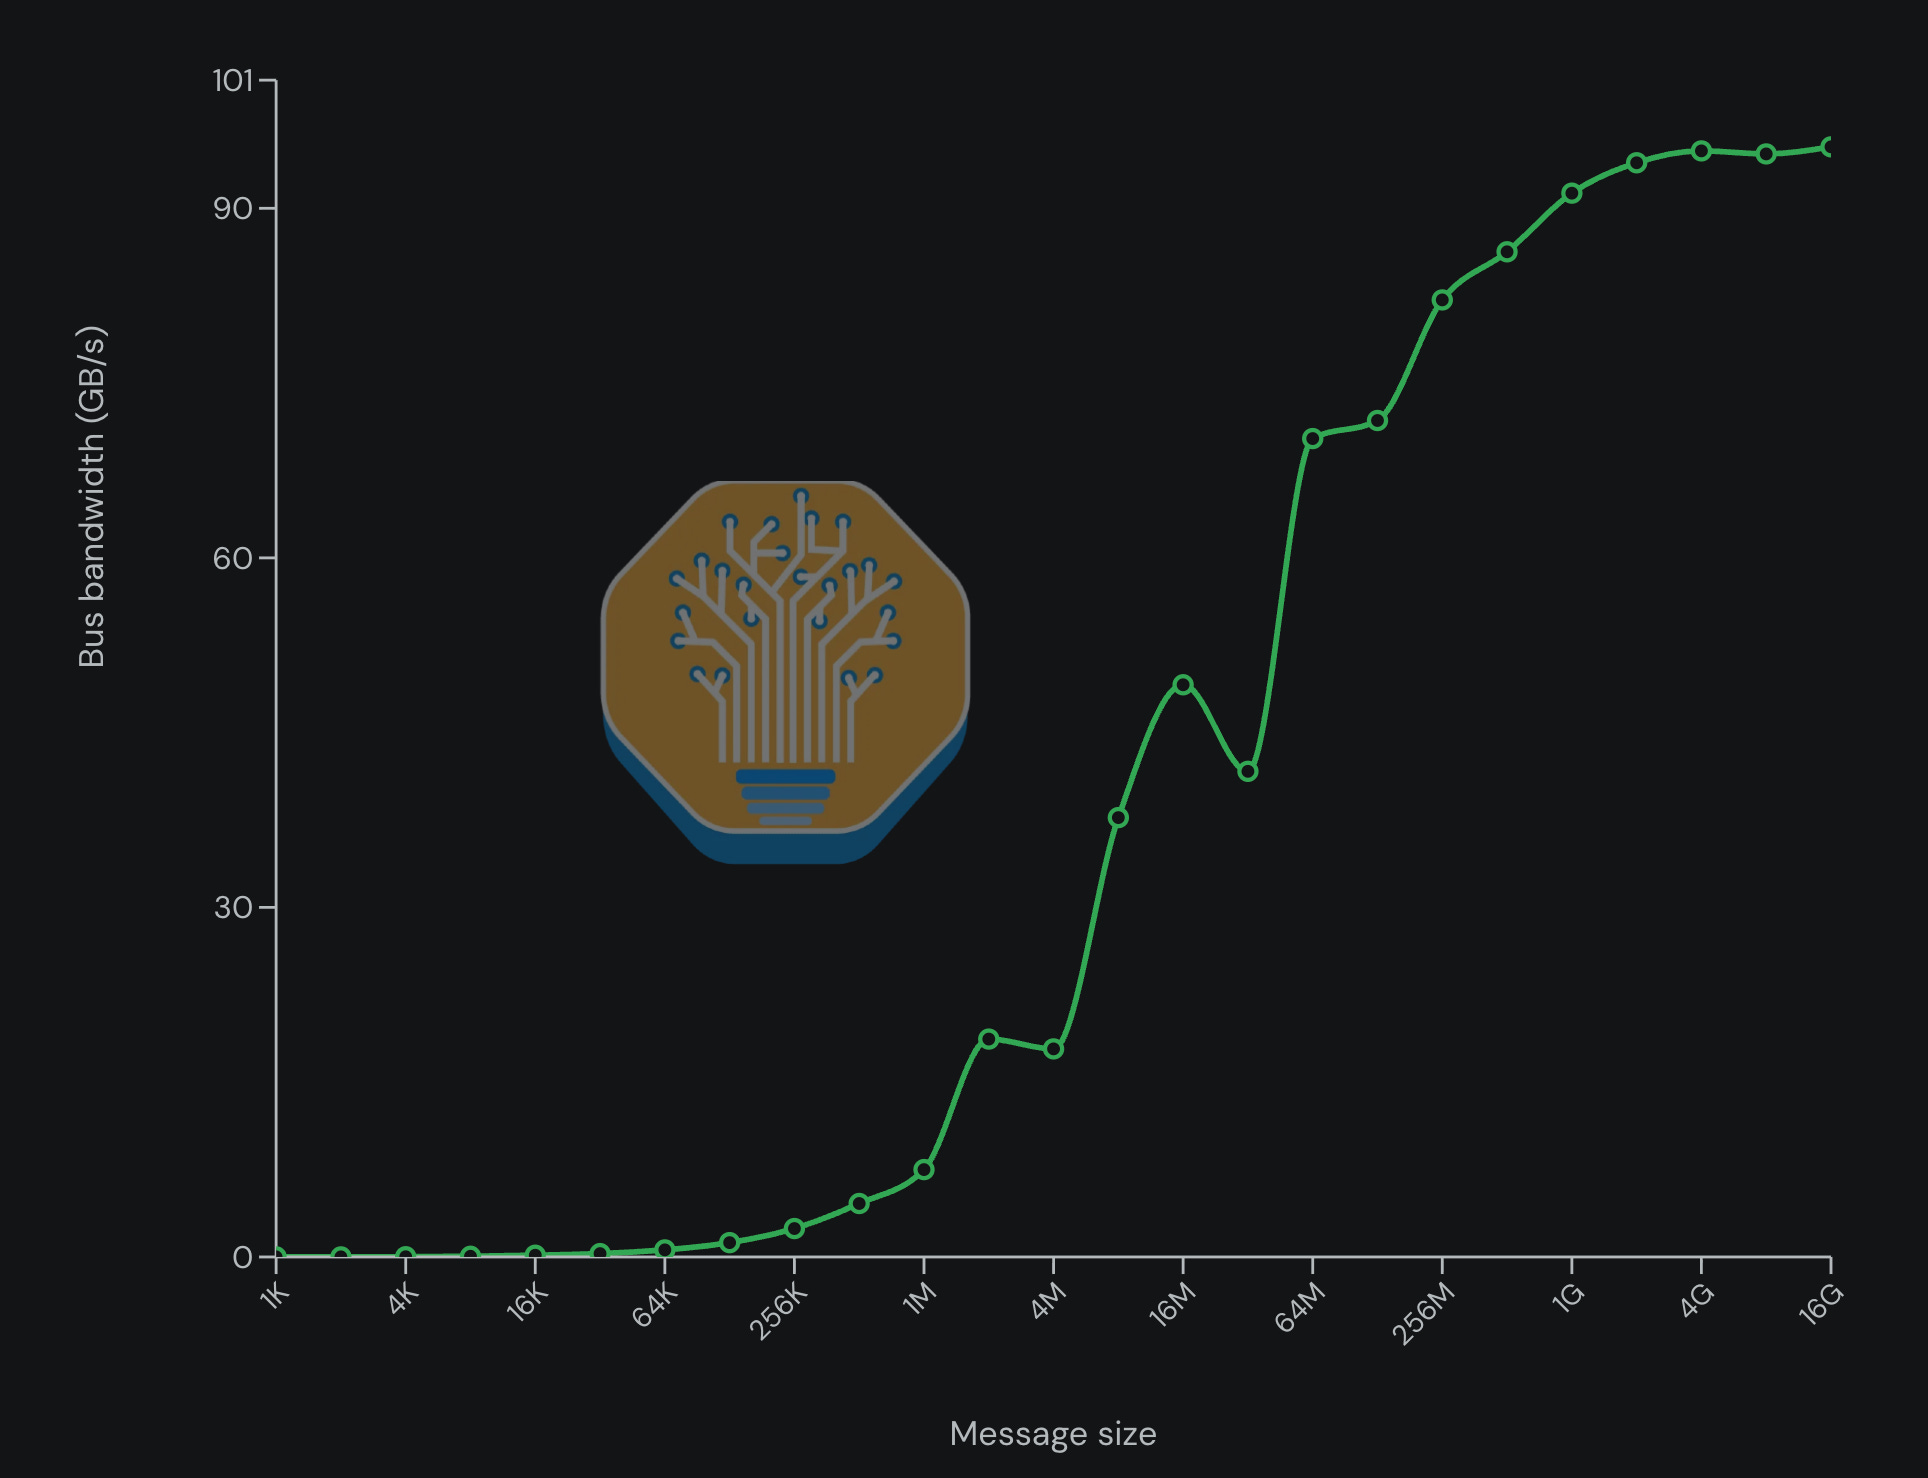
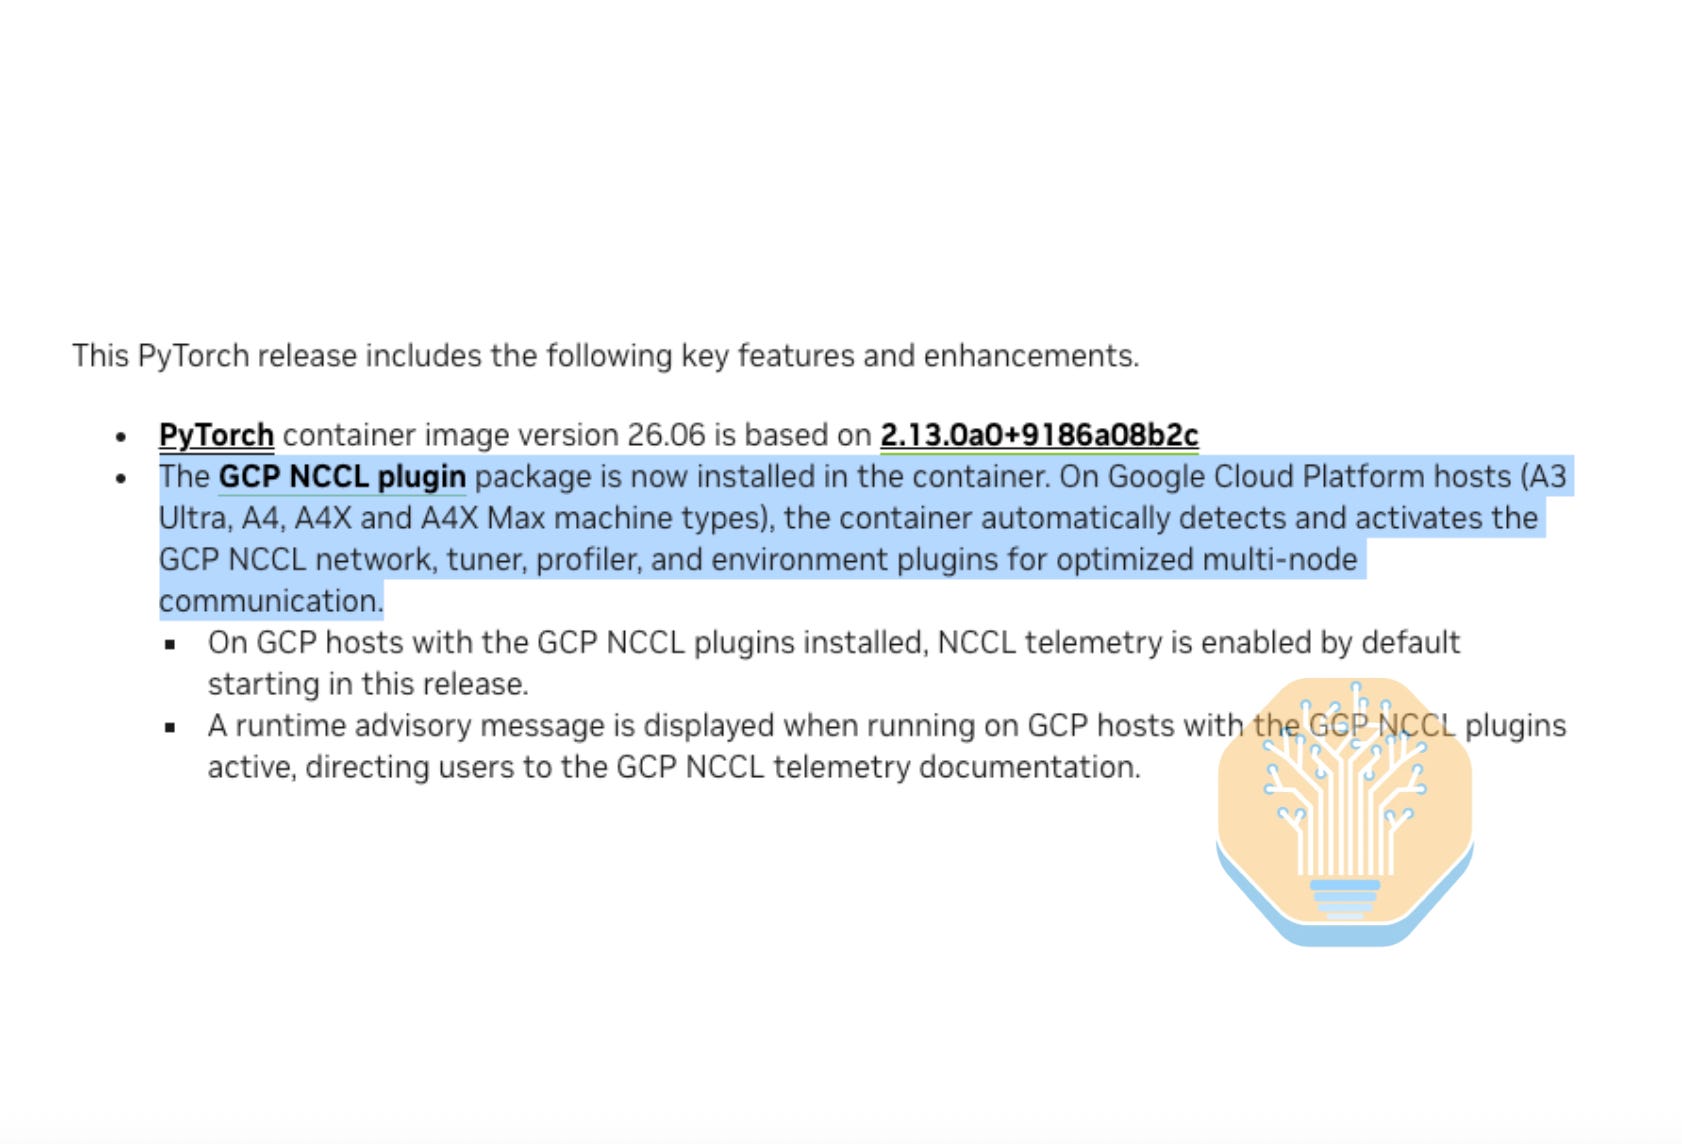
This could conceivably have been an issue with NCCL itself rather than a problem with our GCP configuration. NCCL’s heuristics don’t always pick the right protocol and algorithm for the message size and topology, and some hand-tuning is always expected. However, we have gigabytes of networking data gathered at this point, and we knew to expect better perf. The issue turned out to be simply that we did not have the gIB plugin enabled. This is a set of NCCL plugins Google that ships for improved perf on Google’s RoCE network. As of 26.07, gIB is baked into the NGC PyTorch image, so Google’s customers get the custom stack by default. With gIB installed, we got a better chart with 4.4% higher peak throughput for 16-node all-to-all. (Note that these tests are both with the multi-node NVLink fabric shut off to isolate performance of the scale-out network, which is RoCE in this case.)
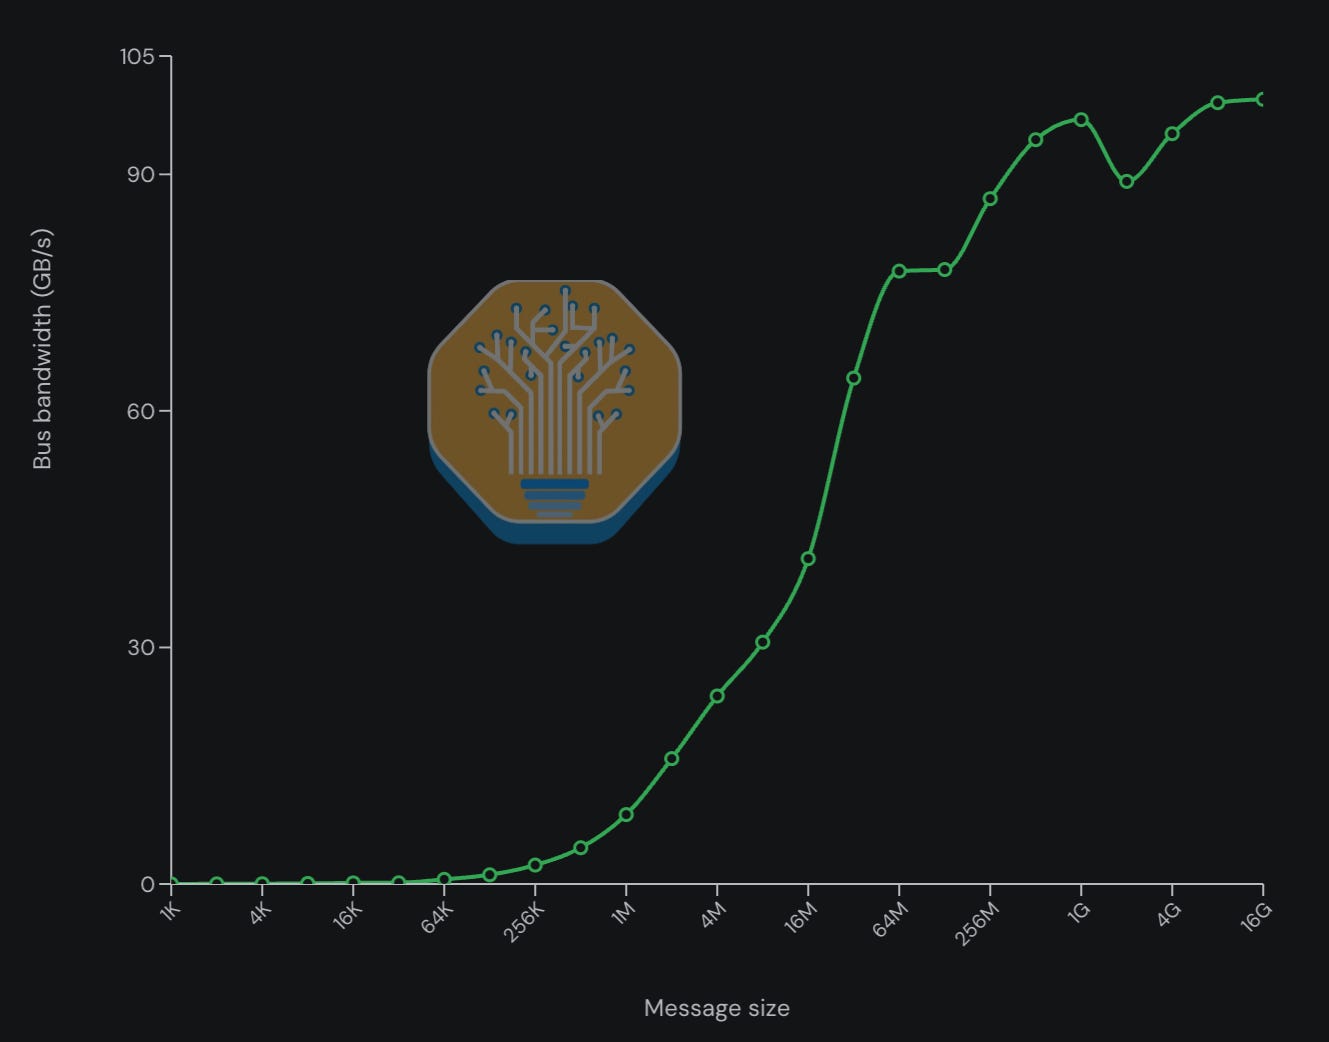
While not perfect, this looks much better, and the topline number is solid. At this point, it was clear that the fabric was healthy, the configuration was good enough, and an engineer looking to squeeze more juice out of the system would have a solid baseline to start from.
This is amazing work by Nvidia and Google to set up auto activation for Google’s ConnectX-7/8 NCCL plugin. Previously, users would need to mess around with the correct library load paths and env vars to get it set up correctly and optimize performance on ConnectX NICs on GCP Nvidia GPU machines. We gave feedback a couple of quarters ago, and now, it is fully automated!
GKE’s health checks worked well. As with other providers who have experience with NVL72 systems, Google’s health checks intervened but left it up to the operator to bring the sick node back to the fleet. In particular, after our XID was injected, the health check marked `GPUUnhealthy=True` and `cloud.google.com/health-check-status=warning`, but left the node schedulable. This configuration was easy to work with, it’s what GCP’s customers prefer as a default, and it can be configured to the user’s liking to respond to errors of various levels of severity.
To continue improving, GCP could take a look at all the quality-of-life changes that Nebius and CoreWeave have made in the recent past. It should ship a better console that’s easier to navigate, simplify IAM and RBAC, and ensure cluster access is painless, either through standard SSH or `kubectl` or by making its existing CLI bulletproof. Especially now that gIB is available in the default Nvidia images, we hope that GCP’s operators have no trouble getting good performance out of their GCP scale-out. They could also continue to pursue neolabs in the mid-market, improve the hands-on support experience, and improve their relationship with Nvidia. GCP consistently loses so much business to smaller, less capable neoclouds, because they either lack the GPU capacity or refuse to serve the market at a certain price point.
We look forward to testing GCP’s VR NVL72 systems when they are available and seeing GCP’s continued improvements on usability and performance.
Oracle
As we mentioned in ClusterMAX 2.0, Oracle is in a unique position among hyperscalers in that its growth must come from large contracts. Unlike AWS, Google, and Azure, Oracle does not have any agreements to sell frontier tokens, and unlike Meta and Google, it does not have a non-frontier lab it can hang its hat on. Instead, it continues to cut huge deals involving OpenAI, Meta, and Nvidia, reporting “the delivery of 850MW additional datacenter capacity” from June through August, an eye-watering number. We project its relative growth in 2027 to be the largest of the hyperscalers, though from the smallest base.
We tested two Oracle clusters, which we will describe in order. The first was a GB300 NVL72 cluster on Slurm, set on a multi-planar network. This was vanilla Slurm, but due to customer demand, Oracle has Slurm-on-OKE on its roadmap. Once our allocation began, we tried to find our way in through the console, but it proved, like all hyperscaler consoles, a forbidding place.
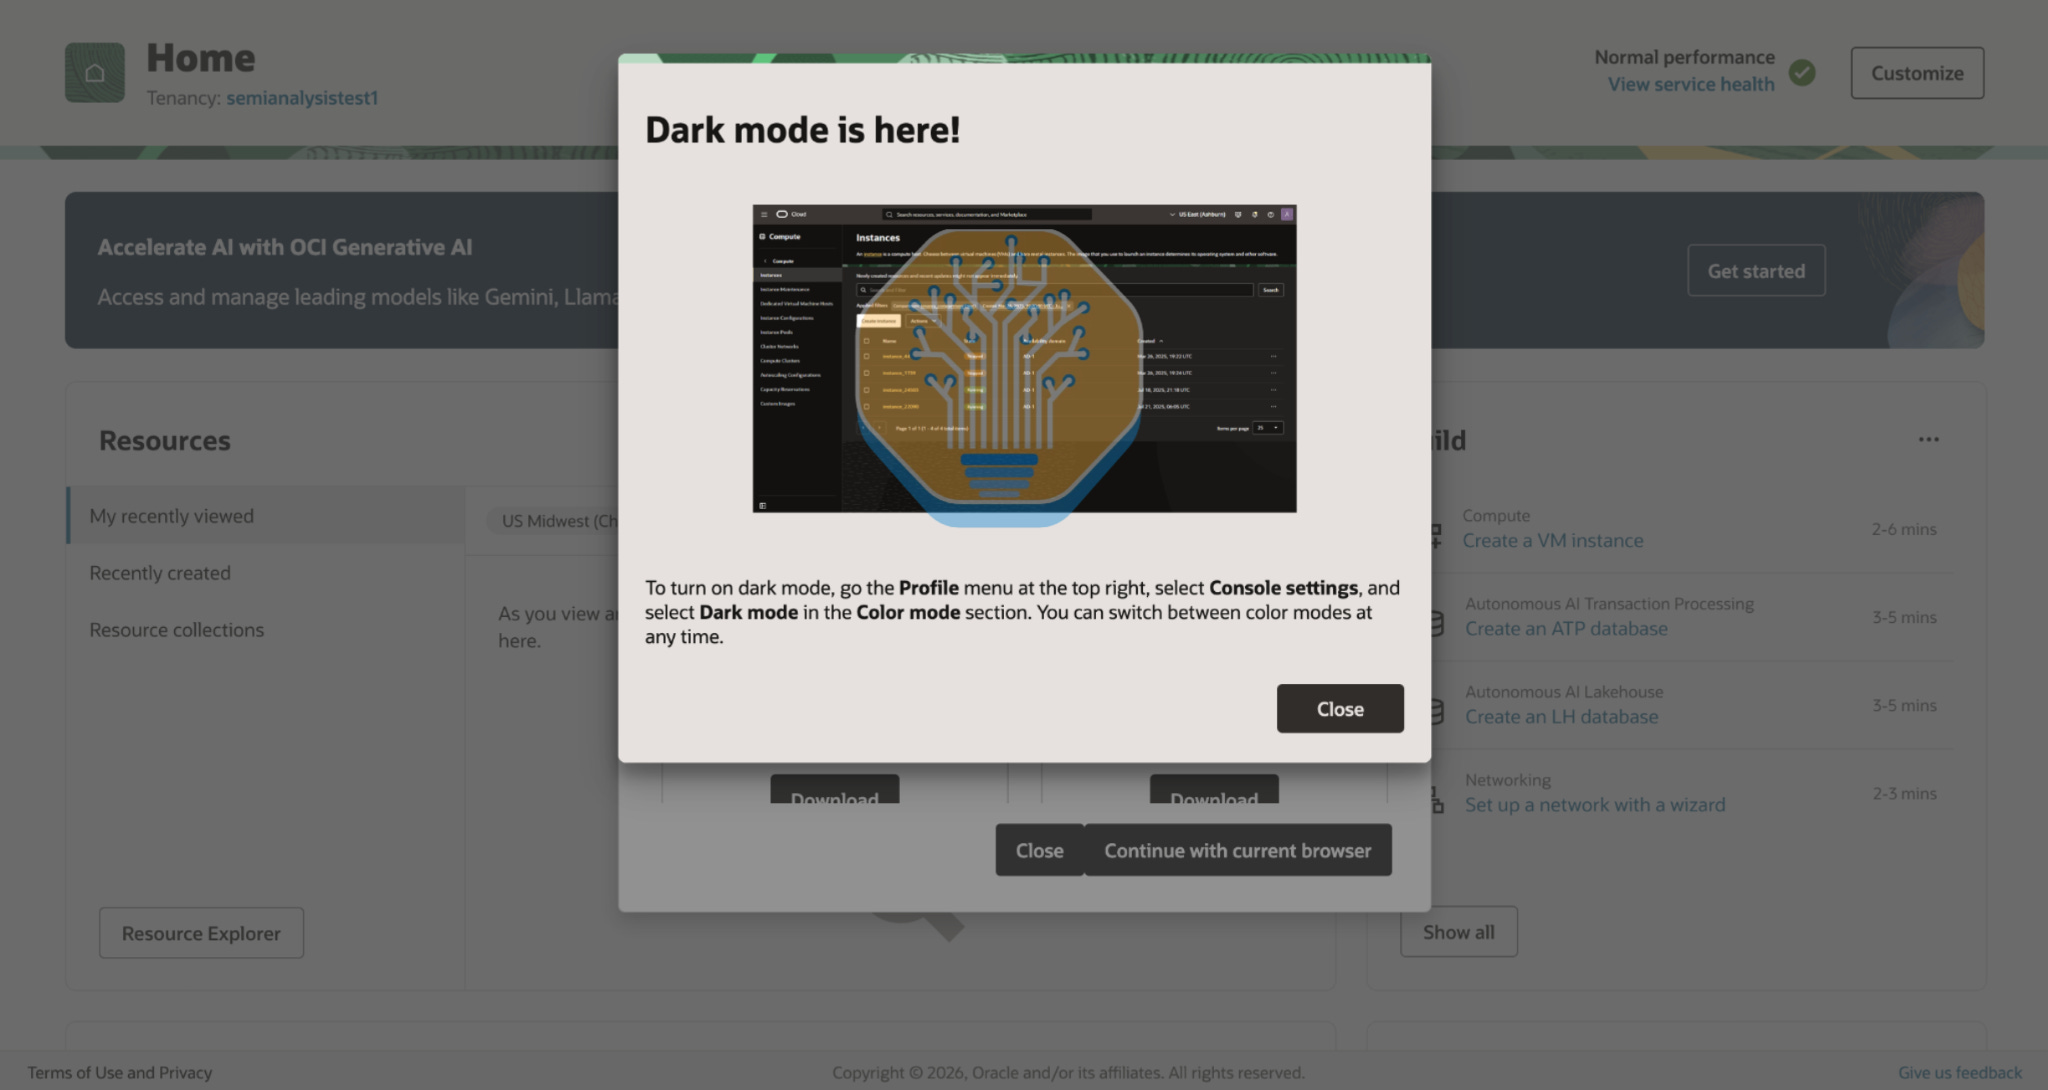
Importantly, Oracle’s console did not support RBAC—nothing on the console is connected to SSH users—so all our SSH keys had to be managed on the machine. At one point, attempting to append to `authorized_keys`, our intern forgot a `-a` flag and removed all our previous keys. Classic user error, obviously, but this goes to show why we prefer to have a hardened path on a console. We’d rather not trust our interns—especially that one, no offense—to type the magic words on the command line when a mistake can lock us out of the cluster. Thankfully, Oracle’s engineers caught the mistake immediately and fixed it for us.
We hope they fix this and add enterprise grade RBAC.
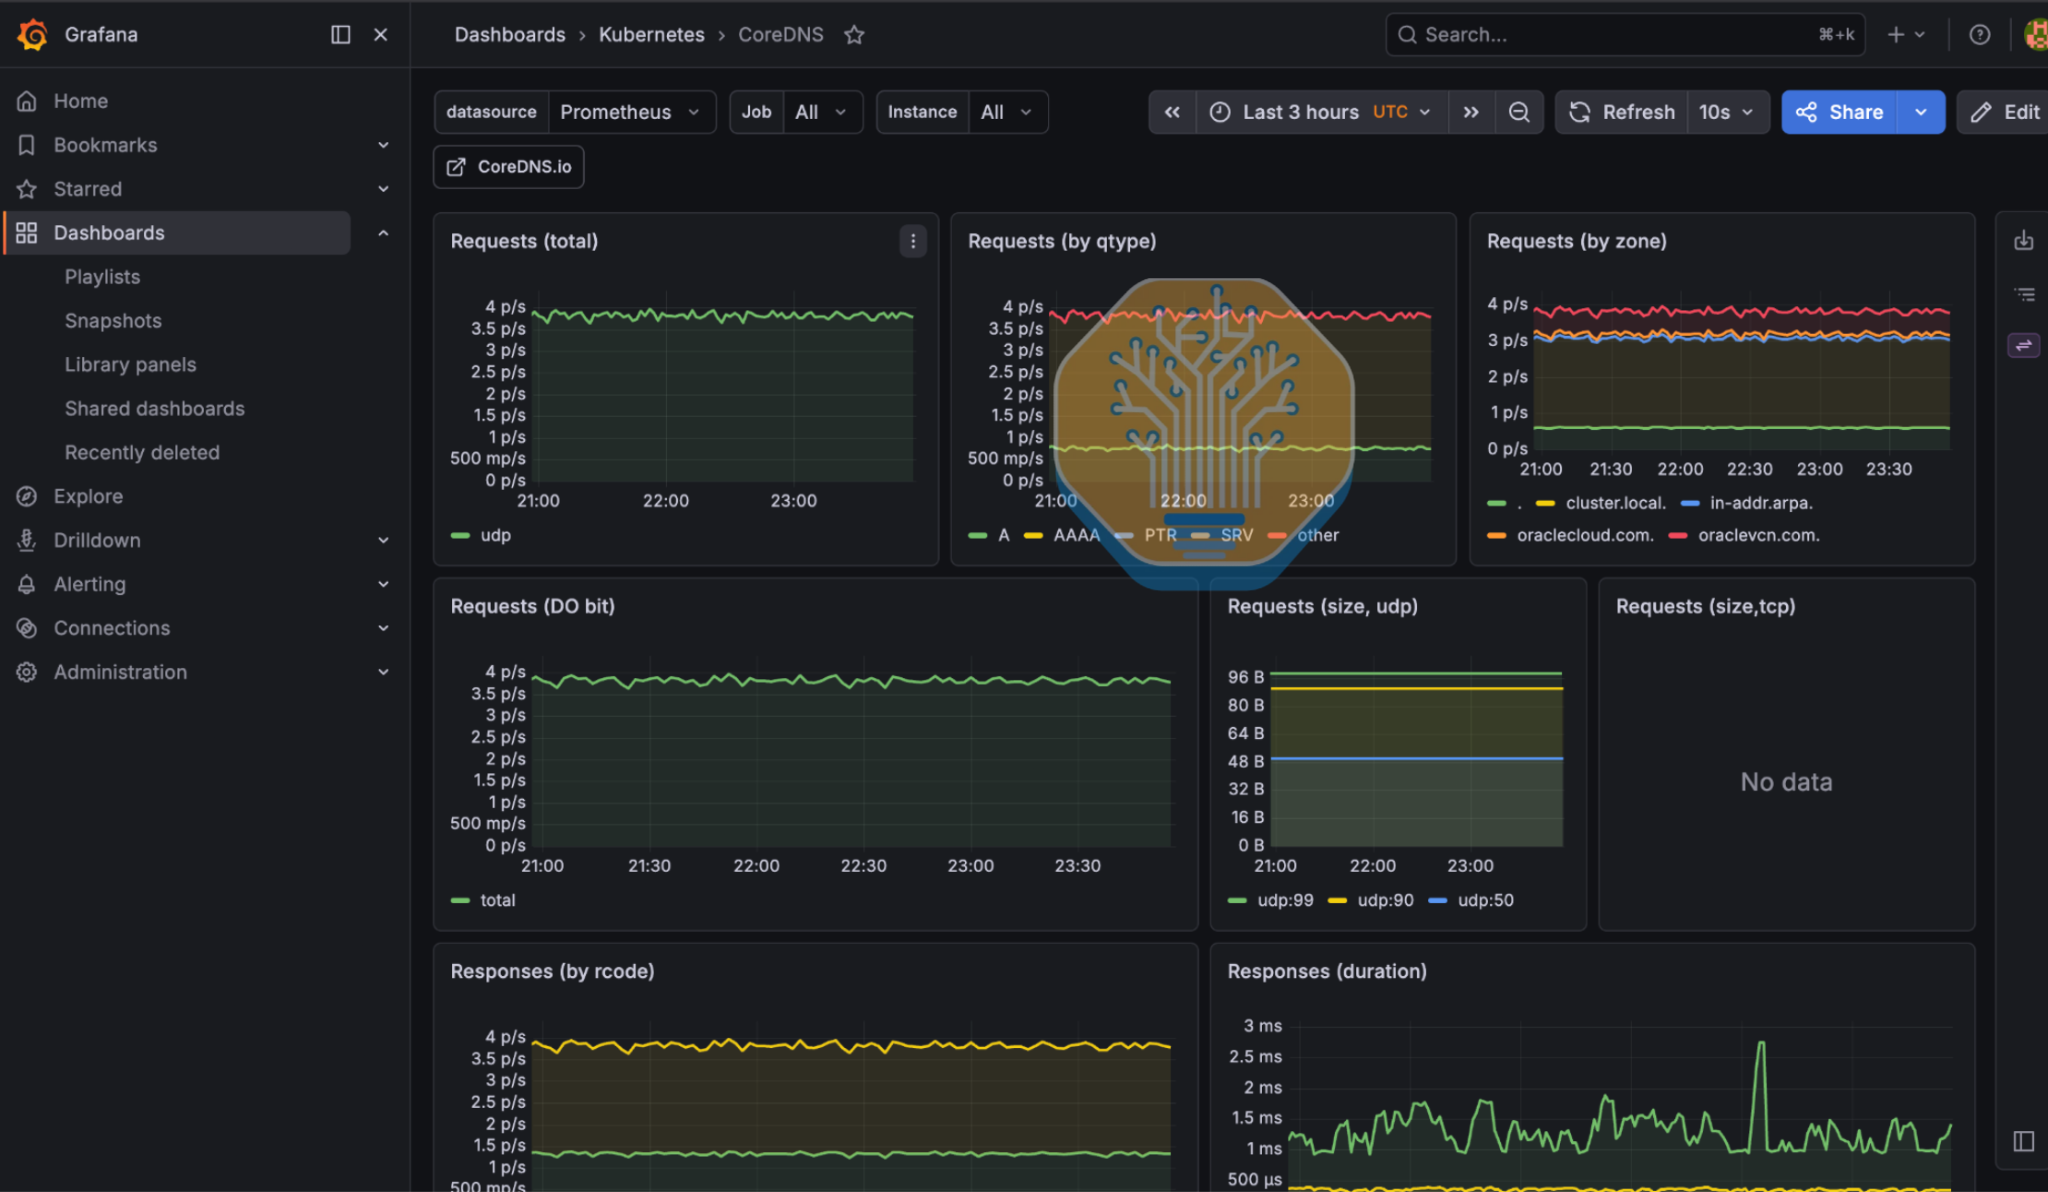
As expected, Oracle’s cluster performed well from day 1. They provided us with scripts for InfiniBand and NCCL tests, which was helpful because vanilla scripts do not properly use all 4 rails. Burn-in was flawless and Oracle’s managed Lustre saw strong throughput. Oracle’s health checks worked as intended, draining the node on our synthetic error but leaving up to the user to decide whether or not to terminate and replace the GB300 node. Oracle’s managed Prometheus and Grafana were good, though not perfect. For example, they are not integrated with the end user experience for job accounting. However, on the positive side, health metrics are now integrated into Cluster Manager in the console, making it easier to get a view of the crucial statuses at a glance.
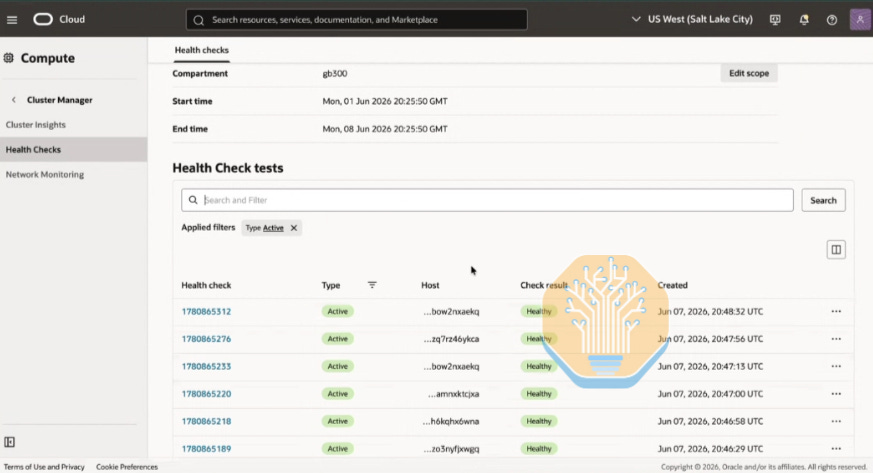
Next, we tested OKE with MI355X. This was the only provider other than TensorWave who let us test-drive AMD GPUs. The ride was rough.
As we complained about last time, at first, we needed to SSH into an operator node to steer Kubernetes. This time, the team quickly solved our Oracle CLI issues and we were promptly able to download our credentials locally. By far the greater problem on this cluster, though, was with the NICs. Peak performance was near line rate, so there was no issue with the hardware that we could detect. Rather, the issue was with the ionic drivers. Our per-rail `ib_write`/`ib_read` sweep across all eight NICs hit 391 Gb/s on every rail, then wedged the node the moment it finished: when the pods were deleted, the perftest processes never completed their `rdma_cm` teardown, the forced `kill` timed out the NIC’s destroy-CQ command, and the RDMA admin queue on `ionic_0` and `ionic_4` went dead. Worse, both ports still showed `ACTIVE` at 400 Gb/s and the node stayed `Ready`. The passive checks did not check out the RDMA control path, and no active check had run in eight days. We found the issue by grepping `dmesg` after RCCL kept failing. Oracle diagnosed it quickly on a weekend and rebooted: their own `ibwrite` health check had failed on this cluster in the same way days before. After a call where we explained the pathological workloads, they spoke with AMD and pushed different drivers and firmware to the cluster, which solved the problem.
Separately, we had a GPU intermittently dropping off the PCIe bus, neither caught by the health check nor properly surfaced in the dashboard. Oracle promptly swapped out the node and responded to our feedback on the dashboard.
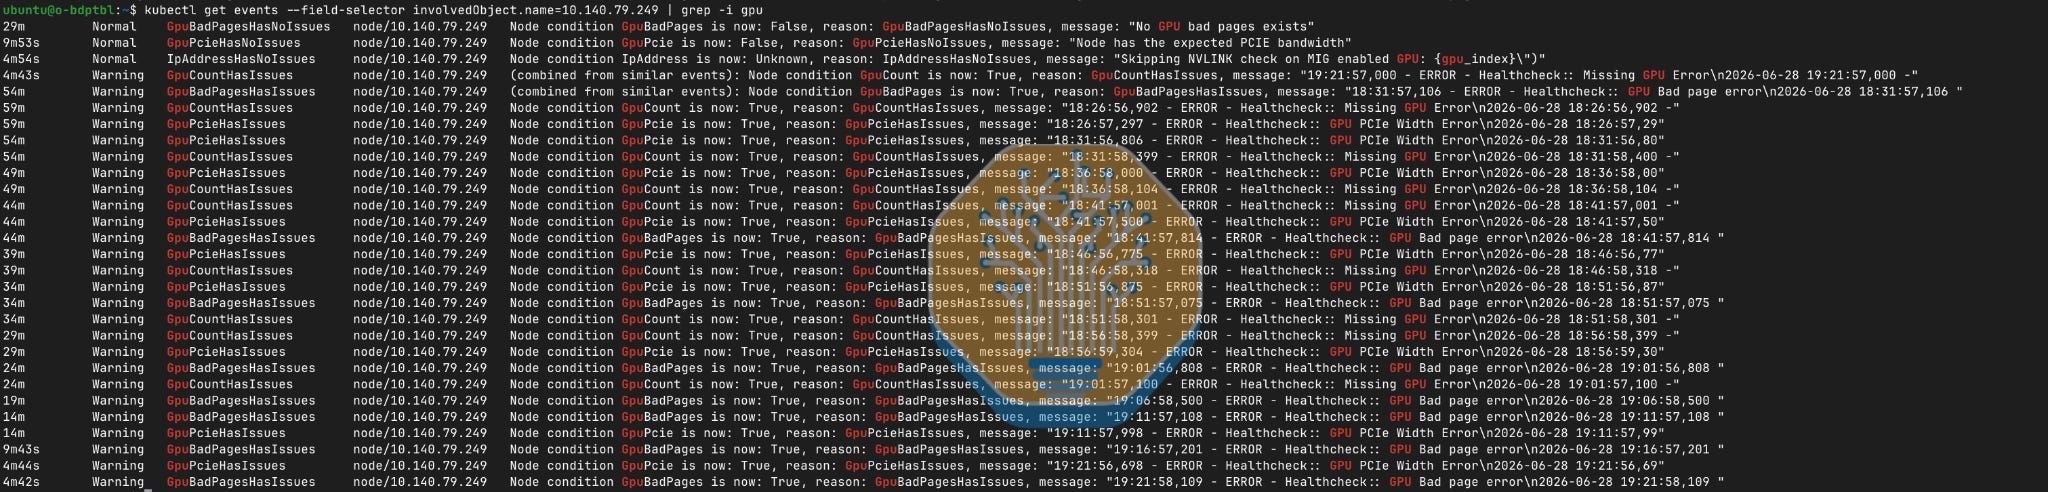
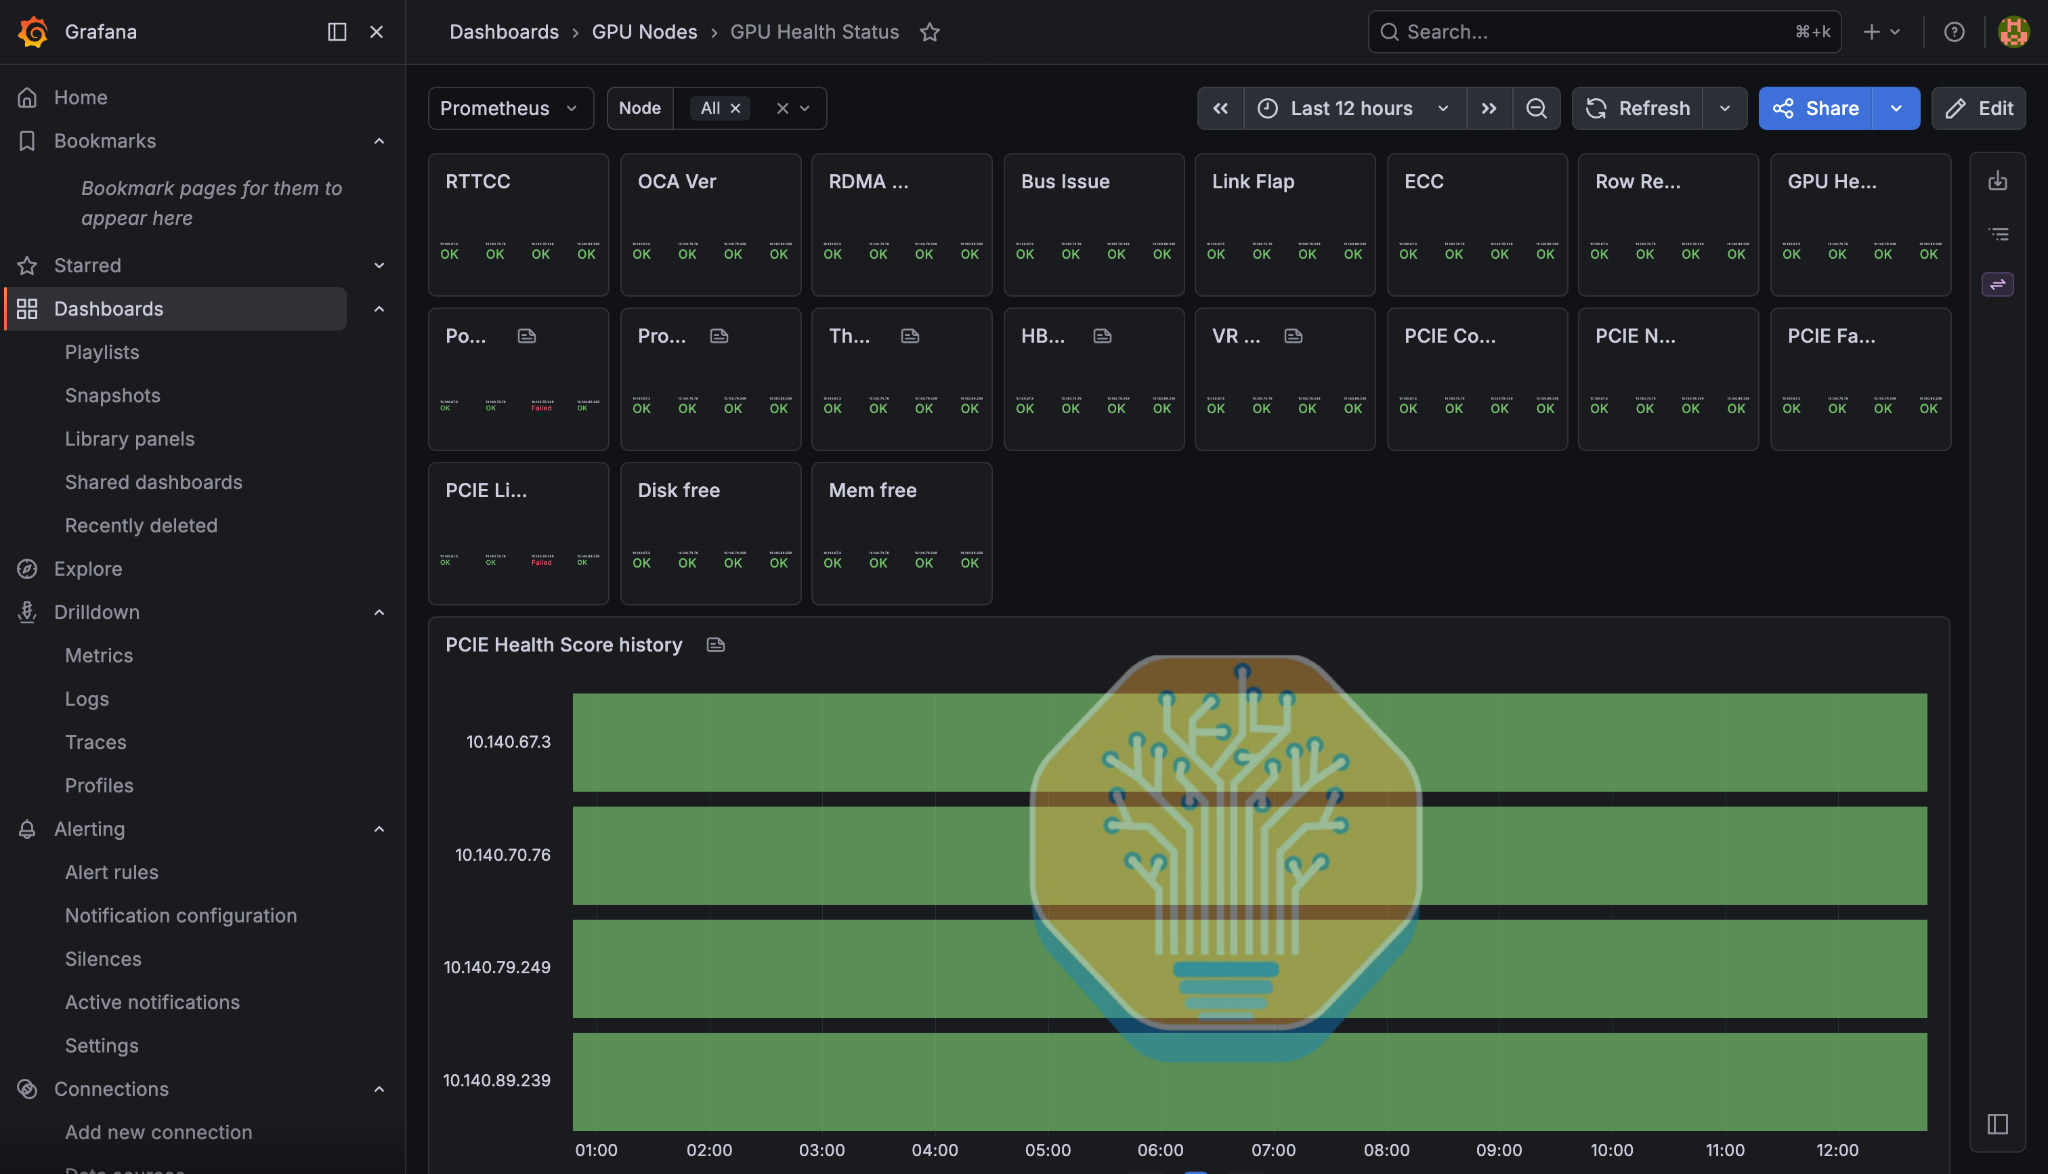
This was a mixed episode, but Oracle’s responsiveness was good. It’s especially undesirable that no health checks alerted, even though these drivers are known to be flaky. Still, Oracle’s close relationship with AMD is clearly an asset. They were able to speak to the relevant teams, diagnose the issue, and put a patch in place quickly. This type of support is not guaranteed at organizations of Oracle’s scale. Interestingly, Oracle is also the only provider ranked Silver or above, and one of two ranked Bronze or above, with zero installed libraries with applicable CVEs. This is more of an expectation than a benefit for us, but it was a clear demonstration that their automation works for deploying and upgrading clusters.
If we were a neolab, we would come away from this testing experience with confidence in working with Oracle. Yet this is a moot point given Oracle’s increasing commitment to bare metal deployments for frontier labs such as OpenAI in Project Stargate. Success in that business depends more on getting government approval for gas pipeline construction than it does on RCCL tests.
Still, Oracle has made progress since last we tested them, and the experience is very good overall. We look forward to continuing to keep tabs on them going forward.
Silver
Lambda
Lambda was most recently in the news for participating in a $35B Anthropic deal for 350 MW in Nueces County, alongside Hut8 and Nvidia. Before that, they were rumored to be preparing for a 2027 IPO, and they separately raised $1B, $926M, and $1B in debt for their buildouts. Amidst all their growth, after judging them Silver in ClusterMAX 2.0, we were interested in evaluating Lambda’s clusters this time around.
Onboarding began with a nice deck and PDF explaining what to expect on the cluster, and access was sorted out promptly.
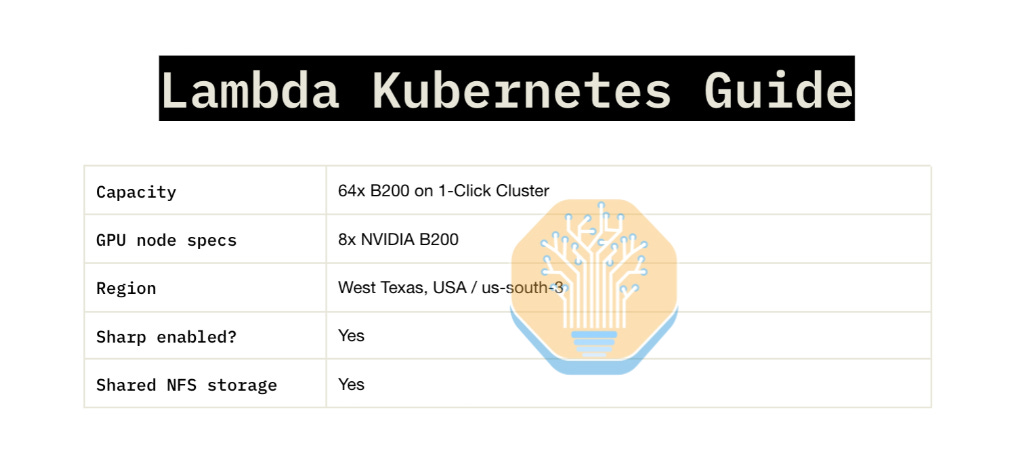
We criticized Lambda in ClusterMAX 2.0 for their reliability; this round of testing, it was one of Lambda’s points of emphasis. Their passive health checks cover the relevant conditions and ultimately autoremediated three errors we simulated during testing. Two synthetic XIDs were autoremediated in less than 15 minutes, and there were connected dashboards to monitor node health. Our test that triggered a genuine XID 79 by resetting the PCIe secondary bus reset brought the node into `NotReady` with no `GpuXid`, no cordon, and no monitoring visibility on the Kubernetes layer, but it ultimately rejoined the fleet after 2 hours. Our node-reboot tests on the Kubernetes layer also completed without incident.
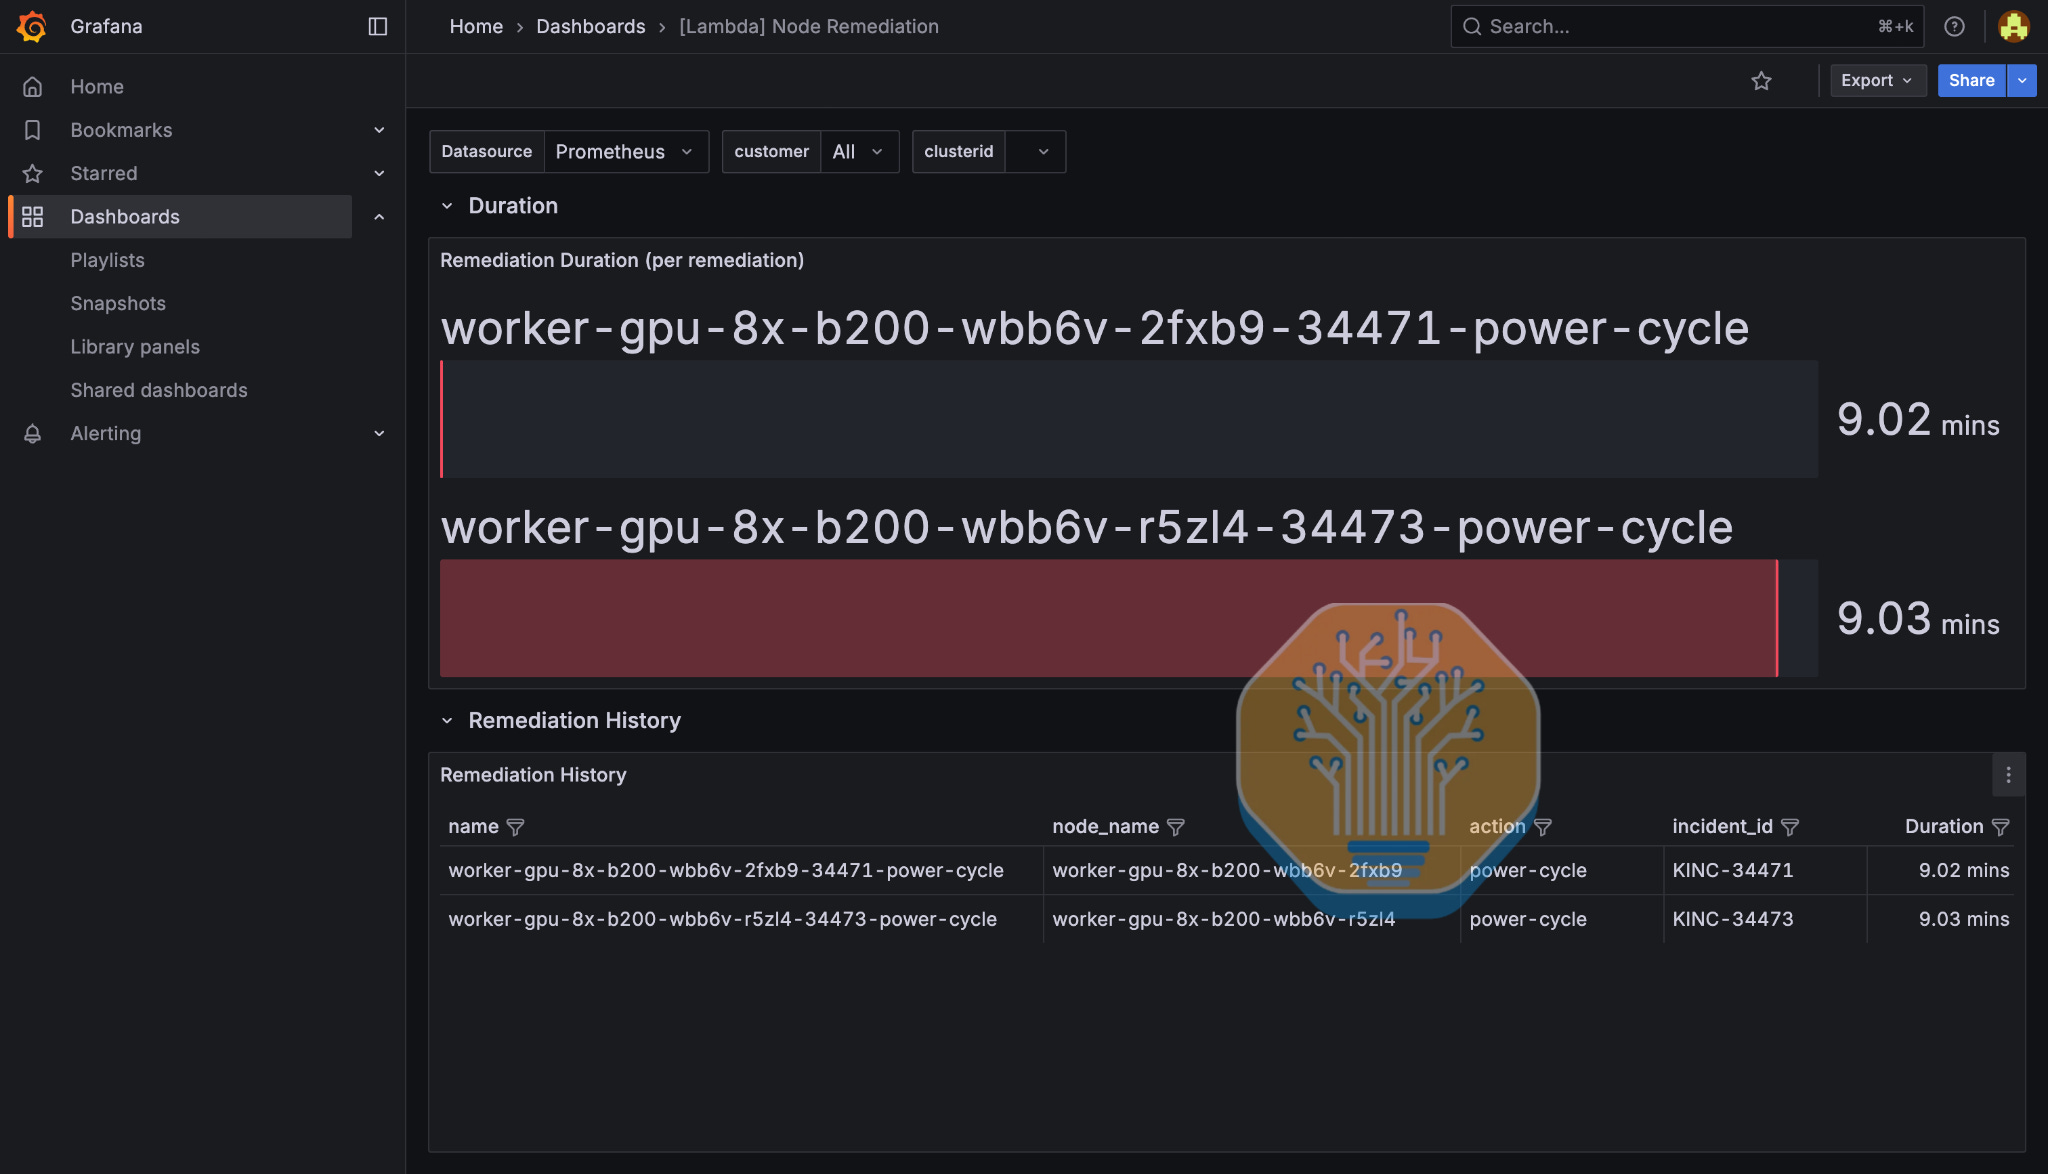
The orchestration layer has improved significantly, though it still has a handful of issues. Slurm configuration left CPUs per task unset, so Slurm’s default allocation gave one logical core unless the launch requested more. Passwordless sudo is not enabled on Slurm, as we are using managed slurm rather than unmanaged Slurm. Lambda is the only provider we’ve encountered that makes this distinction, but clearly some of their customers want root access to their own cluster, while others do not (?). We enjoy having root on our own cluster.
Also missing was SSH to the compute nodes without an allocation. This creates a headache during debugging if someone else is running a job and you can’t attach to their allocation, or a job is stuck. Another reason why we enjoy “yolo mode” on our clusters.
More importantly, Slurm had software out of date, including CUDA Toolkit 12.0 at the default location /usr/bin/nvcc (which is so old it’s incompatible with the B300 SM100 architecture), and unacceptably old drivers. On the bright side, Slurm did have topology settings configured, and the NCCL recipes that they gave us worked well. We had no authentic errors during testing, and all our tests, including burn-ins and storage, showed good performance.
Our preoccupation with Lambda’s 1-Click Clusters seems quaint in today’s world of capacity reservations backlogged for months. Indeed, as mentioned in the opening, Lambda is increasingly driving its bottom line via bare-metal builds, apart from managed clusters altogether. Regardless, Lambda’s orchestration continues to improve, and customers are happy, which lands them in the upper ranks of ClusterMAX 3.0.
Microsoft
Using Azure clusters can be very difficult due to the Microsoft bureaucracy. Their engineers do the best they can, but this is not an organization set up to be flexible in accommodating its customers. Microsoft customers do not come first in matters of taste.
During testing, we were not allowed to have our own Azure accounts, so we had to use the cluster under the user of one of Azure’s engineers, which prevented us from poking around the console and experiencing the authentic onboarding experience. Our GPUs were set to be in Virginia, but thanks to some obscure internal decree, we were not allowed to have a control plane there. Instead, our control plane ran in San Antonio, Texas. Access required setting up a VPN, which worked after a bit (see: literally 3 weeks) of back and forth. Pasting was disabled on the bastion, so to run our tests, we had to manually type in our GitHub and HuggingFace tokens. Like, literally type them in one character at a time. We got them right first try though, nbd 😮💨.
Once everything finally ran, we found a handful of packages out of date, and bad default NCCL configs kept our first run from going through. On AKS, the `managed-csi-premium-v2` `StorageClass` could not attach, and we got `EAGAIN` trying to run `fio` at anything more than 4 clients on Azure Files Premium. No parallel system attached to our Slurm cluster meant that one of our tests, which loaded DeepSeek-V4 from NFS, timed out.
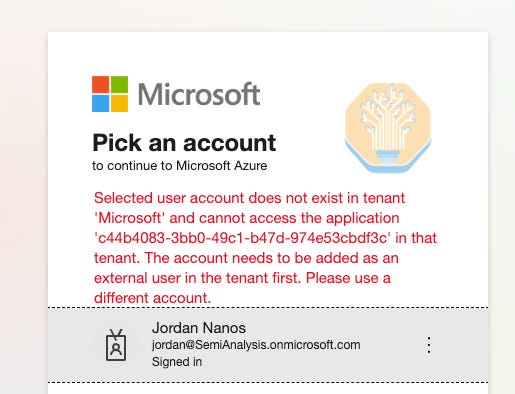
When we went to run burn-in, we had a genuine failure on 10 nodes of our Slurm rack, killing our job. Microsoft caught the errors, traced them back to an unhealthy host, and opened up a Guest Health Report for repair. An `scontrol` resume command brought them back, and after that, both our Kubernetes and Slurm racks completed their burn-in without error.
CycleCloud drained the node immediately after we tested Azure’s health checks by injecting a synthetic XID, but it did not resume or replace it. Because we had the whole GB300 rack, this was satisfactory, as described in the “Blackwell and Grace Blackwell” section above.
Due to the account issue, we could not see our Kubernetes dash by default. Instead, Azure’s engineering team cooked up a custom dashboard setup for us, and it was extremely detailed—a solid triumph over the bureaucratic straitjacket. We want to shoutout our friend Xu Xue for this one, as we are quite certain that he went way above and beyond the call of duty to build this out for us, but wouldn’t admit it. His curated dashboard is open sourced here, a great resource for anyone building Grafana dashboards to monitor Nvidia GPU clusters from scratch.
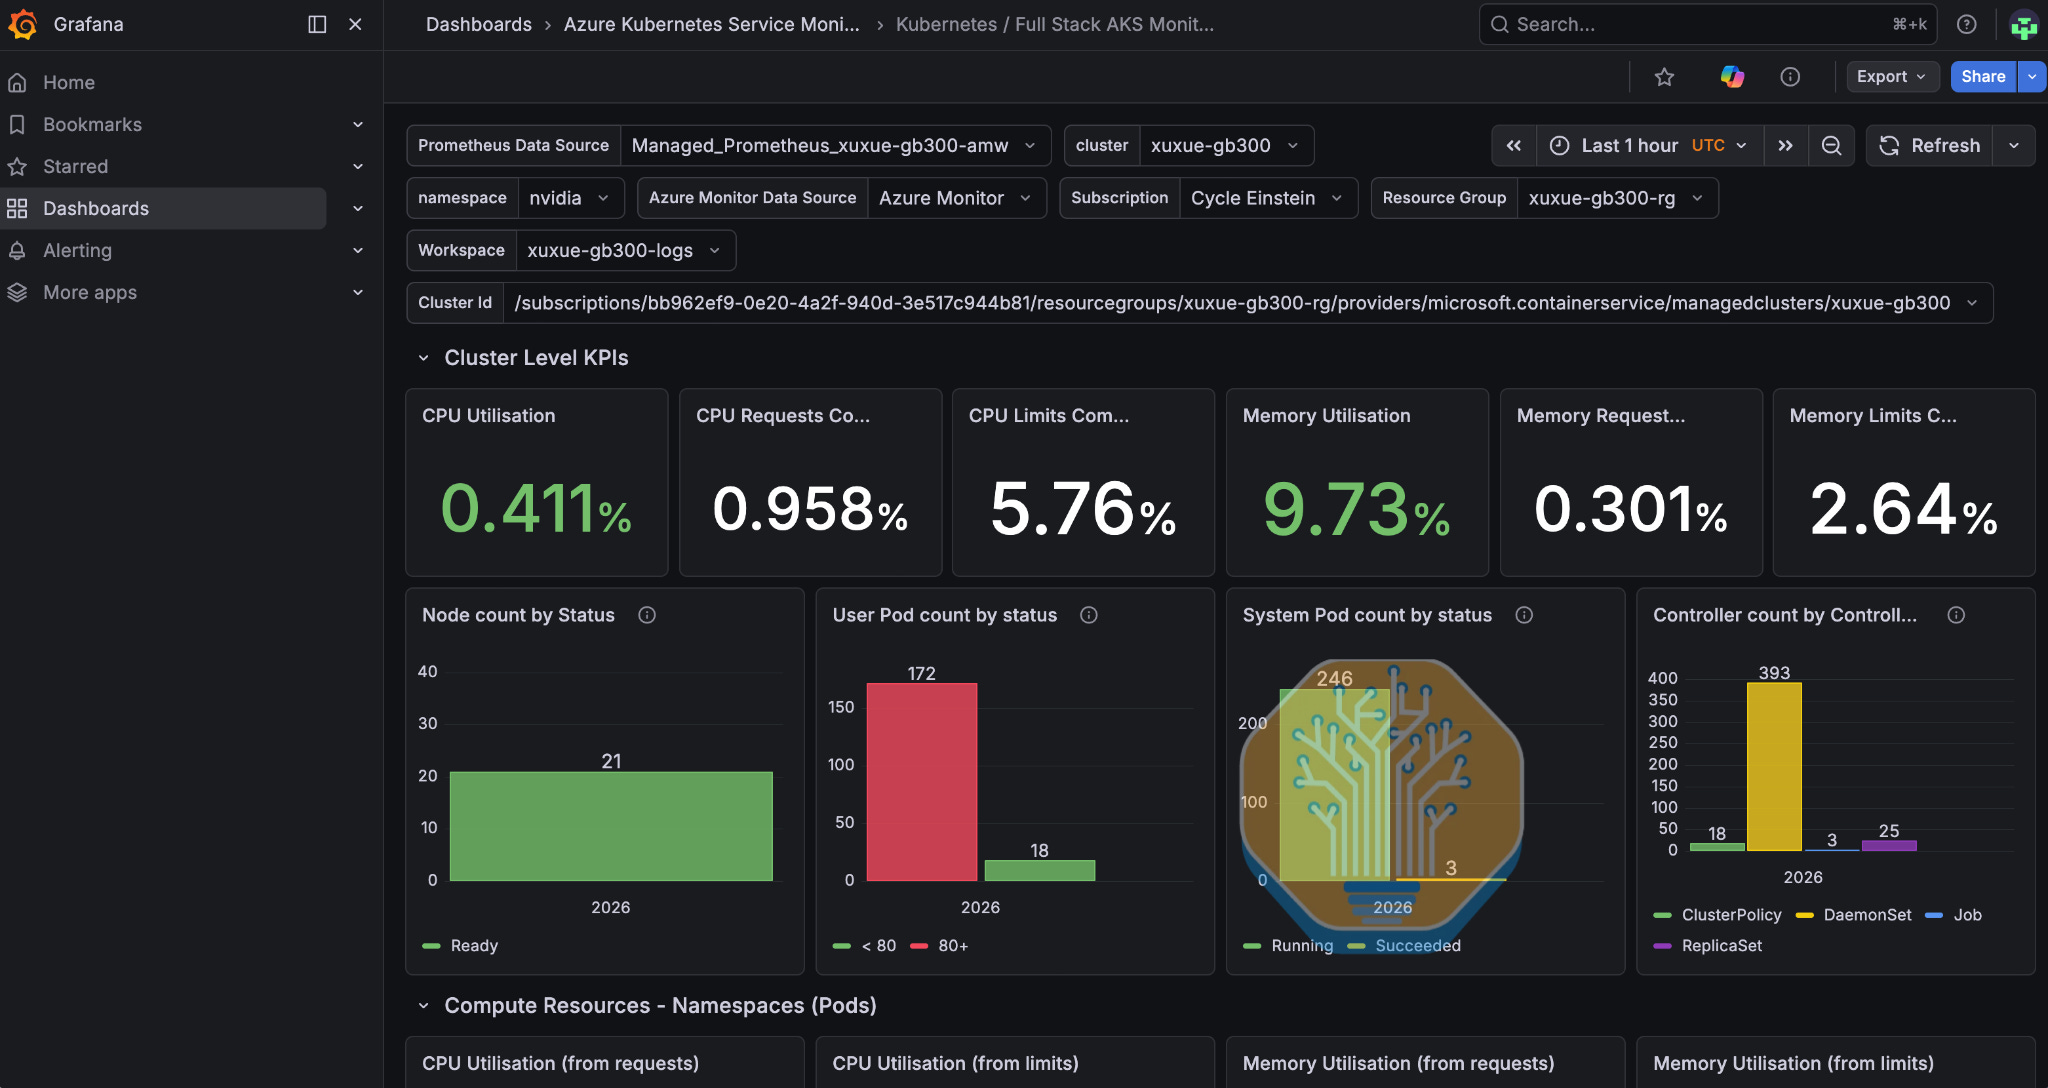
Satya once said “we want to build out Azure as being fantastic for the long tail of the workloads,” and that Microsoft is “not in the business of just doing five contracts with five customers being their bare-metal service.” Yet it is exceedingly rare to come across a VC-backed lab that uses Azure for training and inference. “Five customers for bare-metal service” is overstating it. Really, it’s two: OpenAI and MAI. Soon to be three, with Anthropic diversifying.
Azure’s most interesting asset is that it can serve OpenAI’s models and keep 100% of the revenue. They still have full access to all of OpenAI’s IP. Yet Azure can separately boast of large bare-metal deals with OpenAI, as well as an increasingly lucrative relationship with Anthropic. This is an incredibly strong position to be in. If only for the pause.
As Azure mostly competes on a different plane with enormous deployments and hundreds of billions of capex, its ability to manage clusters only makes it more flexible. Like Google and Oracle, Azure gets its cashflow from offtakers who need no help setting up a `ComputeDomain`. But based on the quality of testing, these three could still cut smaller, higher-margin deals with labs who want a higher-touch experience.
This does not seem likely to happen any time soon, though. Support and the console is a headache, even if Azure is the only hyperscaler where you can possibly get the Nvidia Reference Architecture on your scale-out networking. As much as anything, we like to verify that these hyperscalers are light on their feet.
Firmus
One of Nvidia’s favorite up-and-comers, and our favorite in Asia-Pacific, Firmus announced in August a $2B funding round at $10.5B post-money for expansion throughout Australia, Malaysia, and Indonesia, following a $505M round at $5.5B just 4 months before. Firmus also raised a $10B debt facility in March for its Project Southgate buildout in Melbourne and Tasmania. Just last week, it disclosed 900 MW in total contracted capacity and announced OpenAI as an anchor tenant in its Malaysian expansions. All in all, Firmus has disclosed 18,400 GB300 GPUs in the deployment process today and 36,800 later this year in Tasmania, with multiple GWs and tens of thousands of VR in the pipeline.
We had a rough takeoff but a fairly soft landing while testing one of Firmus’s dev clusters. Accessing our chips required using a Microsoft Entra account, Microsoft SSO, then downloading and configuring a custom pre-release version of the vCluster CLI. We’re suckers for new tech, but where cluster access is concerned, we’d much rather just SSH. After a few rounds of back and forth, with the help of Firmus’s team, we were on.

…on the cluster, but not quite off and running. The default setups on both Kubernetes and Slinky left a lot to be desired. Slurm login had no `sudo`, no `vim` or `nano`, HPC-X installed but not on `PATH`, and no NVCC. More importantly, instead of receiving 4 Slurm nodes on one rack and 4 Kubernetes on another, we had 2 of each on each. This was not necessarily a problem, but Kubernetes had `nvidia.com/gpu.clique` configured with nothing consuming it, while Slurm used `topology/flat`. Thus, the nodes visible to each orchestrator spanned multiple racks, and there was nothing to avoid a multinode job needlessly crossing the rack boundary. We had to infer node nomenclature to make sure our tests were well placed.
On top of this, the Kubernetes control plane’s `etcd` visibility flickered several times during testing. which killed our jobs and caused both the Slurm and Kubernetes layers to restart. This was ultimately attributed to an issue upgrading switch firmware and did not recur for the last 10 days. We also lost a NIC to a wedge during reboot, which was not caught by Firmus’s health checks as they were not active on the dev cluster we tested. Firmus was the only GB300 cluster we had that exposed GPU HBM as NUMA nodes, an interesting configuration that we mark as a failure because it lets you accidentally swamp device HBM if you overflow on the host. WAN was inconsistent but often quite poor, maintaining 0.25 Gb/s to NGC. The last of our problems was that one of the racks saw significantly degraded performance on its NVLink fabric, which was explained by a power setting that Firmus had been experimenting with on their dev cluster; fixing this brought our numbers into the healthy range.
Thus, by the time testing ended, we had satisfactory though underfurnished Slinky and Kubernetes layers, we knew how to access them, and we could get strong performance across our test suite. We understand that managed clusters are not Firmus’s priority right now, but we believe there is plenty of low-hanging fruit here for their technical team. As Firmus works to bring enormous capacity online, we look forward to seeing them continue to make life easier for users of their GPU software stack.
TensorWave
TensorWave is an AMD-only neocloud whose MI355X offering we tested via K8s and Slinky. In the last writeup, we emphasized the difficulty of TensorWave’s onboarding process, which required back and forth just to get on the cluster and had a large number speedbumps even still. The improvement this time round is significant. Onboarding was smooth, the `kubeconfig` sent directly to us worked perfectly, the console allowed us easily to add team members with SSH access, and the TensorWave support team was attentive throughout our testing.
Being an AMD-only cloud, TensorWave is fighting an uphill battle dealing with AMD’s software stack, which, despite significant recent progress, still lies well behind Nvidia’s. We saw this on our TensorWave cluster on RCCL microbenchmarks, with all-gather and all-to-all hanging at 32 KiB even using TensorWave’s binaries and recipes. Other collectives showed uneven scaling and poor throughput at certain message sizes. [Editorial comment: RCCL? More like Rick L!] In general, it can be said that the AMD networking stack lacks the community support that Nvidia tooling offers. The same goes, of course, on the hardware side. More important than microbenchmarks, we see in practice that the GB300 NVL72 systems have the most demand across the industry from labs: their performance is so superior that, even accounting for their higher prices, they often offer the best perf per dollar as well. AMD’s rackscale answer, the MI455X Helios, is still ramping up production, and is certainly not yet on offer by TensorWave. Thus, TensorWave’s place in the rankings depends not only on its internal improvements, but on AMD’s ongoing work to close the gap relative to Nvidia.
For what it advertised, our TensorWave cluster was good across the board. North-south bandwidth was strong. Storage performance was exceptional and burn-ins completed without a problem. When we pushed around the Kubernetes layer, its reliability was good, and the Slinky layer was easy to use.
The health check immediately recognized the error that we simulated, bringing the node into `drng`.

The dashboard oddly marked the node as “Allocated,” rather than being broken out into its own category. However, shortly afterward, we were presented with a nice juicy button to click to approve replacing our “sick” node with a fresh one.
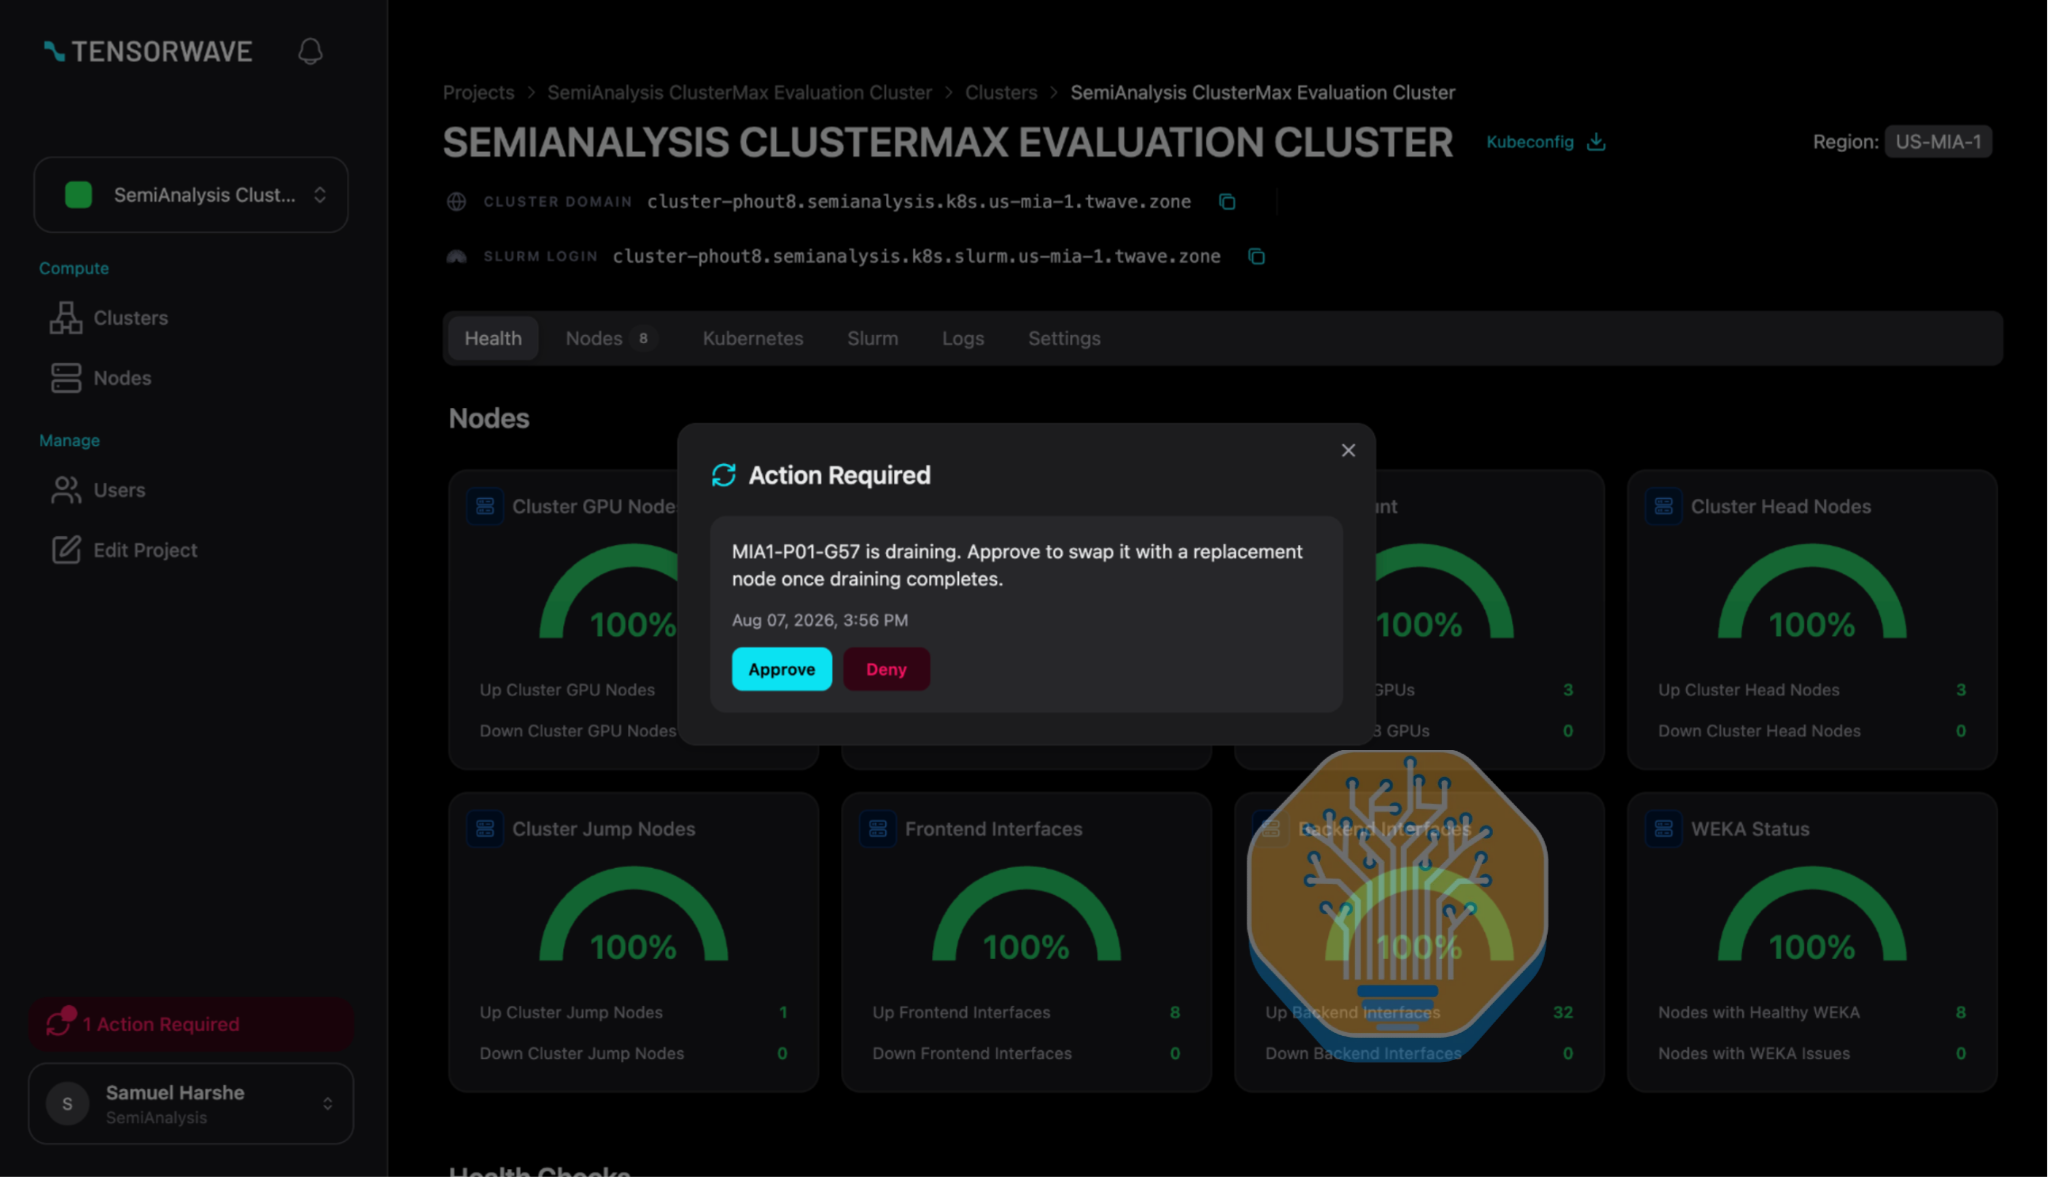
The replacement completed in approximately 43m. We would prefer that the autoremediation occur by default—we’d rather not even have to click a nice juicy button—but otherwise consider TensorWave’s monitoring and autoremediation exemplary.
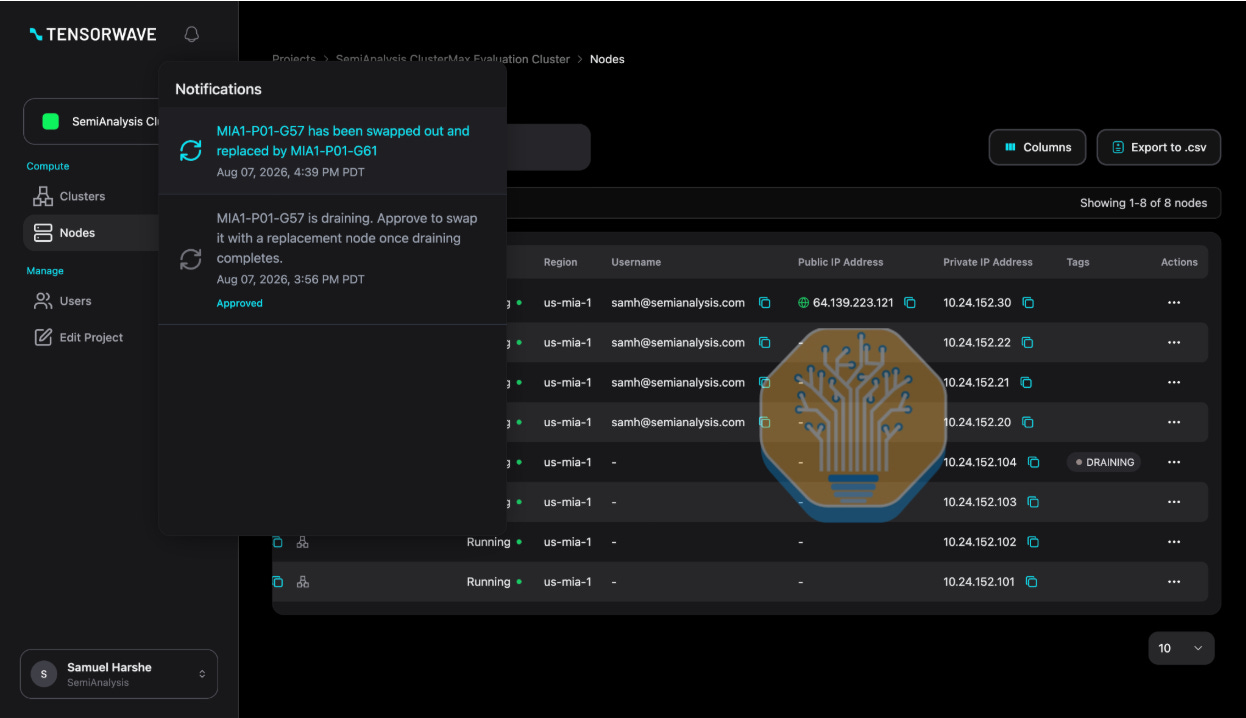
Overall, TensorWave is the leading AMD-exclusive neocloud, providing a comparable (and sometimes better) experience on AMD GPUs than hyperscalers like Oracle and Microsoft. And they are not stopping. TensorWave has entered into an agreement with Fermi for 222 MW in the Texas panhandle with expansion rights up to 650 MW, contingent upon Fermi securing project financing. It has a tailwind with a $350M June Series B, leaving it at $1.55B post-money, and is currently working on large deals with hyperscalers. With both OpenAI and Anthropic announcing strategic partnerships with AMD for the MI450 generation, we expect that TensorWave is set to benefit, and AMD-exclusive neoclouds may be able to break into the Gold tier. We look forward to testing TensorWave’s MI455X Helios once it is available.
GMI
GMI is a neocloud headquartered in Mountain View with roots in Taiwan. With a $500M Nvidia deal announced last November and $12B more this March, hundreds of GB300 racks in the pipeline, and plans for VR down the line, they are keeping on the frontier in terms of hardware. Recently, they have also been growing their fleet by making deals with smaller neoclouds and reselling the compute to their established customer base, which offers an attractive cashflow profile because it does not require up-front capital outlay. After judging them the “top Bronze neocloud” in ClusterMAX 2.0, we were interested to test the progress of their managed clusters.
Onboarding was a bit bumpy, including an empty Kubeconfig downloaded from the console and an SSH key that we uploaded but was never synced to the cluster. After some back and forth with the team, we got in. The problem, it turned out, was that the console was view-only for our testing purposes, so we could not verify its functioning. Last round, we did not get access to a self-service console at all, so we count this as progress.
As last time, the compute was up to spec, burn-in was clean, and the InfiniBand fabric was sturdy. One notable improvement since ClusterMAX 2.0 was in GMI’s storage. GMI provided a performant RWX NFS default StorageClass, which was also available on the Slurm layer at `/home`. We had difficulty trying GMI’s S3, which turned out to be due to a typo in their doc. But once the Brothers Karamazov Karasev hopped on a call and fixed it, we verified that the object storage perf was also good. The biggest blocker in terms of cluster configuration was that GMI expected the IMEX domain to be configured on the Kubernetes cluster by a ComputeDomain CRD. This is perfectly viable—many other highly rated providers do the same thing—but GMI’s Kueue would not tolerate the claim, so our jobs sat in `Suspended`. To work around, we had to submit our jobs in a namespace with no `LocalQueue` named `default`. We recommend that GMI document that MNNVL jobs need to skip the queue, or, much better, that GMI set up its Kueue to tolerate DRA resource claims.
GMI’s dashboards, which did not exist last time we tested, were useful, including hardware information from DCGM and NVLink and InfiniBand monitoring.
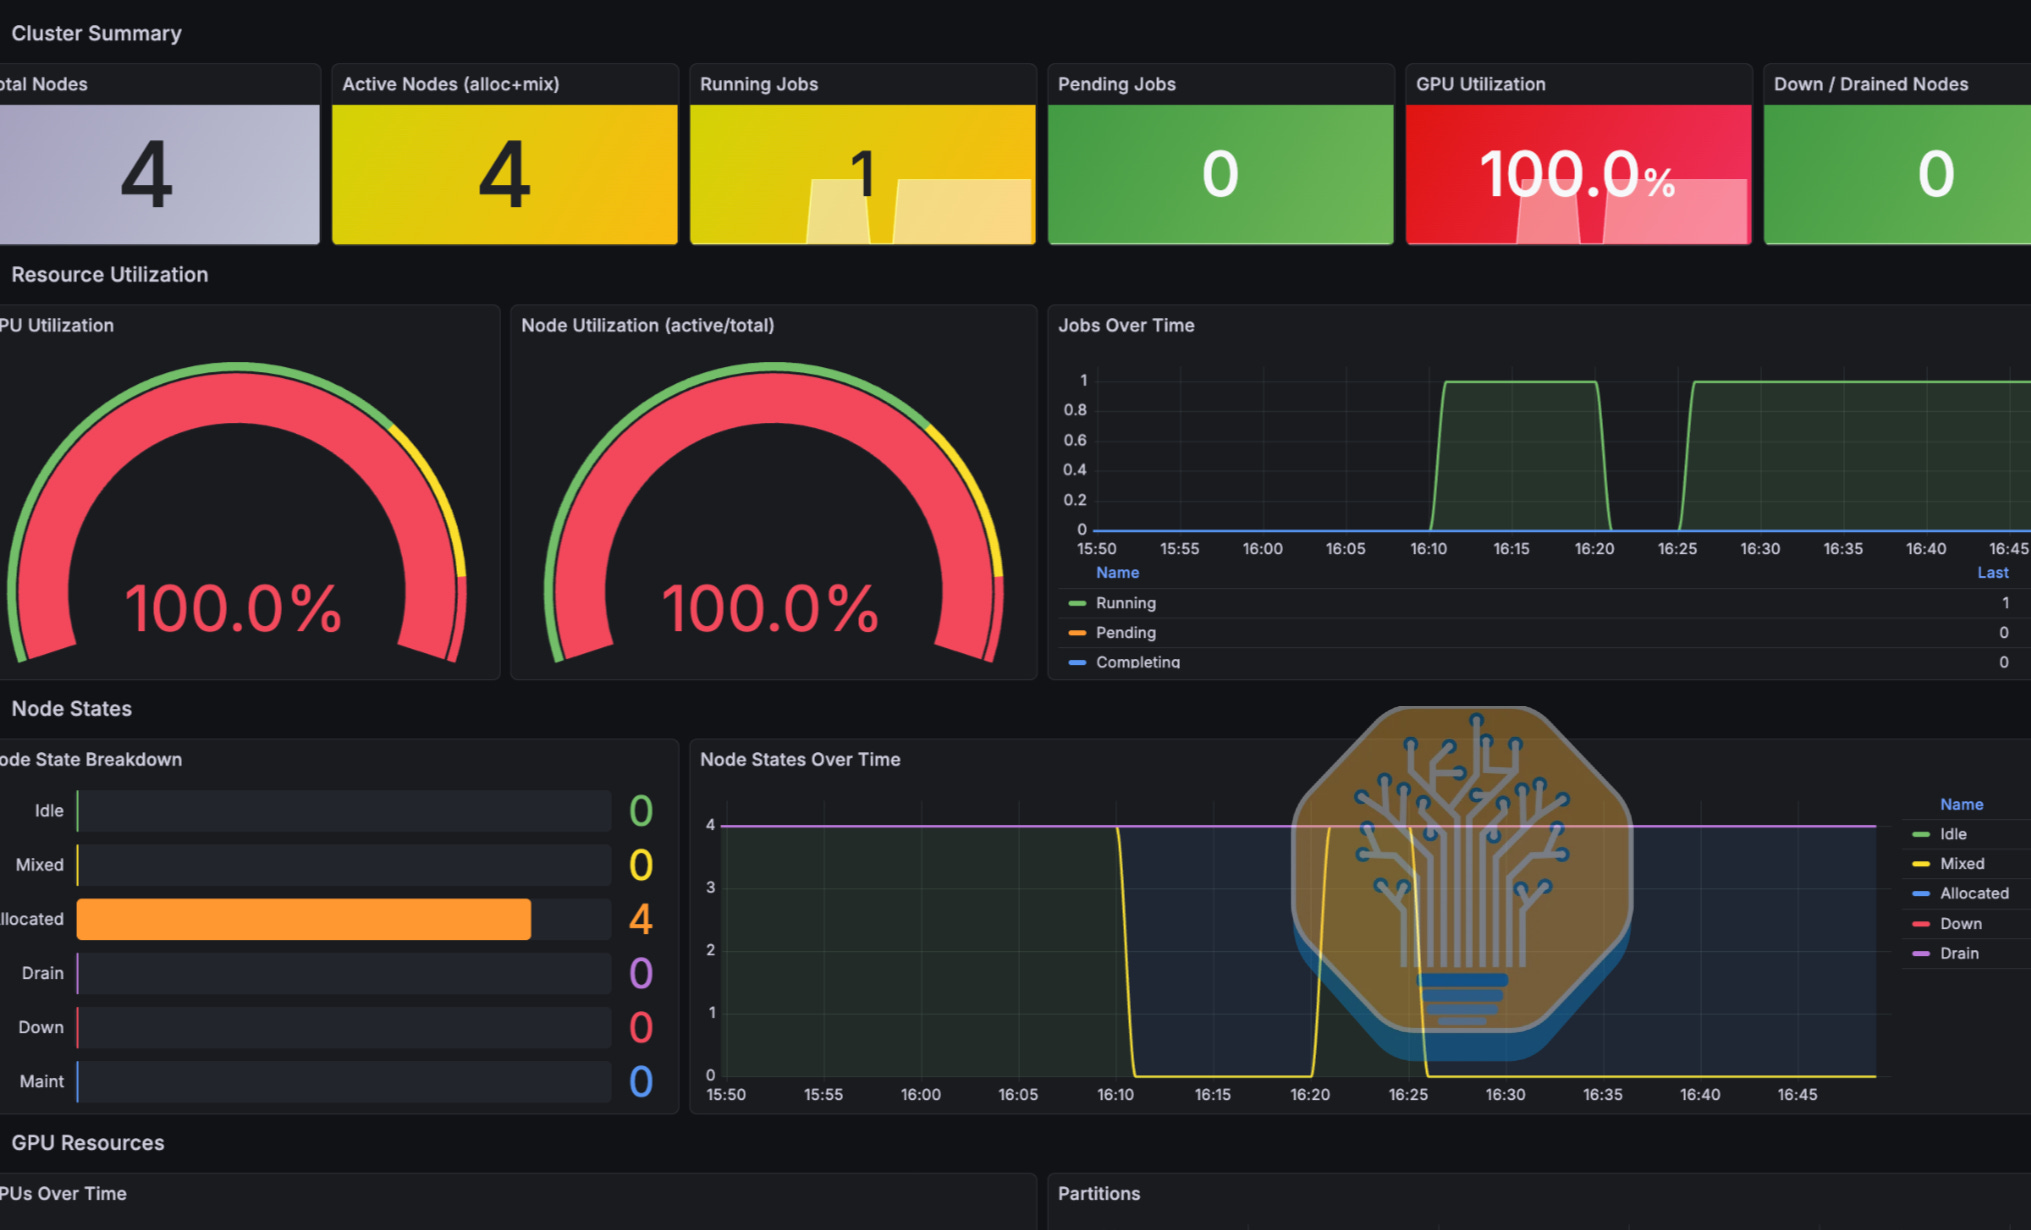
We could not get the full GMI health-check experience due to a lack of spare capacity, but what we could test performed well. Nodes were quickly cordoned at the Kubernetes layer, then rebooted and auto-uncordoned. The Slurm layer also brought a node into `DRAIN` soon after a synthetic error was injected. GMI had alerts set up in Slack, so we could see their system detecting the error and thread to discuss next steps with support, which was convenient.
Our GMI experience was solid in every crucial way, and we look forward to continuing to test them as their capacity ramps quickly.
Bronze
Amazon Web Services (AWS)
Our last report summarized the AWS experience as a “headache.” This time around, we had to break out some Amazon Basic Care Ibuprofen Tablets, Fever Reducer and Pain Relief from Body Aches, Headache, Arthritis Pain and More, Brown 200 Count to get through our testing.
The difficulty with AWS begins before you get on the cluster—indeed, before you even try to provision the cluster: it begins when you contemplate AWS’s zoo of managed offerings. To get this all straight, we had to make a Venn diagram:
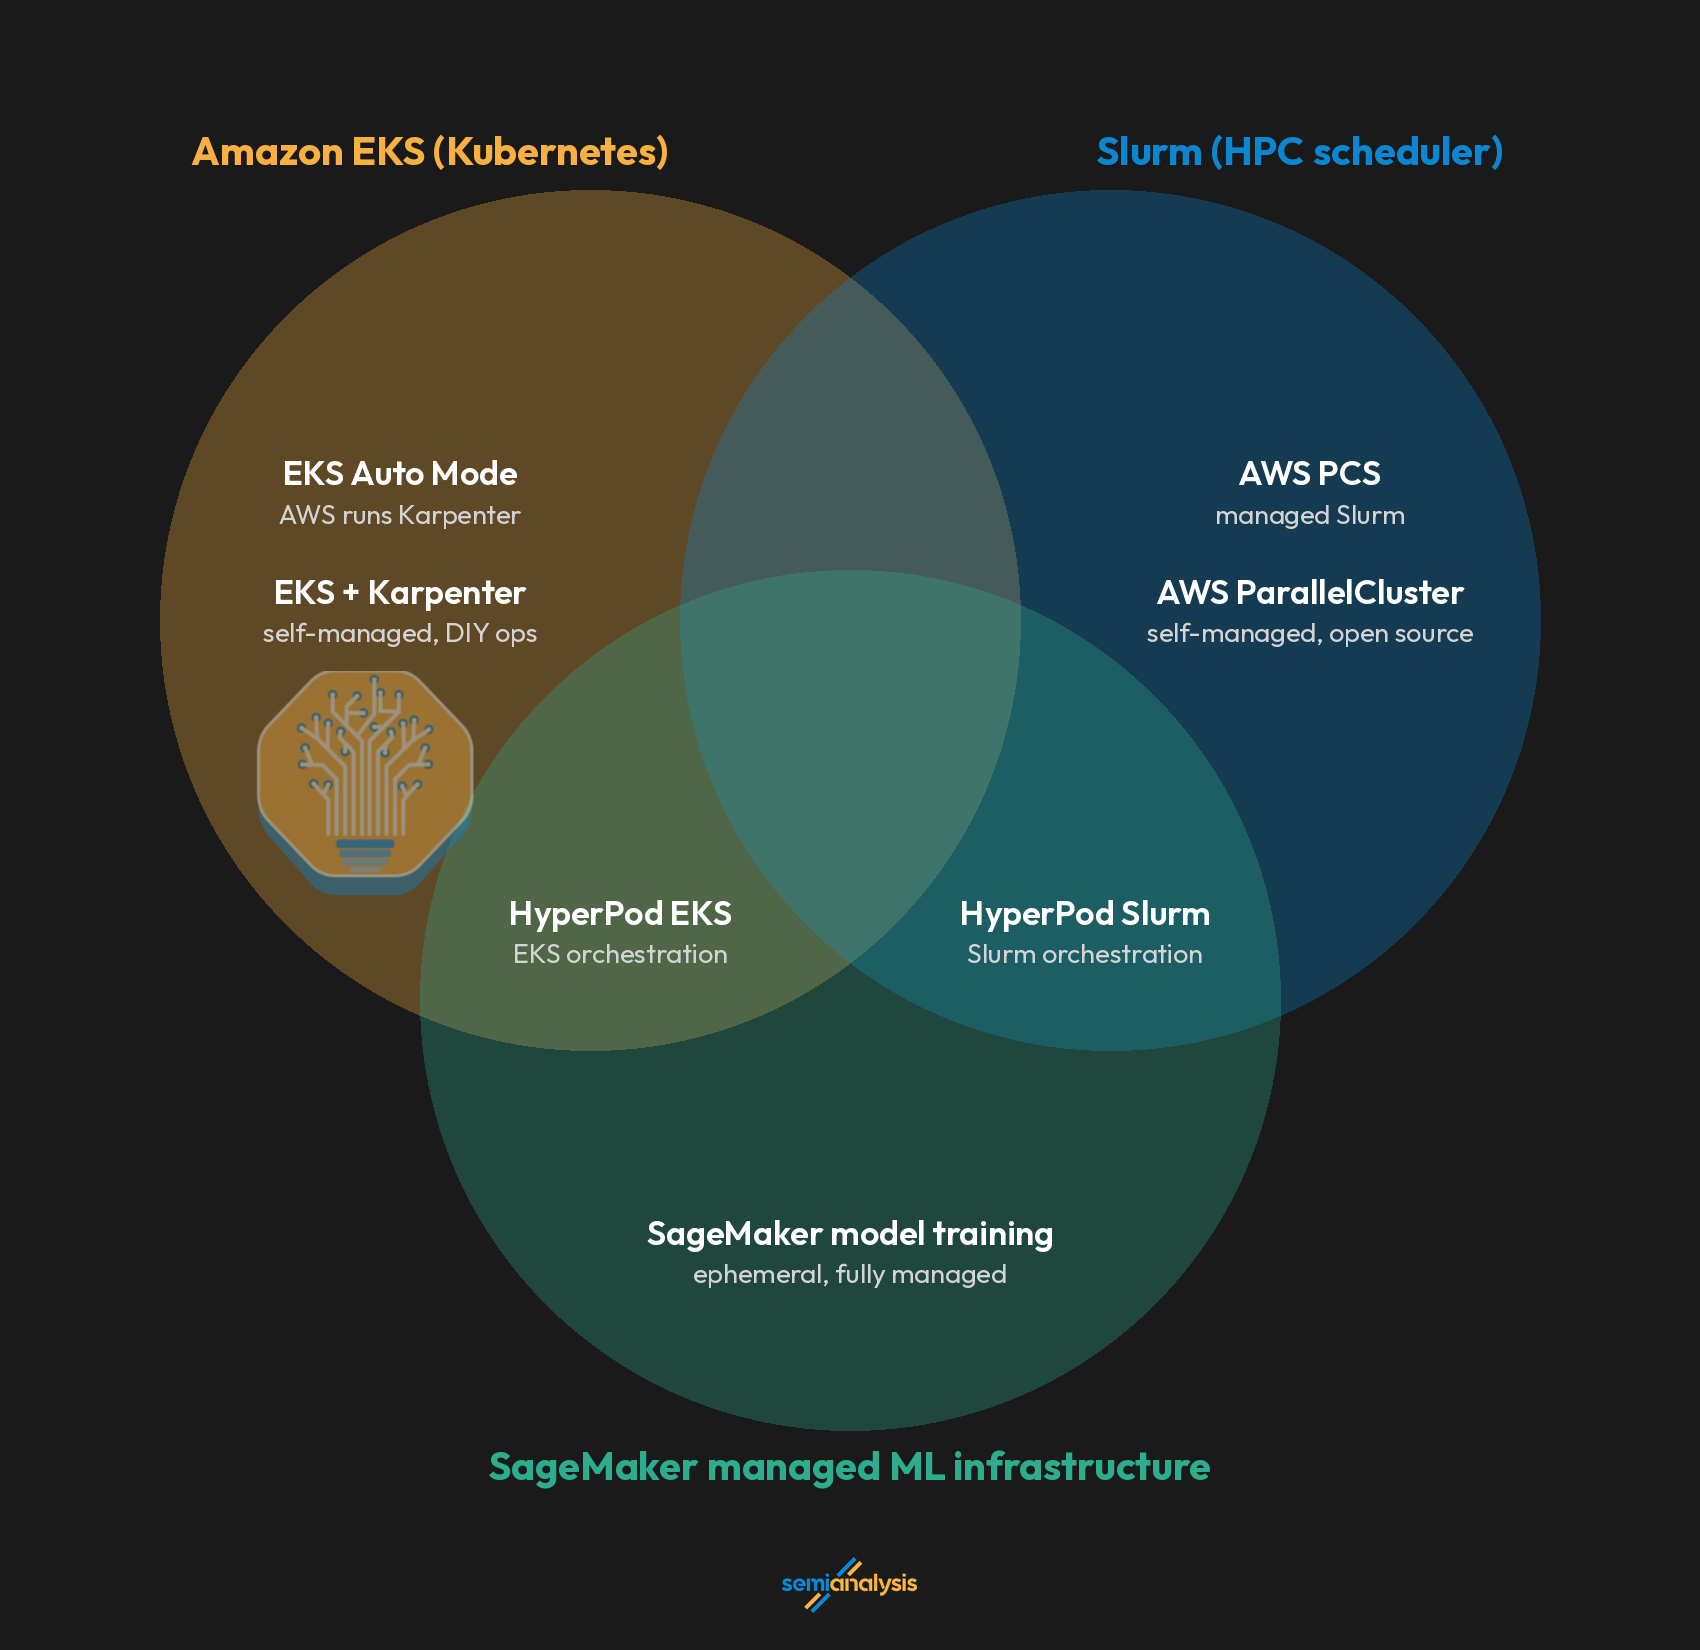
(Caveat lector: anyone not interested in the minutiae of AWS’s GPU offerings should skip this ¶.) SageMaker is AWS’s fully managed platform meant for minimal maintenance. If you don’t want to handle any infrastructure, it offers serverless model customization and data science environments that abstract away the underlying compute. At the next level up is the SageMaker HyperPod line, which supports both Slurm and EKS. The HyperPod line offers many conveniences like health checks, autoremediation, dashboards, and workload-level features like checkpointless training out of the box for users who want to preserve their `ssh` or `kubectl` access. If you want infrastructure abstracted away but want to handle the ML stack yourself, you can leave the SageMaker umbrella and choose EKS Auto Mode, which takes care of node provisioning, autoscaling, OS patching, and node repair. EKS Auto Mode is a wrapper on top of “managed EC2 instances,” but these are not actual EC2 instances in the sense that they do not show up in the EC2 console and do not provide the same level of customizability as ordinary EC2 instances. In EKS Auto Mode, users do not have access to the control plane, and they must allow AWS to recycle their workers every 21 days for security. Finally, for even greater customizability, there is EKS + Karpenter, which allows the user to manage autoscaling themselves with the open-source tool Karpenter.
Despite Amazon’s reputation as “customer-obessed,” it is clear that this novel-length GPU menu is an example of the adage “you ship your org chart” rather than a reflection of genuine demand segmentation. And the bureaucratic frustrations hardly end once you’ve ordered your cluster. This is a criticism of the organization rather than of any team in particular—AWS has shades of the 3rd-Century Roman Empire. To improve its standing in the next round of ClusterMAX testing, we recommend AWS choose another empire and/or time period for reference.
Nevertheless, there is a unifying trait of all these offerings: they fail to provision the first time you try. Thus, we made another clarifying Venn diagram:
This finally brings us to the AWS operator experience. One SageMaker cluster we provisioned in the console failed due to insufficient IAM permissions. Some of the EKS clusters used Terraform to simplify provisioning, but that path is not battle-tested and requires being in the right subdirectory and on the right commit of the right branch of the right (in-flight) repo and knowing exactly which knobs to turn without making an invalid request. One cluster came up without Lustre and would not let us attach any, despite extended back-and-forth with AWS engineers. For the purposes of testing, we provisioned a new cluster in a new region to gather data on filesystem perf, but if we were a real-life lab, this would have been crippling, at least temporarily. The AWS team we worked with was consistently helpful, but it is clear that they don’t have the liberty to go solve problems or even insight into how the system fits together, especially compared to the flat, nimble neoclouds we’re judging them against. It should not require six engineers on multiple calls to provision a Slurm cluster in the first place.
Once the goods were delivered, there were no blockers that kept us from getting reasonable perf out of the gate. The drivers, firmware, and most utilities were up to date. This is the bare minimum from a reputable provider like AWS, however, and there was no shortage of rough edges elsewhere.
A basic point of distinction between the AWS clusters we tested and their peer B200 clusters is that AWS uses Elastic Fabric Adapter (EFA), its proprietary scale-out fabric. In our testing, peak EFA throughput was strong. On a four-node 32-GPU all-to-all NCCL test over EFA on B200 we measured 59.44 GB/s busbw at 16 GiB message size, which works out to about 92% of scale-out line rate given the proportion of traffic that crosses the node boundary. On other networking tests with other traffic patterns and launching mechanisms, as long as message size was large enough, throughput was among the best B200 clusters. However, EFA consistently demonstrated worse latency than well tuned InfiniBand comps. For example, when the message size was reduced to 64 KiB, the same four-node 32-GPU all-to-all NCCL test took 85.26µs over EFA and under 50µs on InfiniBand peers; this delta of 30-40% between EFA and InfiniBand was consistent across small-message tests, which are latency-dominated. Although this may seem like a nitpick, scale-out latency is a critical metric for modern expert-parallel workloads, which frequently send small token vectors across the node boundary. This 64 KiB NCCL test, for example, is similar to the expert routing step of models like Kimi K3 and DeepSeek V4. Our findings are corroborated by an excellent Perplexity technical blog post about optimizing EFA, which reported similar results: EFA demonstrates satisfactory peak throughput but pays a latency penalty of 20µs or so on “the message sizes exchanged during MoE dispatch and combine.” (Note that this Perplexity post compares EFA to ConnectX-7 NICs whereas we tested ConnectX-8, but the nameplate throughput of the two generations is identical.) It’s not a good sign when Perplexity’s cracked engineers are writing painstakingly detailed blog posts about how to “enable” basic functionality on your custom network stack.
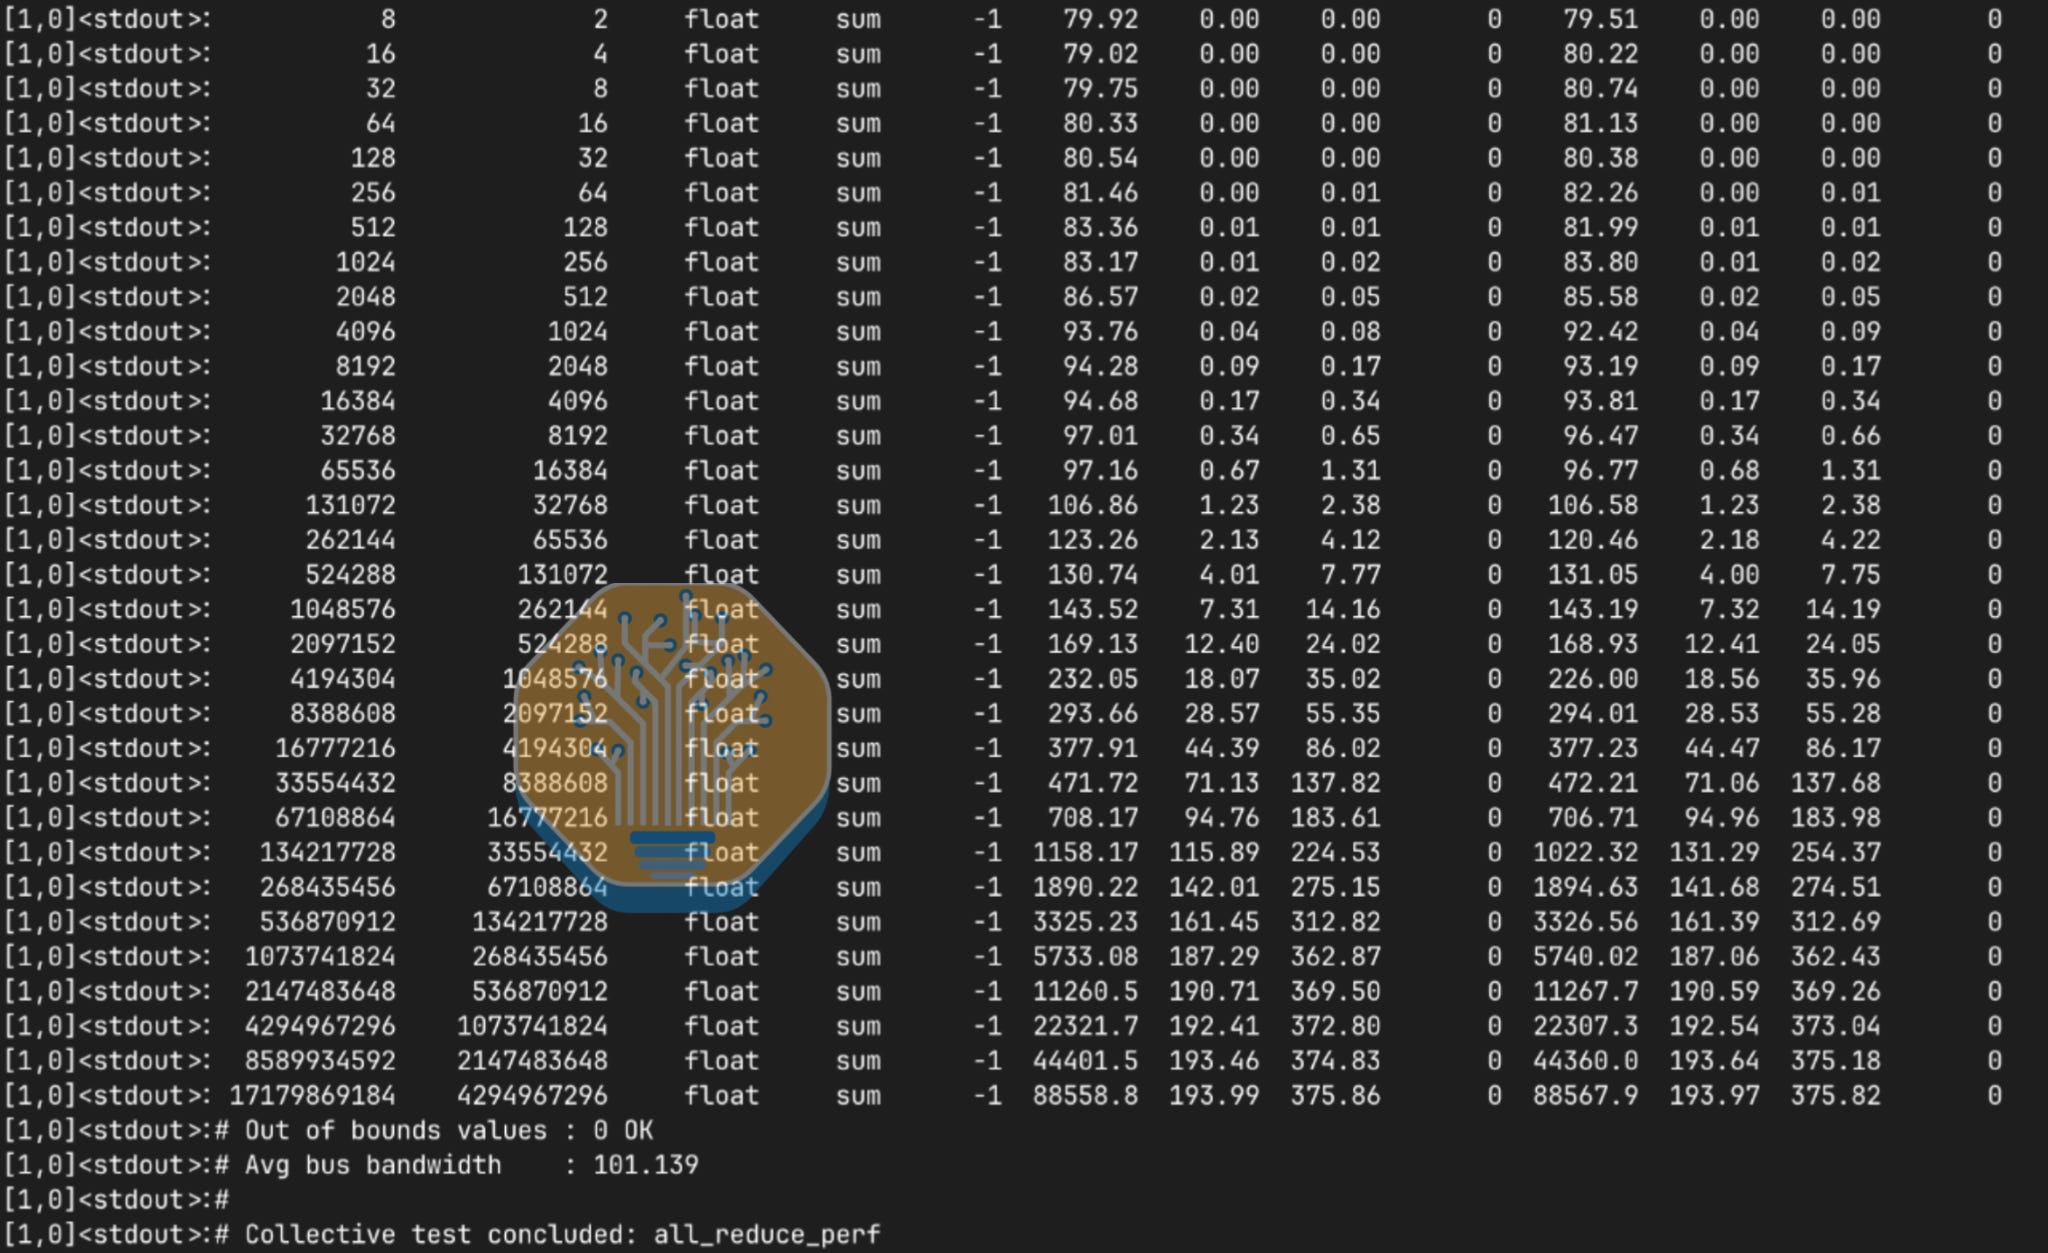
EFA still requires extra setup for expert-parallel inference in upstream vLLM and SGLang. AWS reports successful vLLM deployments, but users must install EFA userspace libraries and build the relevant communication components with EFA support. Depending on the workload, these include DeepEP, NIXL, or Mooncake Store. AWS’s DeepEP fork supports EFA through NCCL GIN. DeepEP V2 uses NCCL GIN, while its NVSHMEM-based V1 path is now documented as legacy. Upstream integration and default container packaging still require work. NCCL EP is another route under development; the linked vLLM integration remains a draft PR. In general, EFA is not a priority for frontier communications libraries, and users must wait weeks or months for what support they do get.
AWS is the only cloud distinguished in this way. Every other provider we tested uses InfiniBand or RoCE. Of course, AWS’s customers with GW deals have the resources to make sure their EFA is well tuned, but we still think it a shame that the largest provider’s scale-out stack is uniquely troublesome.
In a different way, storage was another basic cluster service that often proved uncooperative. The B200 cluster we provisioned in `ap-south-1a` failed every request for storage with an ambiguous `Insufficient capacity` error, and the `Failed` filesystems took 5h46m55s to delete.
To test Lustre performance required another cluster in another region, which meant another protracted bringup—another evening of terminal-watching trying to discern whether Terraform was making progress or not.
Claiming storage on AWS via Terraform is like raising a toddler: you can only watch and hope that once it’s done destroying it will start creating. And once the storage is created, it is not necessarily straightforward to access. On the Kubernetes layer, one cluster provided no StorageClass by default, and its only provided StorageClass left our PVC indefinitely in `Pending` because it had the wrong driver. This required us to define our own StorageClass with the correct provisioner.
Powered on and wired up, storage perf was mixed. The provided FSx stack struggled significantly with ordinary buffered I/O, reaching 9.2s in p99 sequential read latency on fio testing, compared to 312ms on the same metric with buffering disabled. Greater latency on the buffered setting is expected, but this is a pathological delta.
AWS’s health checks’ performance was, again, mixed. Our EKS Auto Mode cluster caught the XID we injected, set `AcceleratedHardwareReady=False`, and gave us a new and healthy node only 24m after the original injection. Meanwhile, our SageMaker HyperPod Slurm cluster immediately detected the XID, brought the node into `DRAIN`, and completed most of the reprovisioning process before tripping over its own feet when it required a deep health check before it could rejoin the fleet. This deep health check was submitted as a Slurm job and couldn’t be scheduled until, well, the node was added back to the fleet. Thus, an operator had to manually push through a `scontrol ... State=RESUME` command, at which point the fleet returned to full health. With our feedback, AWS promptly fixed this circular dependency, and a follow-up test on a single H100 node succeeded without intervention. Better.
Our EKS Karpenter cluster’s health checks were even more self-defeating. The `dcgm-server` DaemonSet did not tolerate the `nvidia.com/gpu:NoSchedule` taint, so it did not attach to the worker node, causing the monitoring agent to report `error connecting to nv-hostengine` and flip `AcceleratedHardwareReady=False` with `Reason=DCGMError`. Karpenter then marked the `NodeClaim` for termination, the replacement node was marked unhealthy for the same reason, and the system spun in circles until we manually modified the DaemonSet to tolerate the GPU taint. The health check had another allergic reaction when it noticed the IMEX daemon did not schedule. IMEX configures the NVLink fabric across nodes, but we had ordinary B200 nodes speaking via EFA, so there was nothing for IMEX to do: this daemon’s failure to land should have been harmless. Instead, the monitoring log emitted the schizophrenic message
ignoring IMEX health code on non-NVLink multi-node system, code=122
sending condition to exporter,
Reason=NvidiaFabricError,
Severity=Fatal
This would again have recycled a healthy node if we did not manually pin NodeRepair=false to keep overzealous garbage collection from blocking our work. Finally, as our testing came to a close, Karpenter tore down our B200 cluster 39 minutes before the EndDate, force-evicting a 4-node MPIJob in progress. We have gone into such detail here because these bugs are almost unbelievably elementary for the world’s largest cloud. Perhaps the single painfree part of the AWS lifecycle was Karpenter scale-up and scale-down, which completed in minutes with no errors. However, GPU capacity must be secured in large blocks and far in advance, so snappy autoscaling with Karpenter is a meaningless feature.
Despite the many problems with their product, AWS’s specialists and engineers were intelligent and responsive in our interactions with them. They were eager to show what they had improved, sought out feedback on documentation, circled back to rectify errors in testing, and even built a nice, forward-looking MCP server whose skills we plundered for our own codebase. AWS’s issues lie in its organizational structure. The number of basic issues that have slipped through the cracks is astonishing in an organization with AWS’s resources.
In February, AWS announced the expansion of its deal with OpenAI by $100B; in 2Q26, it posted 37% growth in net sales YoY; its Trainium business has hit $25B in ARR with triple-digit YoY growth; its Anthropic investment is appreciating to the tune of tens of billions per year; Bedrock continues to make bed-rocking margins on bed-rocking income.
Managed clusters are not AWS’s priority.
Gcore
Gcore is a Luxembourg-ish neocloud building out in ambiguous region called « Europe, » where it relies on other providers for capacity. They have made no flashy announcements recently, though they are adding Blackwell to their Hopper fleet. In ClusterMAX 2.0, we gave Gcore a Silver rating after testing their Kubernetes and SonK offering via Soperator. This time round, we only tried the SonK again.
Our insight into Gcore’s capabilities was limited by their lack of capacity: most providers granted us at least 4 B300 nodes for at least a week, but Gcore was so constrained that they could only part ways with 3 H200s. Nevertheless, there was plenty to keep us on our toes on this cluster.

Our testing on the Soperator layer required several rounds of back-and-forth with the Gcore team to fix some rough edges, but the team consistently proved helpful. When the majority of our first sweep failed due to a misconfiguration that prevented non-root users from running their workloads, the team responded promptly, confirming `kernel.apparmor_restrict_unprivileged_userns=0` would get us unblocked. Gcore’s team was again responsive in correcting another poor default when each Slurm worker reported `RealMemory=2048 MiB`, apparently having erroneously inherited CPU configurations. This kept us from even running `nvidia-smi`, and we were glad to see it quickly repaired.

Debugging was made slightly more challenging on the Soperator layer because inter-node SSH was disabled by default, but the team pointed us to a `soperator-createuser` convenience script to make life easier. The team also troubleshot an error with their dashboard as we tested.
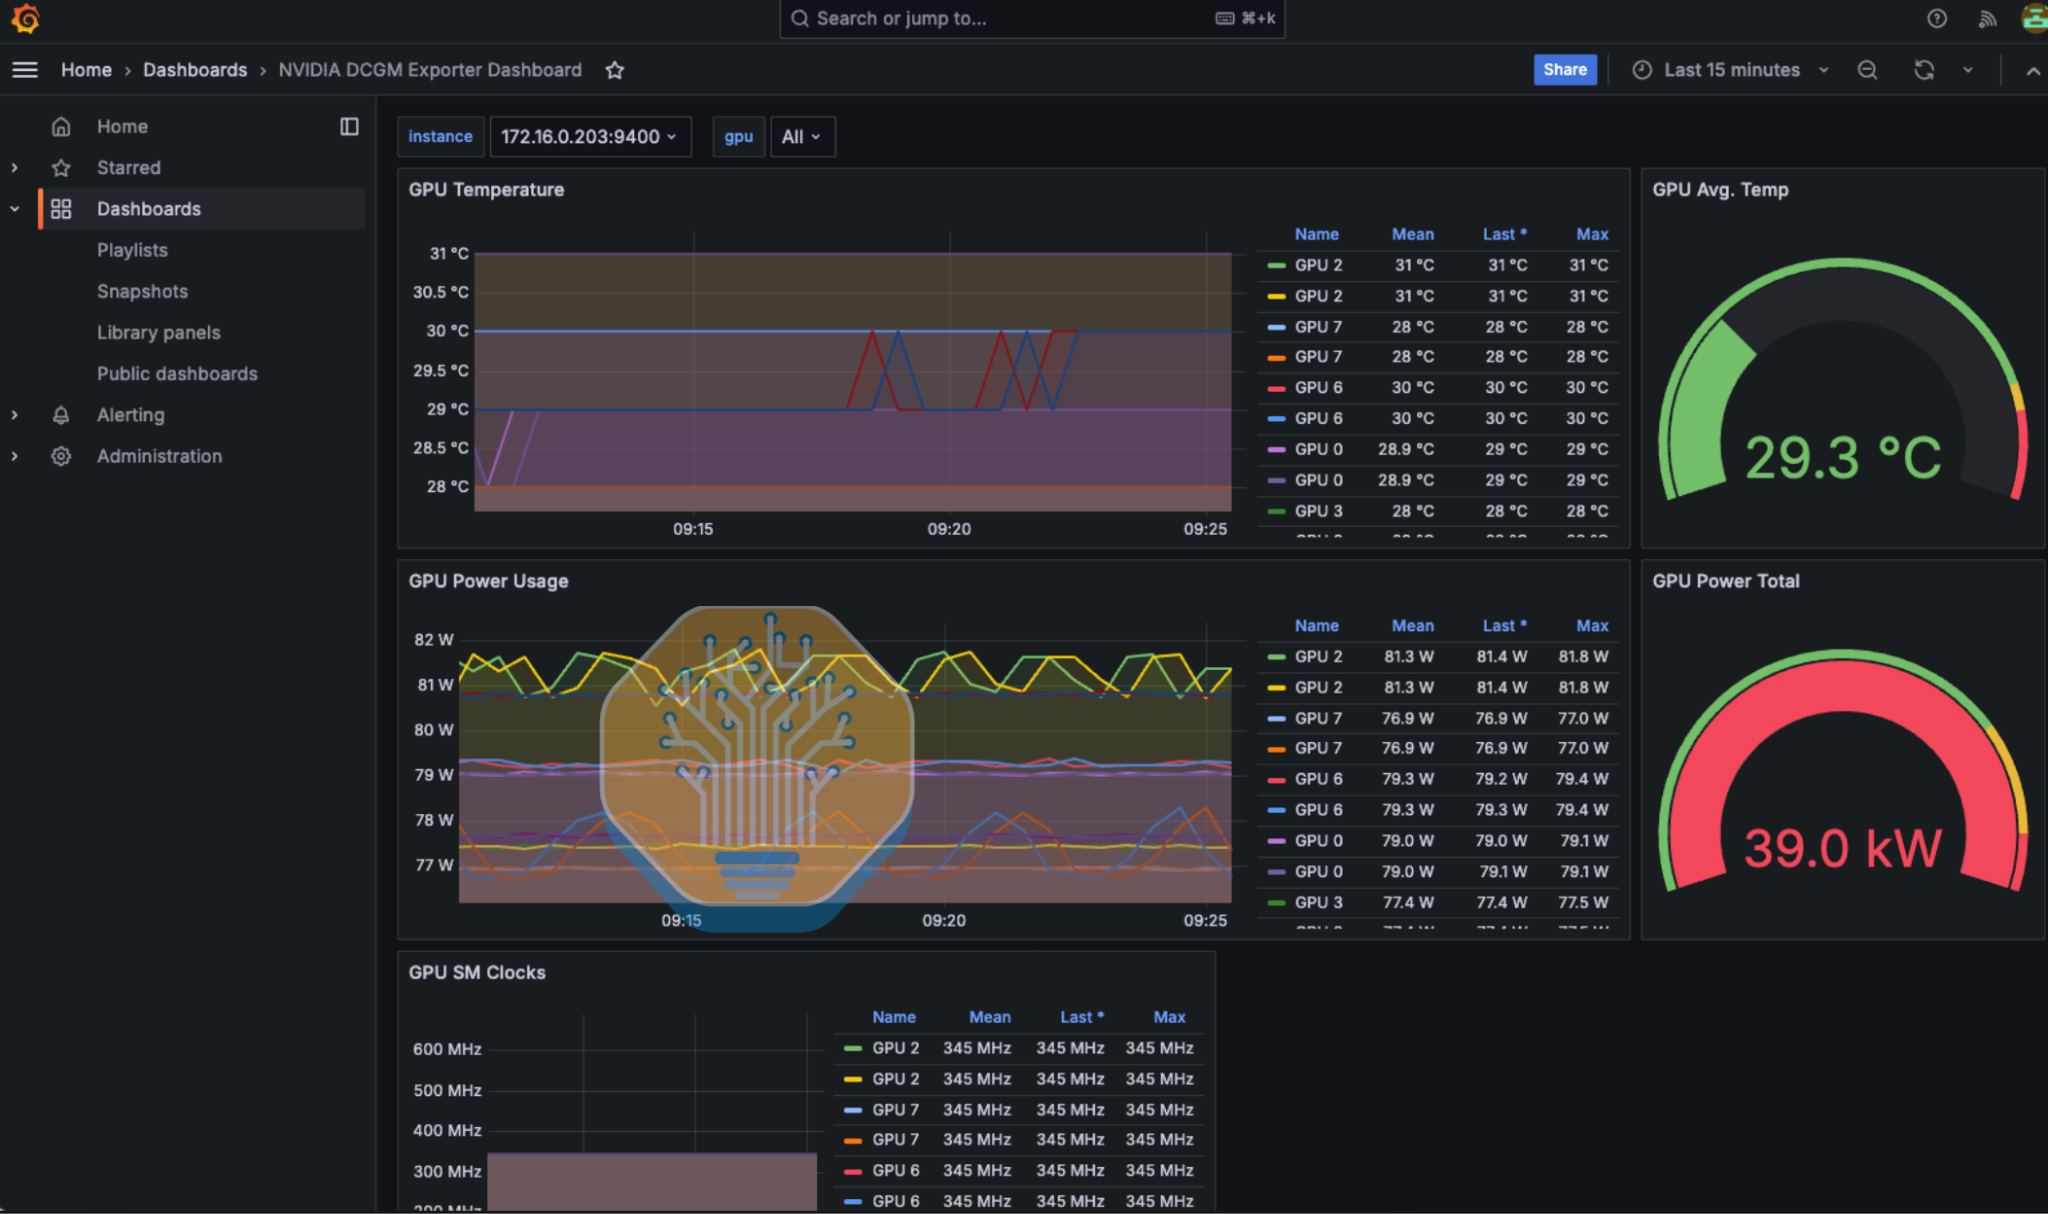
On the Kubernetes layer, there was no default StorageClass, so users had to select NFS explicitly. The storage on the Slurm layer was properly configured, with the easy-to-use Soperator default of NFS at `/`, providing the illusion of a single shared volume wired to all the nodes. This storage performed well across workloads. The N/S network was fine, and the E/W network ultimately performed up to spec, but the RDMA devices had non-standard names and no `topology.conf`, so configuration took extra steps.
The XID that we injected was quickly caught and displayed in Grafana; interestingly, the node went `Down` on the Slurm layer, but on the Kubernetes layer nothing changed, even though it was injected via K8s. We could not test autoremediation because Gcore had no spare capacity.
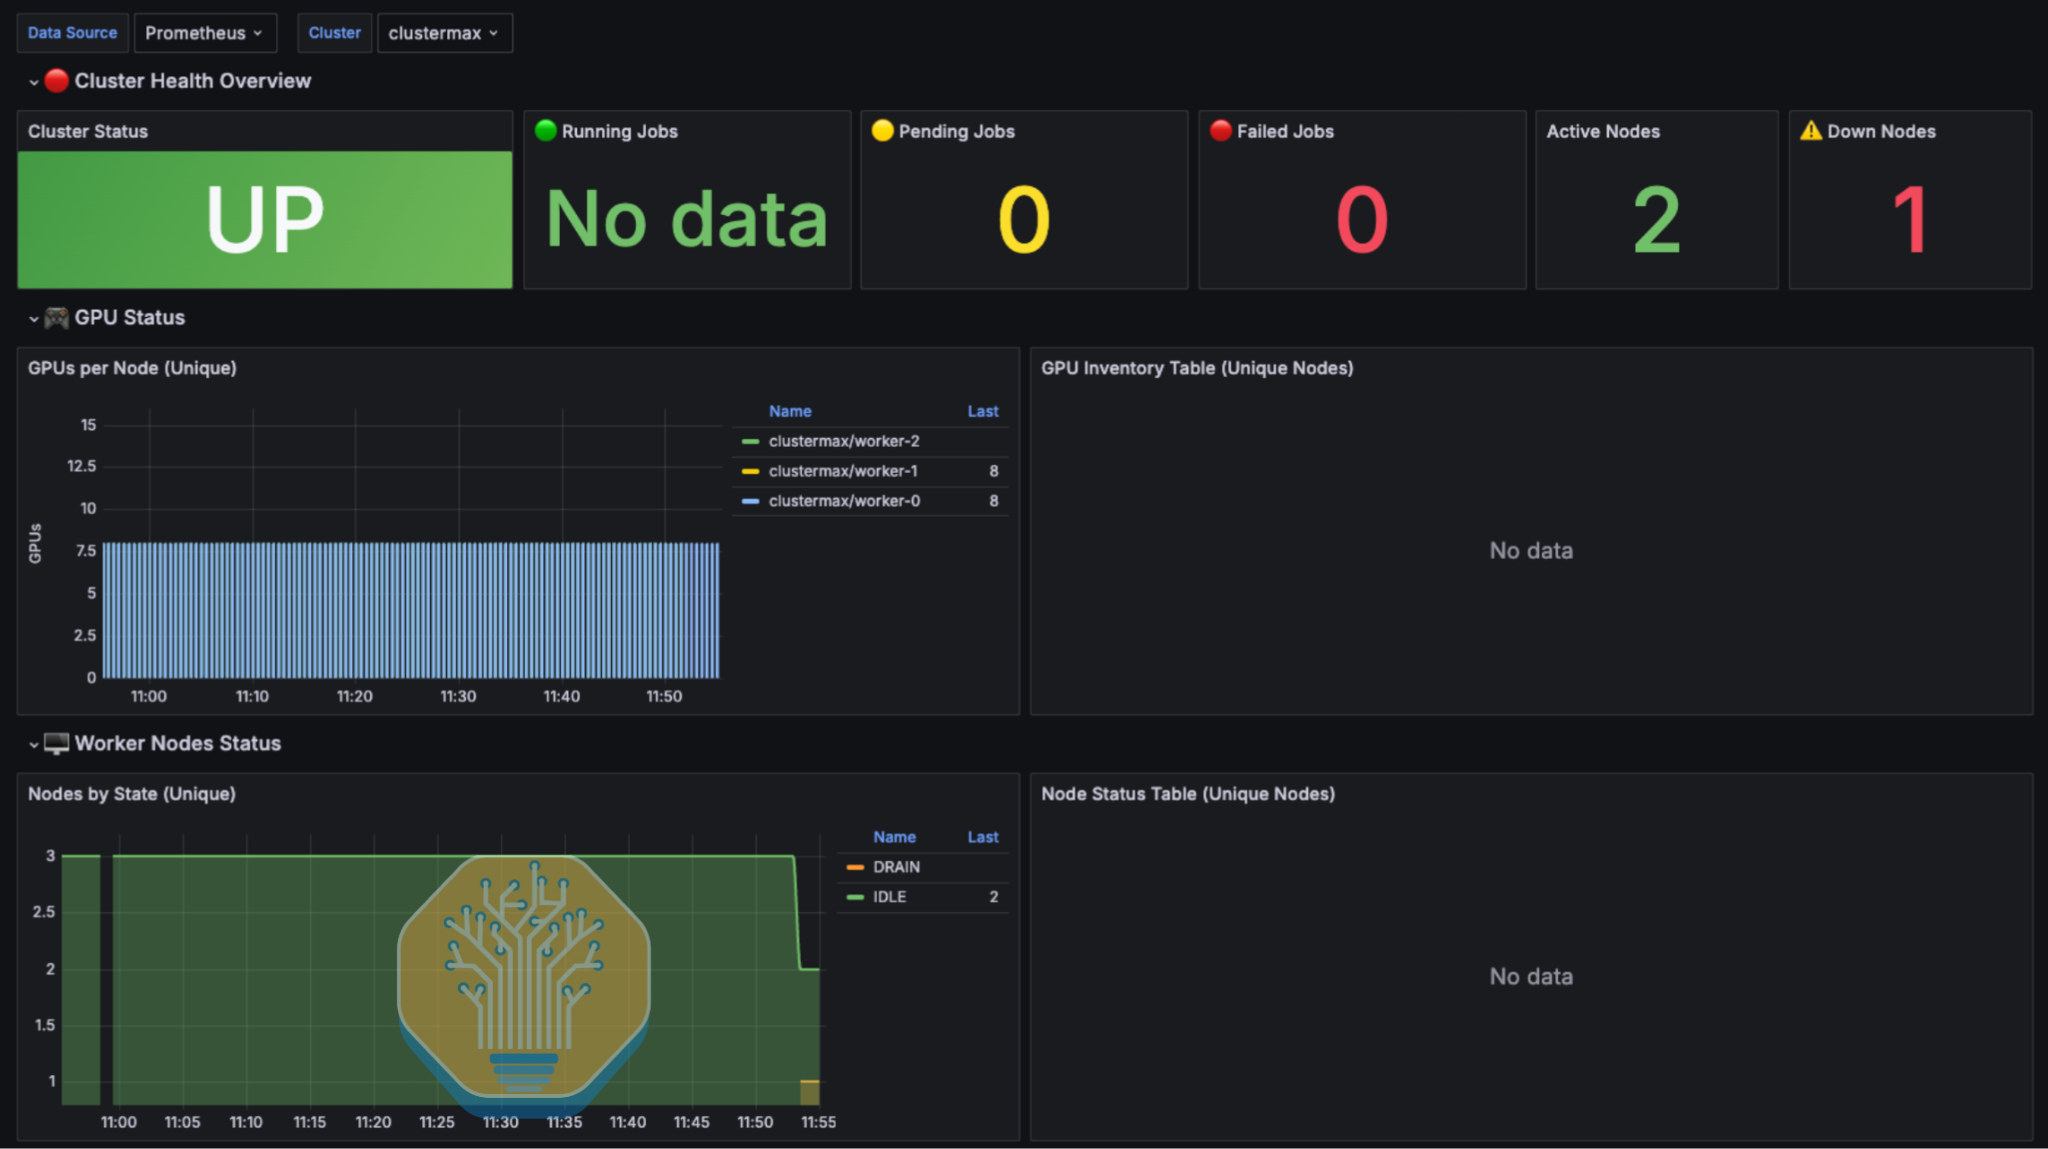
We were impressed by Gcore’s attentiveness and their Soperator offering that, after some massaging, did the basics right. We look forward to testing Gcore’s B300/GB300 management, including its handling of XDR ConnectX-8 NICs, and seeing the improvements of their Soperator and Kubernetes products.
GMO
GMO’s managed Slurm cluster delivered strong networking and storage performance on two B300 nodes. Its main gaps were restricted profiling, limited enterprise controls, and a lack of autoremediation.
Slurm arrived with a configured head node, partitions, and topology.conf. Drivers and CUDA/NCCL/HPC-X modules were current and consistent across nodes, and Pyxis was available. Onboarding was straightforward, though the Japanese-only console required some manual ctrl+c, ctrl+v translation for us to understand.

Grafana access took us five days of troubleshooting. We initially missed the macOS login-keychain instruction, then entered the certificate password where the system password was required. GMO investigated and repeatedly followed up. The final mistake was ours, but clearer certificate instructions would have saved time. Or, no unnecessary custom certificates to access the website. Japanese security theater strikes again.

The sixteen 400 Gb/s rails per node delivered strong NCCL results, though two nodes provide less scaling evidence than our usual four-node minimum. MPI launches needed explicit NCCL_IB_HCA settings, which GMO said it already supplied in nccl.conf, but which didn’t work for us initially. Burn-in showed no network errors, retries, or ECC errors, with normal temperatures and power.
Shared home/data/work directories worked out of the box. FIO sequential reads and writes, random reads, and torch.save were solid, built on a well-tuned DDN Lustre filesystem. However, our contrived tests such as `import torch` and vLLM Serve from shared storage performed poorly; GMO offered to investigate but we chalked it up to classic Lustre metadata performance tuning issues and moved on. Like many other Lustre implementations, the GMO storage offering lacked snapshots, automated backups, and disaster recovery options.
The cluster also lacked `sudo`, Docker on the workers, and required the use of snodes, a convenience script that they built to show metadata about the cluster, since they prevent users from running any scontrol commands on their own cluster. Security theater once again.
As a final step, SSH to worker nodes on the cluster was also blocked. And inside Slurm jobs, `RmProfilingAdminOnly=1` blocked Nsight Compute’s GPU counters, and perf was not usable for our profiling needs. We believe that managed clusters should allow users to profile their own workloads if they choose to go for the yolo-mode option. We wanted it, but GMO could not provide.
Finally, Grafana exposed useful DCGM metrics but lacked XID detection, estimated TFLOPS, SM Active, and SM Occupied views that we enjoy for performance and reliability monitoring. The Slurm job summary view was also pretty basic. Our synthetic XID 79 log injection produced no observed alert or node drain. GMO said it runs dcgmi health in the Slurm prolog, confirmed XID 79 was not whitelisted, and agreed to investigate for future. We finished our testing by determining that GMO lacked any autoremediation system in place, or at least we couldn’t verify it.
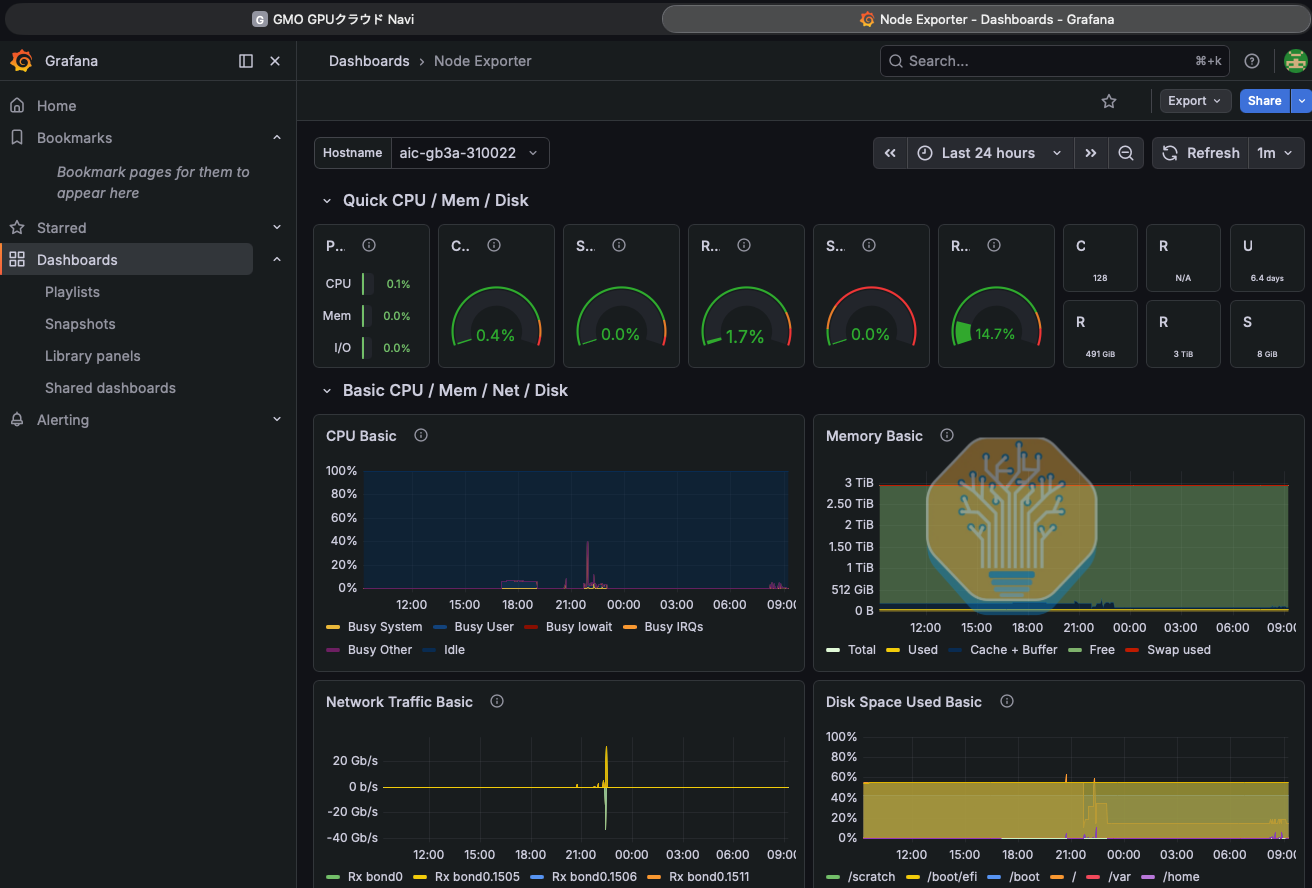
Overall, GMO’s lacking Kubernetes and enterprise features such as RBAC, SSO, and customer-accessible audit logs put it in the camp of niche, local player serving the Japanese market effectively. Our support experience with their team was helpful, but followed standard Japanese business hours. Going forward, we expect GMO to continue to be a leader in Japan, but lack the ambition required to expand their business beyond their local geography.
Verda
Helsinki-based Verda (formerly DataCrunch) disclosed $100M ARR and $200M total funding this June. They maintain a close relationship with Nvidia and continue to aggressively pursue financing. On the technical side, they have implemented a number of features since we tested them in November, and we are optimistic about their engineering team and roadmap.
Last round of testing, Verda’s Slurm was officially in beta, and they did not offer Kubernetes. This time, they offer a managed Kubernetes and have moved their Slurm offering to Slurm-on-Kubernetes to simplify deployment. We tested their cluster on both the Slurm and K8s layers; it had its fair share of rough edges, but represents significant progress and a strong starting point for continued development. We also found that security was solid.
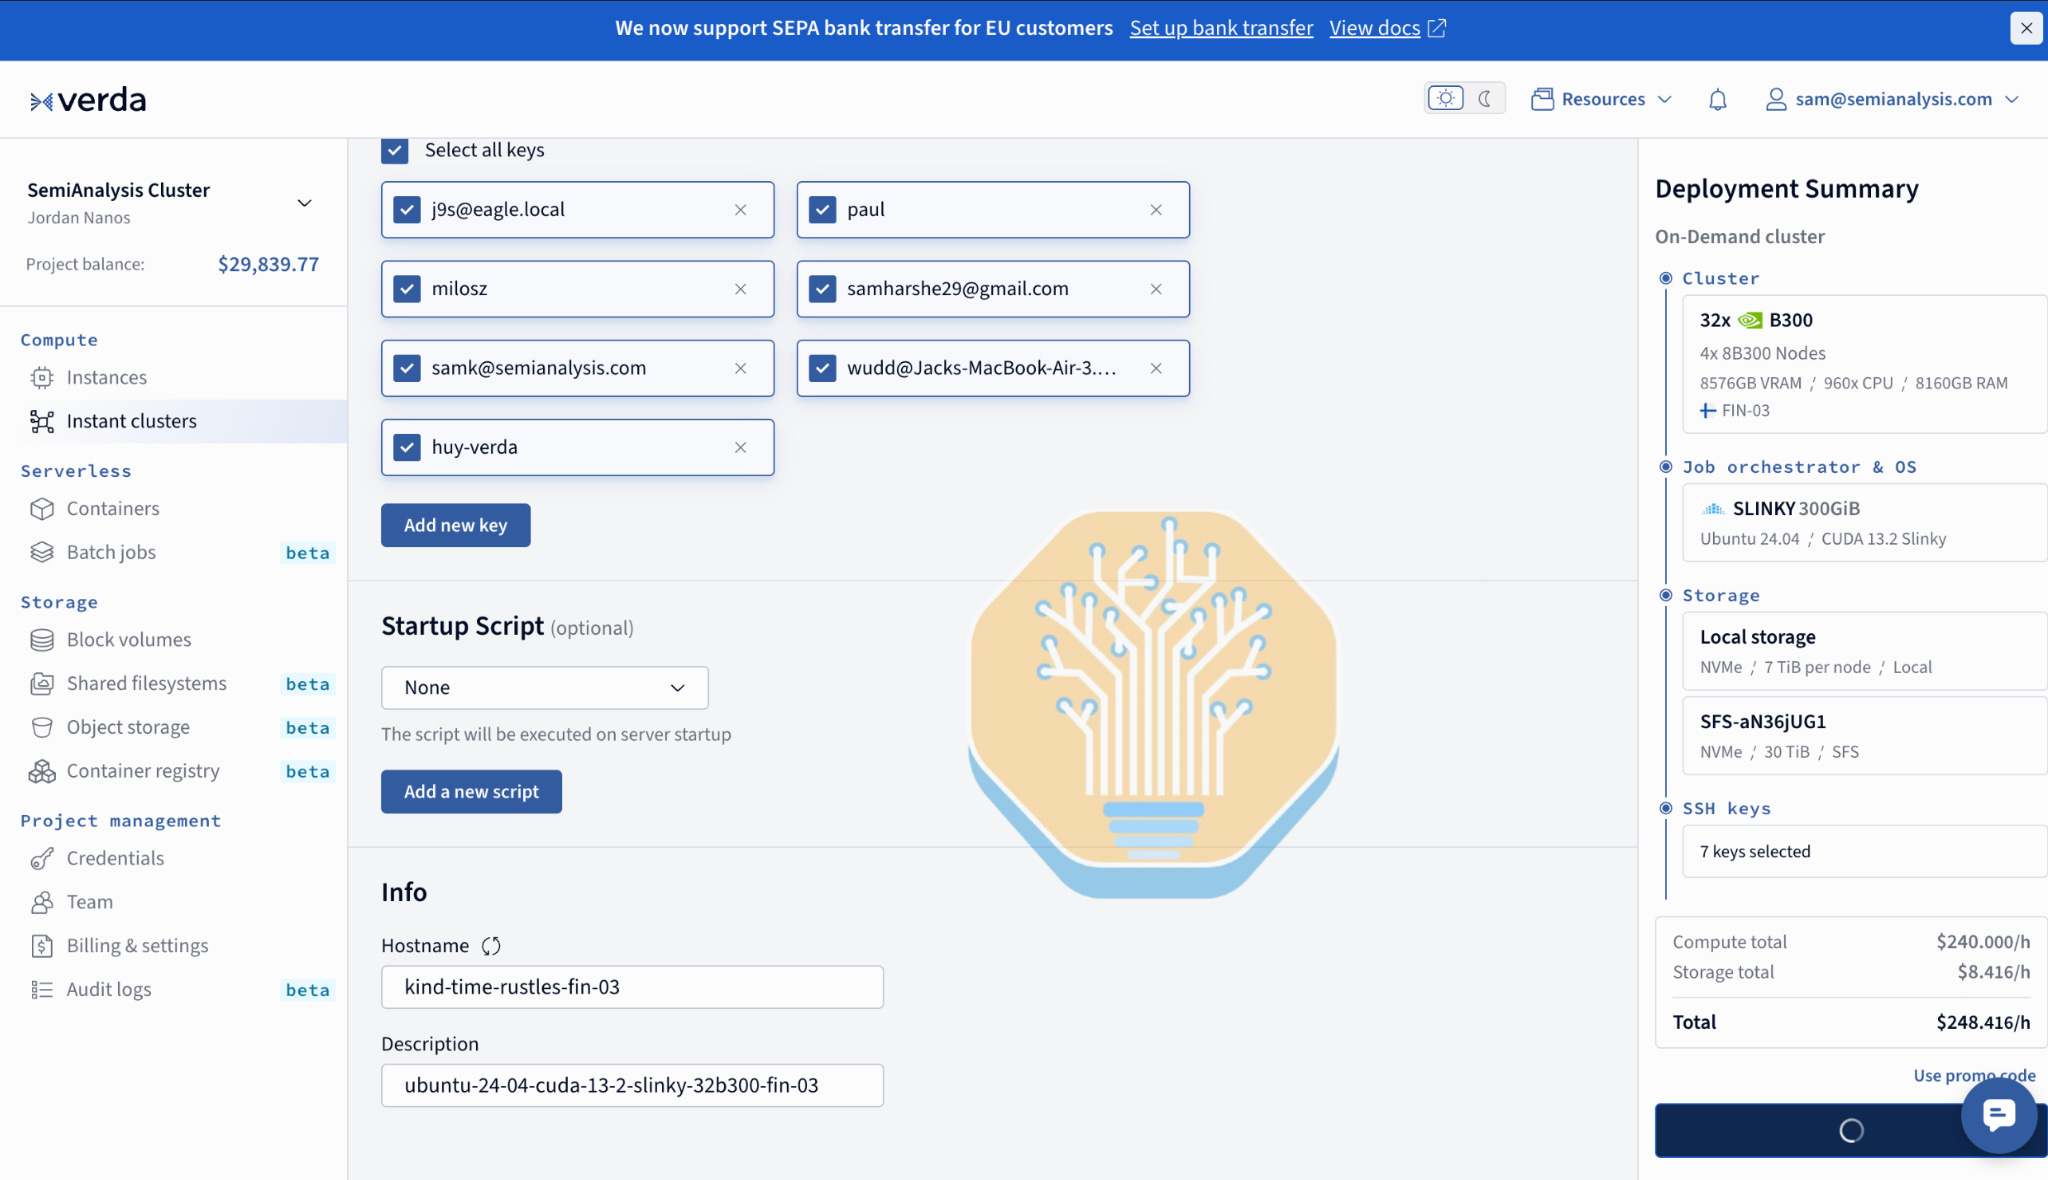
The purchase and onboarding process was smooth, and the cluster provisioned without hiccups in 30m. The Grafana dashboard worked out of the box, and we SSHed onto the cluster without incident.
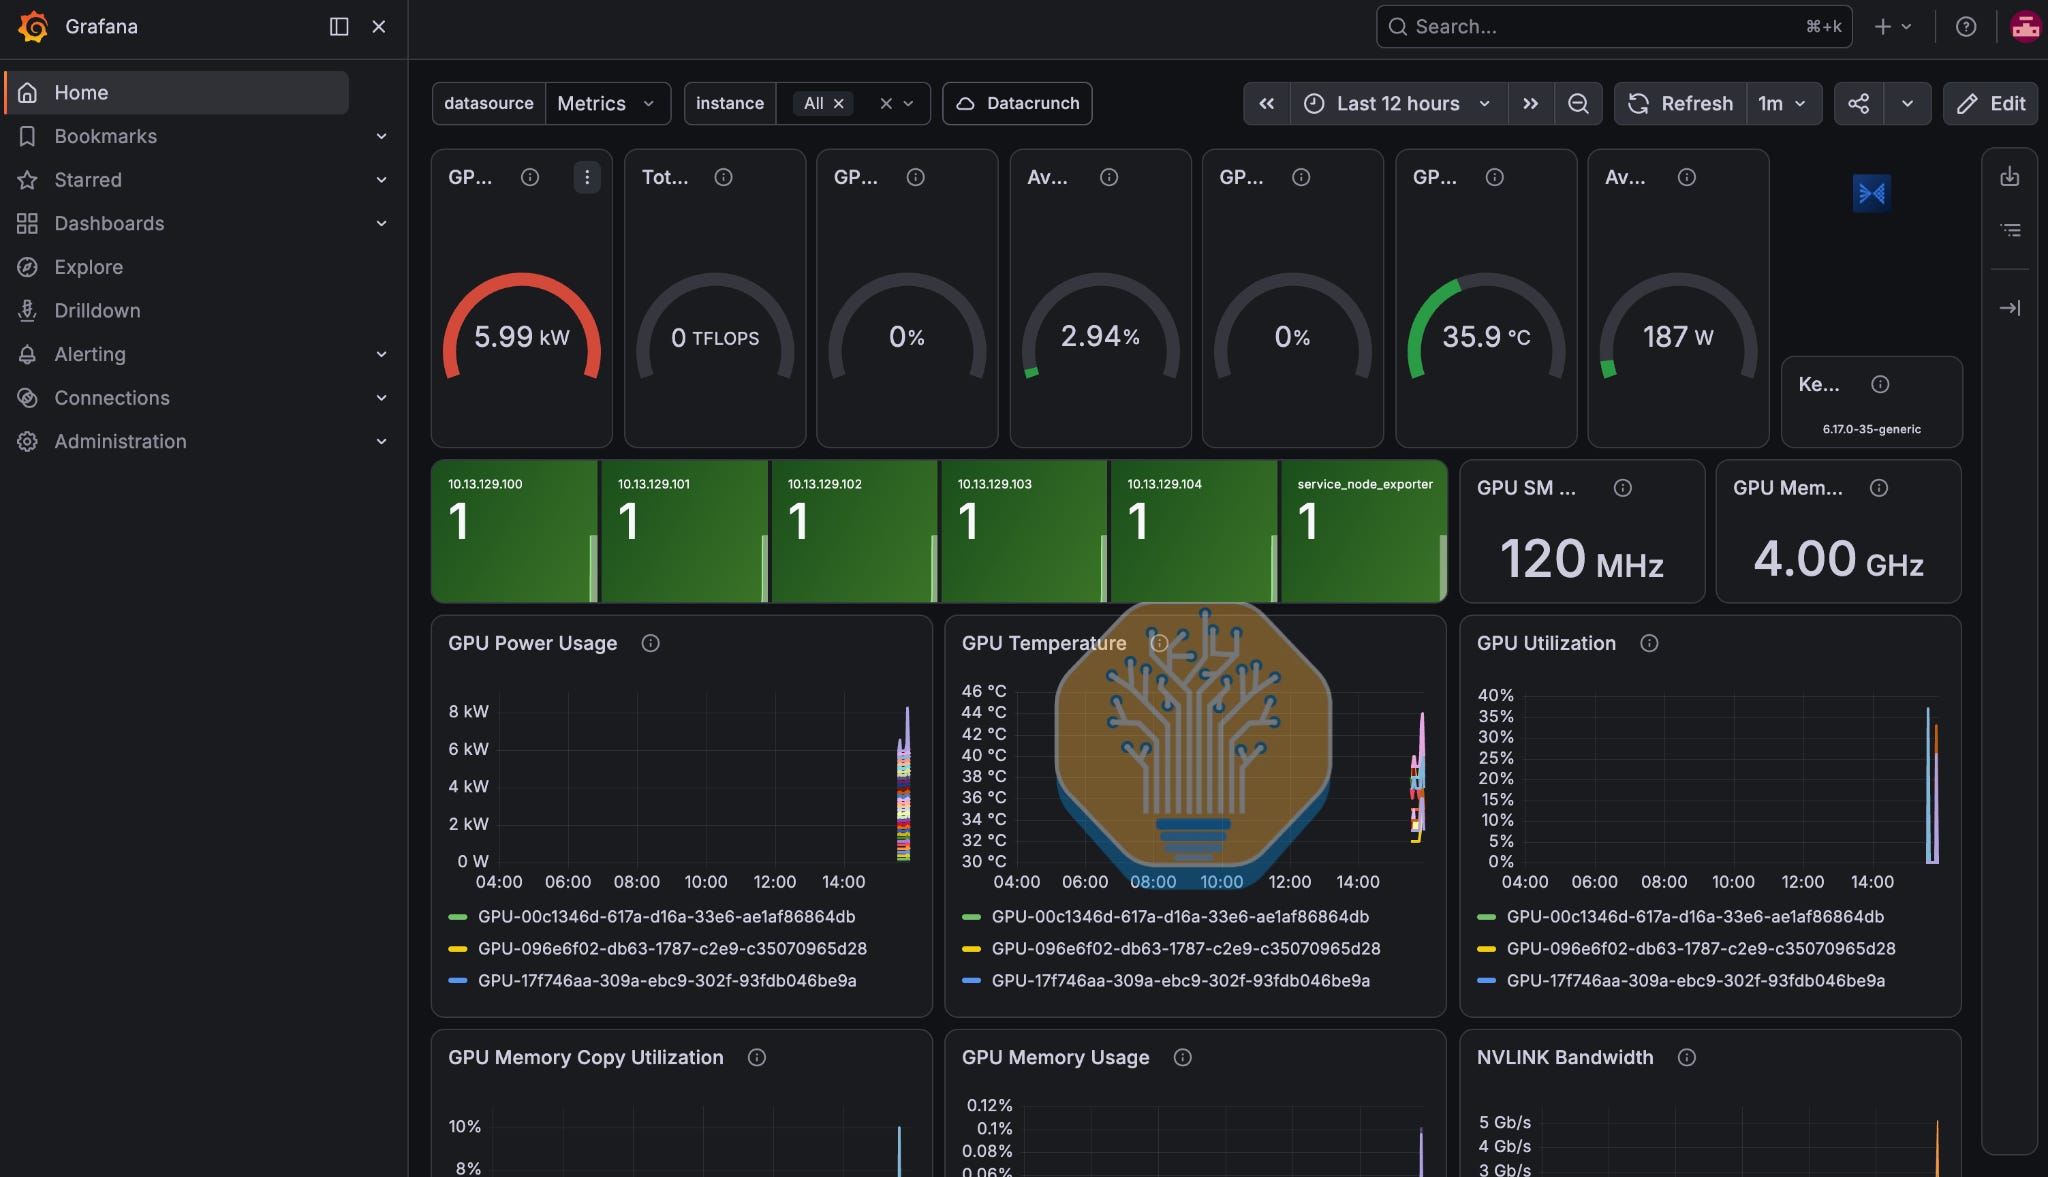
Once we got on the cluster, though, there were some bumps in the road. Our Slurm testing began with an interesting footgun: when we SSHed in, we assumed we were on the Slinky layer, but we actually had landed on the outer VM with wrappers that ran `salloc`, `sinfo`, and similar commands via `kubectl exec` into the `LoginSet`. The behavior was unusual—all Slurm commands escalated us to `root`, for example, and our Python environment disappeared—and it took an evening of debugging before we puzzled out that our Slurm access was illusory and a different SSH command would be required to access the Slinky layer properly.

Verda’s engineers were responsive, quickly hopping on a support call in which they reasonably explained the rationale behind these convenience functions and pointed us to the supported path. Although this particular feature caused us a headache, it’s bullish when engineers have gone out of their way to try to make their cluster easier to use.
The Slinky layer proved serviceable but imperfect. Verda ran a NCCL-test prolog that exceeded Slurm’s 10-second `MessageTimeout`, causing a worrisome though harmless `Prolog hung` alert every allocation. More significantly, Verda did not support Pyxis or Enroot, so we had to stand up our environment via a massive `.sif` file. Once our workaround was finished, we completed an 8-hour burn-in without incident and measured satisfactory numbers on our microbenchmarks.

Meanwhile, the Kubernetes layer could only be steered through the bastion, offering no way to download a `kubeconfig` through the console. This is a relatively simple fix to align Verda’s offering with users’ standard workflows.
The biggest shortcomings that surfaced during our performance sweep were of the shared filesystem. Gross throughput numbers were excellent, but cross-node file locks seemed simply not to be enforced. We found 100/100 exclusive-lock violations for both `flock()` and `fcntl()` across nodes, while same-node controls refused every attempt. This strongly suggests the issue is with `virtiofs` failing to publicize locking behavior. We also saw corrupted data when downloading with multiple clients from Hugging Face and `ENOENT` failures on Elbencho with 32 clients. This is more low-hanging fruit, and crucial given the fundamental importance of a reliable shared filesystem when running Slinky.
Lastly, Verda’s health checks programs are not yet fully configured. They are literal “health checks” in the sense that they evaluate whether a node is healthy, but there is nothing to consume their output—they exit `1`—“yup, this one’s dead”—and move on. A user must therefore bring their own reliability suite if they don’t want bad nodes silently killing their workflows. There is of course also no autoremediation provided by Verda.
Verda consistently communicated promptly and clearly and seemed to have engineers with the liberty and motivation to improve their product. On September 10, after our testing completed, they pushed a number of changes to Instant Clusters that appear meaningful. We look forward to seeing them continue to sand the edges of their Slinky and Kubernetes offerings, tune their storage system, and implement robust health checks and autoremediation.
Moonlite
Moonlite, a neocloud headquartered in Chicago, is a new inclusion as of ClusterMAX 3.0. With an ex-Crusoe founding team, Moonlite currently operates a Hopper fleet and has recently handed over its first B300s and GB300s, which it will be continuing to ramp up in the coming months. According to LinkedIn, Moonlite has the fewest employees of any company we worked with this round and oriented around engineering.
We tested Moonlite’s Kubernetes and Slinky. The handover process was smooth, with a nice onboarding document defining validated recipes and a Kubeconfig that gave us everything we needed. By default, everyone shared the same root user on Slinky; when we asked for non-root users, Moonlite made a `moonlite-adduser` convenience script in half an hour and baked it into the login-pod image same-day. This shows Moonlite’s responsiveness to feedback, but also their greenness. We loved their response. We would rather have a battle-tested system, ideally through the console, to handle basics like this.
On the hardware side, everything we tested worked well out of the box. NCCL tests hit ConnectX-7 specs, NFS was good, compute benchmarks were solid, and burn-in completed without a problem. However, it bears repeating that we were testing H100s, which by now are quite familiar to the industry and are therefore easier to get right than the GB300 NVL72s we had with other providers. Nonetheless, we were happy with our Hopper perf.
One component of the system that we could not test was the NVMe, which existed but could not be accessed. Nothing exposes it: no local-path `StorageClass`, `hostPath` unavailable, and Slurm workers are Slinky pods with only VAST `/home`. On the Kubernetes layer, there was no default `StorageClass` at all, and unqualified PVCs hung `Pending`.
We tested Moonlite’s health and monitoring system via a PCIe secondary bus reset, and Moonlite alerted us in 11 minutes. With our permission, they cordoned the node, ran diags, and returned it to our fleet after 57 minutes total, including a few minutes where they waited for our instruction on how to proceed. In practice, with actual customers, they define policies ahead of time so that their team can follow a runbook depending on the particular error. Moonlite’s typical SLA is to respond within 15 minutes as their team receives alerts in Slack and PagerDuty. We hear from their customers that so far that this is exactly what they do.
In our view, any autoremediation process that brings us back to a full fleet within an hour is good enough. But while manual processes are fine, at scale, we want to see this automated. We would also prefer greater visibility on the cluster in the event of an error. The only change visible to the user was that the node, while remaining `Ready` on the Kubernetes layer, advertised 7 GPUs instead of 8 in the time between the reset and Moonlite’s manual intervention.
The Slinky layer lacked any container runtime on the workers but otherwise got the job done, and had most of what we ask for on the login pod. Moonlite’s Grafana was fine, but it lacked detail at the scheduling layer, and does not display the most crucial information, which is error status.
What Moonlite attempted to do, it did well. We look forward to testing them again as their products mature and they get some GB300 calluses on their hands.
Together
In ClusterMAX 2.0, we wrote the following about Together:
Together is a strong provider with a robust cluster offering for both Slurm and kubernetes, but it is held back from the gold category due to reliability issues.
This round, Together’s issues—generally but not exclusively having to do with reliability—are cause for downgrading it to Bronze.
Two nodes of ours failed during a compute test; one came back, but the other was sent to RMA without notice, so we were left wondering where it went. Later in testing, Together’s Slurm `HealthCheckProgram` tried to run `dcgmi diag -r 1` under a 45s timeout on nodes that were already scheduled; the diag did not land, the timeout was misread as a failure, and the nodes were drained mid-run. Together quickly fixed this with our feedback. Separately, one of our nodes could not access VAST because its storage NICs were in `operstate=down`, which Together explained was due to a race condition in NIC initialization in their new lightweight VM stack. There was nothing to catch this error, and manual intervention was required to reprovision a healthy node and bring our test fleet back up to 4. While we like the sound of “reduced cluster provisioning time,” we obviously don’t like to see it affecting reliability.
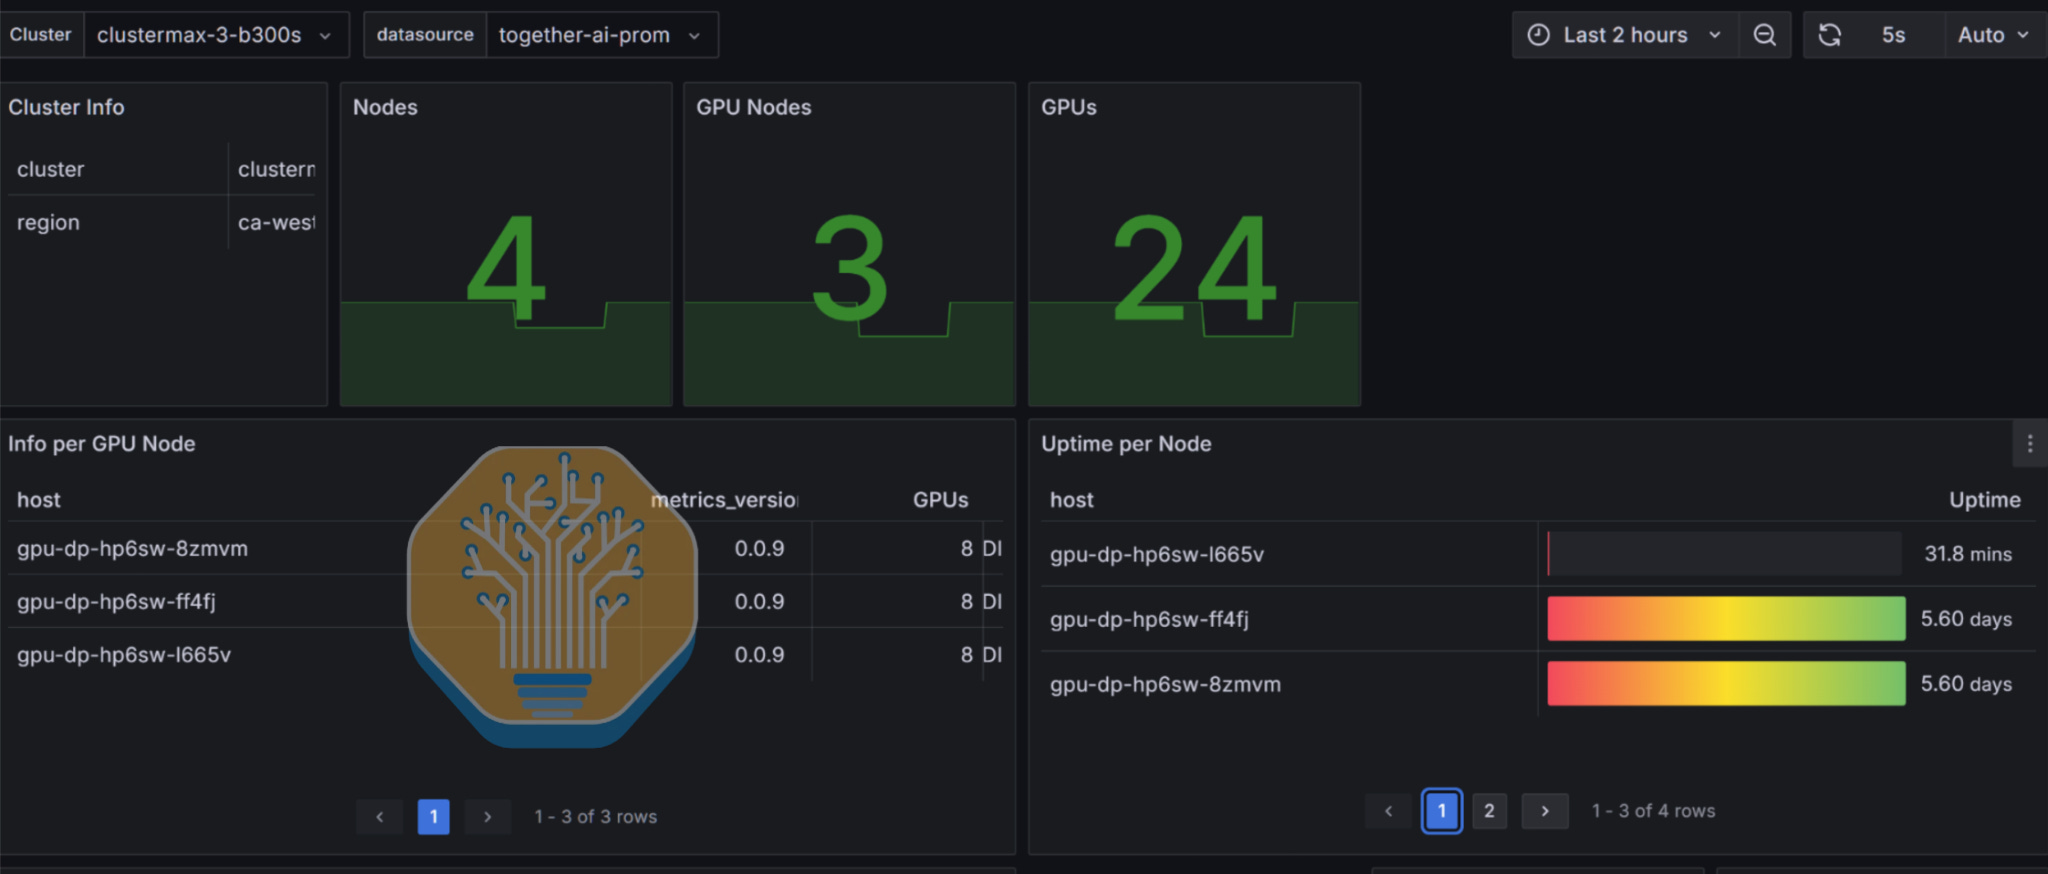
Together’s health checks did work correctly in some instances, showing progress since ClusterMAX 2.0. When we triggered a PCIe secondary-bus reset on the Slurm cluster, the node was drained in 67s, and an automatic node replacement completed in 35m7s without manual intervention. A synthetic error also cordoned a node on the Kubernetes layer and correctly did not trigger autoremediation because we had `Auto Repair` turned off.
The Together Kubernetes and Slinky layers were both functional, though with a handful of challenges. Interestingly, Together advises to avoid using the Kubernetes layer of the Slinky cluster: to convert Slinky nodes to K8s, we were instructed to tear them down and reprovision as vanilla Kubernetes. The Slinky offering should therefore be evaluated as plain Slurm. Summarizing its pain points as briefly as possible: OCI image extraction failed because of default settings on `/tmp`, so we had to redirect extraction to `/scratch`; when this happened, Slurm exited `0` anyway; NFS rejected any filename containing `:`; tenants did not have permission to read `dmesg`, which prevents checking for XID events; and non-login worker shells have neither `nvcc` nor `mpirun` on `PATH`, so ordinary batch scripts behave differently from interactive setups and lack the tooling that they need. None of these is fatal, but adding them up, along with other more minor errors, meant a few dev days before we were able to run our stuff unimpeded. Strangely, Together’s public internet delivered strong throughput to most services, but its connections to Canonical’s Ubuntu archive origins repeatedly failed to establish, stalled after connecting, or transferred below 20 kB/s. This again left us stranded as we tried to get our cluster set up.
A public IP check confirmed that this flaky B300 cluster had org `AS53735 IREN`. This N+0 Prince George datacenter is one of two datacenters in the industry notorious for unreliability, along with Crusoe’s cursed Reykjavik site. We strongly suspect that one or both of these datacenters was not inaugurated with a Land Acknowledgement. We know of multiple exceptionally unhappy customers of Together struggling with link flaps, power issues, cluster access being shutoff, random upgrades that aren’t approved by the users going wrong and not being rolled back, and weekend-long outages that eventually get blamed on a single ISP (yes, a single ISP at this site—no redundancy in Northern Canada). Maybe their other sites are better but the TogetherAI site at IREN Prince George is completely bad.
After playing the blame game for some time, it is clear that reliability issues cannot be blamed entirely on underlying providers. Unforced errors from customer support engineers have created a lack of trust between customer and provider.
Of course, managed clusters are not Together’s bread and butter, nor are they its primary source of revenue. When, in July, they announced an $800M Series C, the post made passing reference (at best) to their managed clusters business, emphasizing, on the contrary, that “Together AI is a research-driven company.” The offtakers of their 250MW in Saudi are as yet undisclosed, but we are aware that Together would prefer to get paid per token, not per GPU-hour. Despite this, we hope that Together manages to Get It Together, and address its cluster reliability issues to make its Slurm and Kubernetes products something to be proud of.
Crusoe
The Crusoe section of ClusterMAX 2.0 ended on a cautious note:
Crusoe is at risk of being downgraded to ClusterMAX Silver due to many of their top individual contributor engineers quitting, leaving the culture in their cloud division beginning to resemble big tech. There are too many middle managers across the organization, especially in engineering. This has caused incredibly slow moving releases, such as their AutoClusters feature, leaving us with concerns about the future of Crusoe’s public cloud offerings. Chase needs to do a rapid course correction if he doesn’t want to lose all of his 10x engineers and eventually lose their Neocloud business with it.
In the eight months and change since we published that paragraph, Crusoe has had its fair share of wins. Its valuation has grown from around $10B to $30.9B, it has announced 900MW and 1.0GW campuses in Texas and many more elsewhere, and it remains an innovator in the wild wild west of datacenter construction. They have the largest real pipeline of any datacenter builder.
Its inference endpoints business is also extremely highly regarded, following the acquisition of some cracked Israeli engineers from Atero. They have also landed awesome deals with firms like Jane Street.
Plenty to keep their hands full and business churning, some clusters are amazing, but others from them are terrible.
Yet this round of ClusterMAX testing finds that Crusoe’s neocloud business has not course-corrected rapidly enough. The problems go back to the fundamentals: reliability and hygiene.
We emphasize health checks in our expectations and our write-ups, but genuine hardware failures are rare in testing because our ClusterMAX allocations are too small and short-lived. Crusoe bucks this trend. On an H100 cluster we had in May to test AutoClusters, we saw an impressive barrage of XIDs—more real errors on one cluster over five days than we saw in the rest of testing combined.
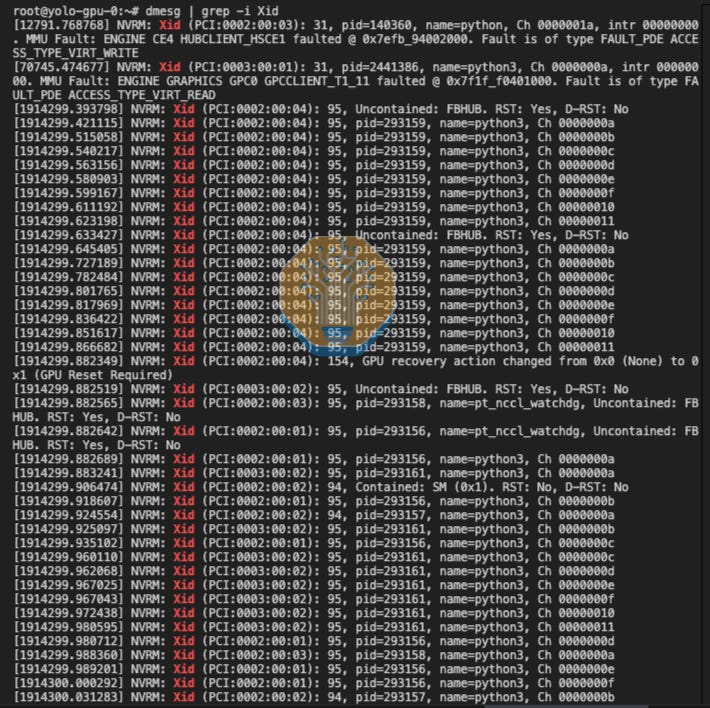
In a pattern that would repeat throughout testing, exceptionally poor performance in some areas was paired with mature services in others: this storm of XIDs was accompanied by convenient emails, attractively styled, politely notifying us of the errors.
In addition to being responsible for the majority of this round’s hardware failures, Crusoe bears the distinction of having had the oldest Linux kernel and the oldest GPU drivers we tested. Crusoe has since rectified these shortcomings, but at the time of testing there were several software versions that were well below our minimum expectations: the aforementioned NVIDIA drivers failed our `cmax audit security`, along with Docker, ConnectX firmware, and `runc`. These issues speak to a lax security posture and poor engineering hygiene.
Nor are these software-version criticisms merely academic. The Linux kernel that our B300 cluster ran, `5.15.0-185-generic`, was earlier than a Linux patch series called “writeback: Avoid lockups when switching inodes.” The particular problem that our kernel experienced is well explained by the description of commit `e1b849c`, which fixed it for upstream kernels:
```
There can be multiple inode switch works that are trying to switch inodes to / from the same wb. This can happen in particular if some cgroup exits which owns many (thousands) inodes and we need to switch them all. In this case several inode_switch_wbs_work_fn() instances will be just spinning on the same wb->list_lock while only one of them makes forward progress. This wastes CPU cycles and quickly leads to softlockup reports and unusable system.
```
When might a `cgroup` that owns thousands of `inode`s exit? One answer: when a Slurm job is torn down. In our case, as an ordinary workload wrapped up, every CPU on the NUMA node ended up stuck contending for the same `list_lock`, making the processor unusable. The local NFS client, which happened to be on the frozen NUMA node, couldn’t get CPU time, and a liveness probe for that client timed out and reported the node unhealthy. Kubelet tried to control the damage with a `SIGTERM` and a `StopContainer` operation, but the kernel was taking its sweet time doing the laundry—reassigning dirty `inodes`—and took over two hours before it could honor the termination requests. The final result was another `NotReady` email from Crusoe—this one, uniquely, downstream of an old CPU kernel.

By the end of our testing, this kernel was not merely old and unperformant: it was officially marked a security vulnerability by CVE-2026-64378, which exploited the buggy writeback behavior, published on July 25 with severity 7.8; a separate 7.8 for this kernel was posted on July 27. Thus, we added the Linux kernel to our collection of Crusoe software exposed to CVEs. Crusoe has informed us that they will be upgrading to a 6-major Linux kernel, a necessary patch.
When we ran our XID injection on Crusoe’s Kubernetes layer, the error was quickly detected and a `Node Replacement` workflow was triggered, but the node could not be put in `drain` due to a mismatch in Slurm naming convention that slipped through Crusoe’s CI. The health monitoring system spun its wheels, repeatedly catching the error and trying but failing to mark the node unhealthy. Crusoe’s engineering team diagnosed the error impressively quickly, rolling out a replacement within hours. However, our replacement node had faulty storage NICs, immediately bringing it into `drain`. This issue persisted after the node’s VM was manually reset. Crusoe’s engineering team has informed us that the failure of AutoClusters to remediate in this latter event was “a known gap,” and that they will be “rolling out auto-remediation actions for this in a few weeks.” This is a surprisingly lethargic response to a basic failure of reliability.
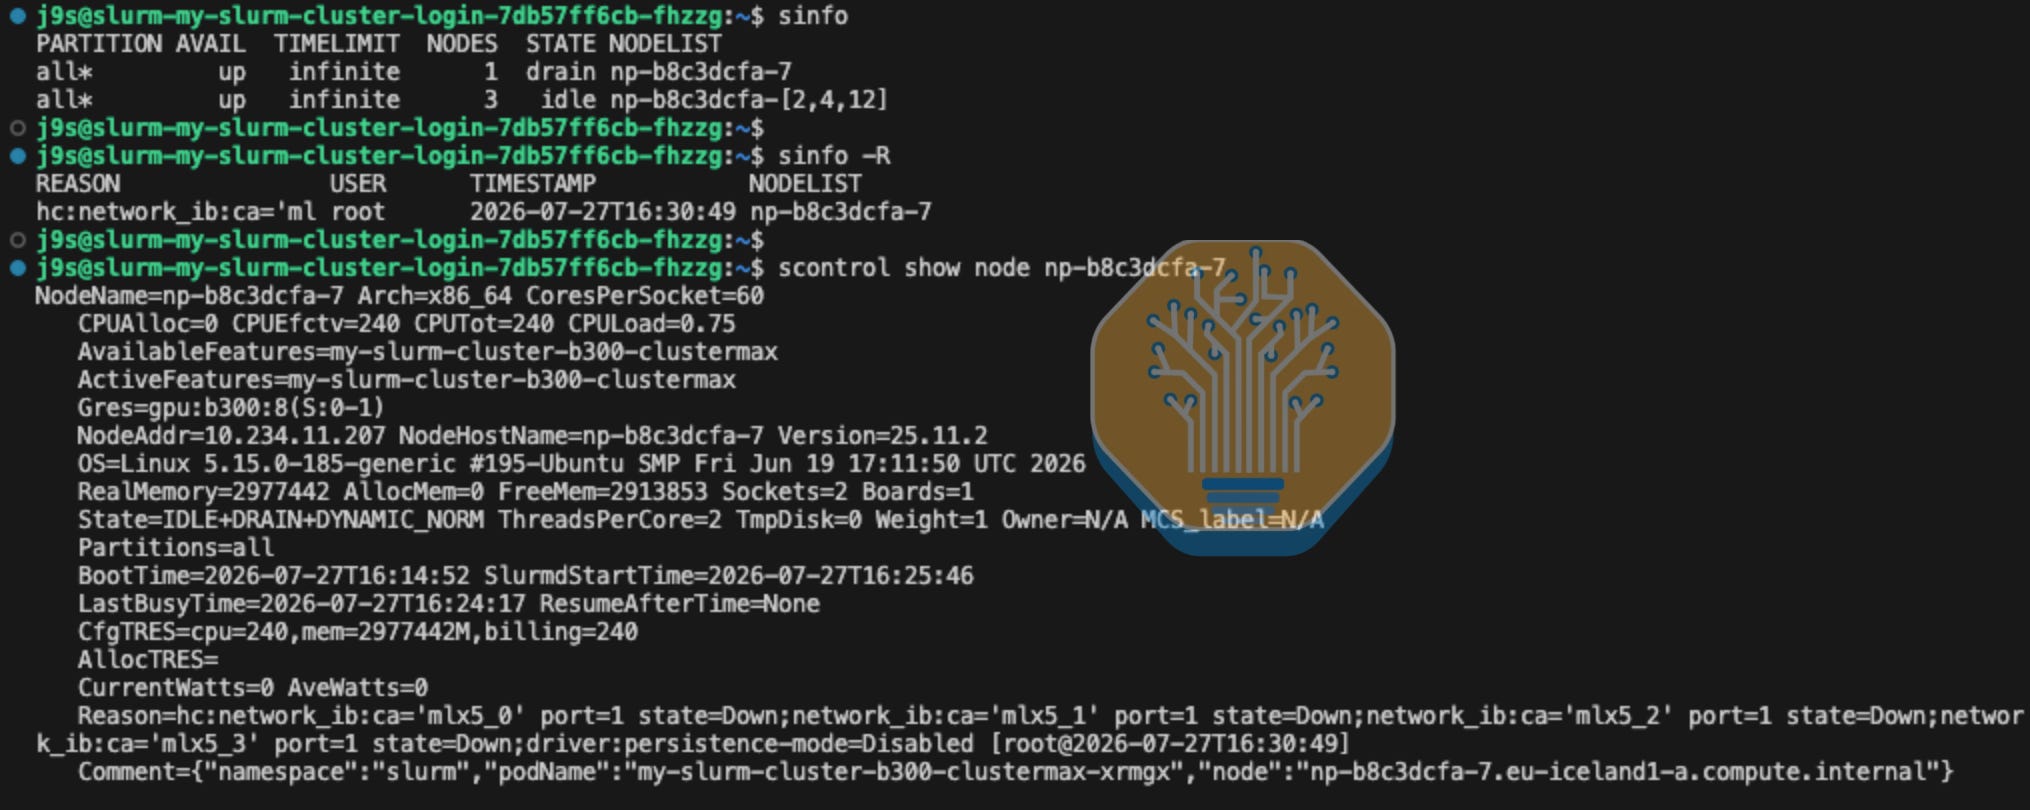
Last and briefly, it bears mentioning that this cluster’s WAN was among the slowest we tested, clocking in between 0.47 Gbps and 0.78 Gbps depending on the context. Iceland has some skinny cables getting off the island.
All these problems add up to a cluster notorious for its flakiness, as confirmed by our friends at frontier labs who complain about both the number of failures and the apparent lack of interest from Crusoe engineers to fix the issues promptly. To be clear, we at one point viewed Crusoe as the #2 neocloud in the world, and as a result the #2 place in the world to rent GPUs. We made recommendations to this effect. Oh, how the mighty have fallen.
But while Crusoe’s machine images are badly due for a refresh, and their engineers can’t get Claude Tags or Codex approved, they do have automations like this set up in their internal Slack:

Does a CVE from November of 2025 count as “historical baggage”?
In all seriousness, this is a problem of priorities, a problem of bureaucracy run amok. We are not sure what to make of job postings like the above one for a senior Linux kernel engineer. Literally, we’re just asking everyone to keep things up to date. You don’t need to hire Linus to understand why this makes sense. So while it’s cool to see Crusoe flexing its muscles and paying top dollar for a good person, it’s not a lack of people or funding or technical skill that has brought Crusoe here in the first place. Our complaints focus on the most basic issues possible, not the Slinky configuration or console or CLI that no doubt take up much more engineering time and that we enjoy using.
We enjoy working with Crusoe’s engineering team and believe they have plenty of talent to improve their standing. Frankly, in the last few months, things seem to be getting back on track. Engineers are locked in, pushing code, and excited about upcoming releases. The Atero acquisition has been worth its weight in gold, skyrocketing Crusoe to the top of many buyer’s lists when it comes to inference endpoint quality. We love to see it.
Still, in the managed clusters business, TCO comes down to goodput, and goodput comes down to reliability, and Crusoe’s clusters are exceptionally unreliable.
Crusoe comes in towards the bottom of our Bronze category for this round.
Prime Intellect
Prime Intellect closed a $130M Series A this July at a $1B valuation, disclosing $100M of “annualized revenue run rate across compute, RL and post-training, sandboxes, inference, environments, and evaluations.”
We tested Slurm and Kubernetes B300 clusters and mostly enjoyed both of Prime Intellect’s orchestration layers, although each was missing a handful of packages we would’ve liked to have. The huge Slurm control plane was nice and snappy, having machines with 2TB of RAM for some reason. Plenty of swap space to run salloc.
After a quick fix to standardize the NCCL bootstrap interface, our networking tests ran up to 13 nodes on the ConnectX-8 NICs with excellent throughput. Storage was no issue, with Weka /data volume performing very well at 4 nodes and scaling steadily beyond. PrimeIntellect’s managed Grafana was one of the nicer ones we encountered. However, we were on a cluster that was still going through burn-in, so we saw a steady stream of errors. An easy way to test the monitoring and health checks on the system!
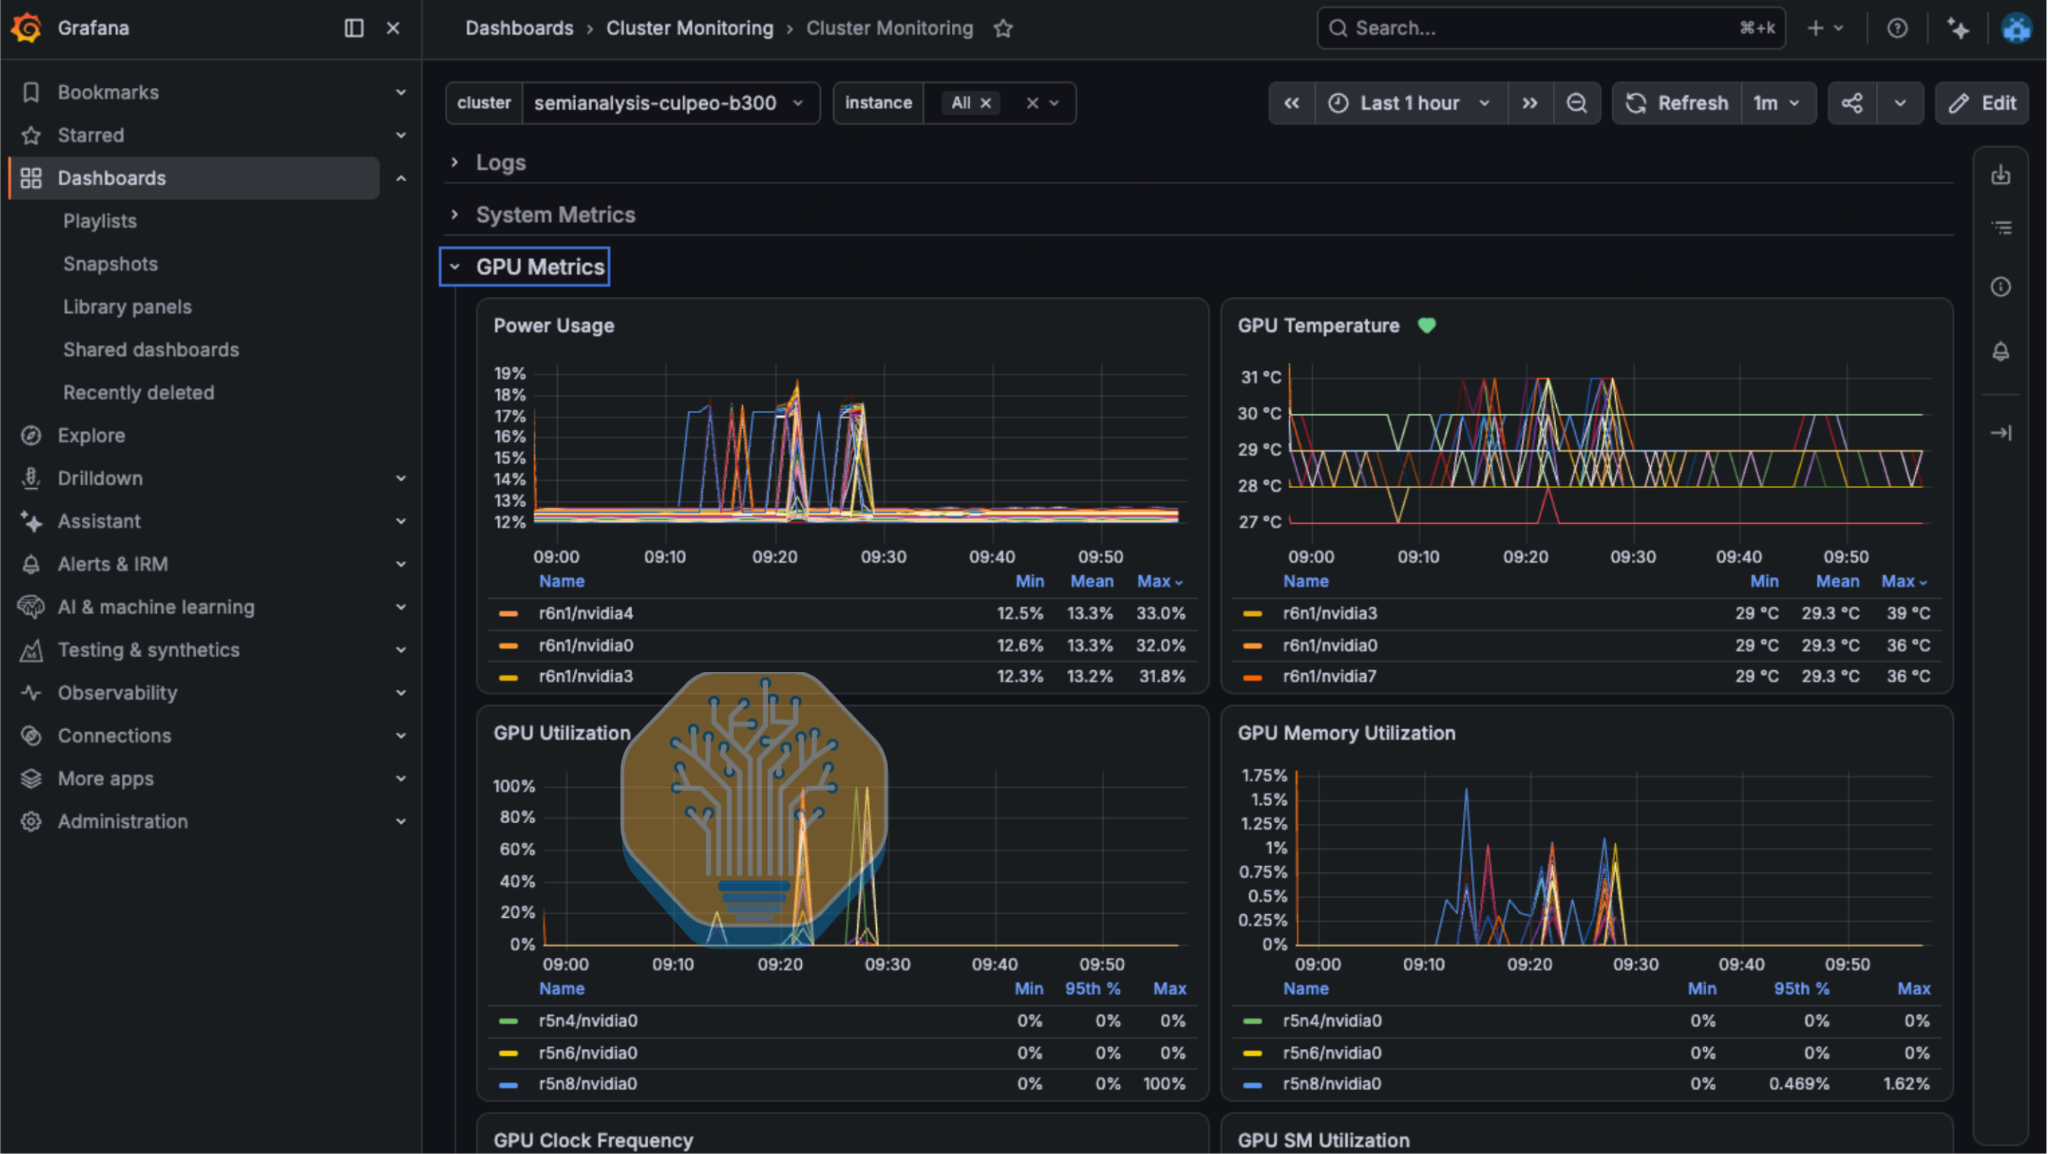
First, a node on our Kubernetes cluster was marked NotReady, apparently due to on-site techs monkeying with adjacent servers; it returned within 5 minutes. Then, during a PyTorch networking test, a different Kubernetes node stopped posting kubelet status and the distributed job could not complete; the node came back after a reboot and the job completed. The next day, 2 Slurm nodes went down, one with NVLink issues and the other stuck after a reboot. Both returned promptly after intervention, but the latter was soon back to its shenanigans with another surprise reboot, causing a storage test to fail. An MPI test aborted in its last phase, and the corresponding Slurm job remained in COMPLETING as all workers remained unreachable in the brief period before we handed the cluster back.
All of these reliability issues can be blamed on the fact that we got on this cluster in a small window while they were still doing burn-in for a paying customer. Fair enough. But the lack of compute at Prime’s disposal that would allow them hold back hot spares points to a bigger problem of growing capacity constraints. Prime is a reseller of other’s compute, and depends on their underlying providers to guarantee customers with a high quality experience. This comes with challenges that high quality training/RL frameworks, dashboards, and maniacal Slack engagement from a cracked team of engineers can’t always cover up.
With that said, Prime’s health checks performed impressively throughout, quickly intervening and limiting the damage of each error. We thought the system’s default responses were sensible and even liked the Slack alerts, which the team promptly followed up on. Given that Prime gets its capacity from a number of providers, the quality of their software layer is important for labs to feel comfortable with what they’re getting. Of the marketplaces we’ve tested, Prime seems to be the best.
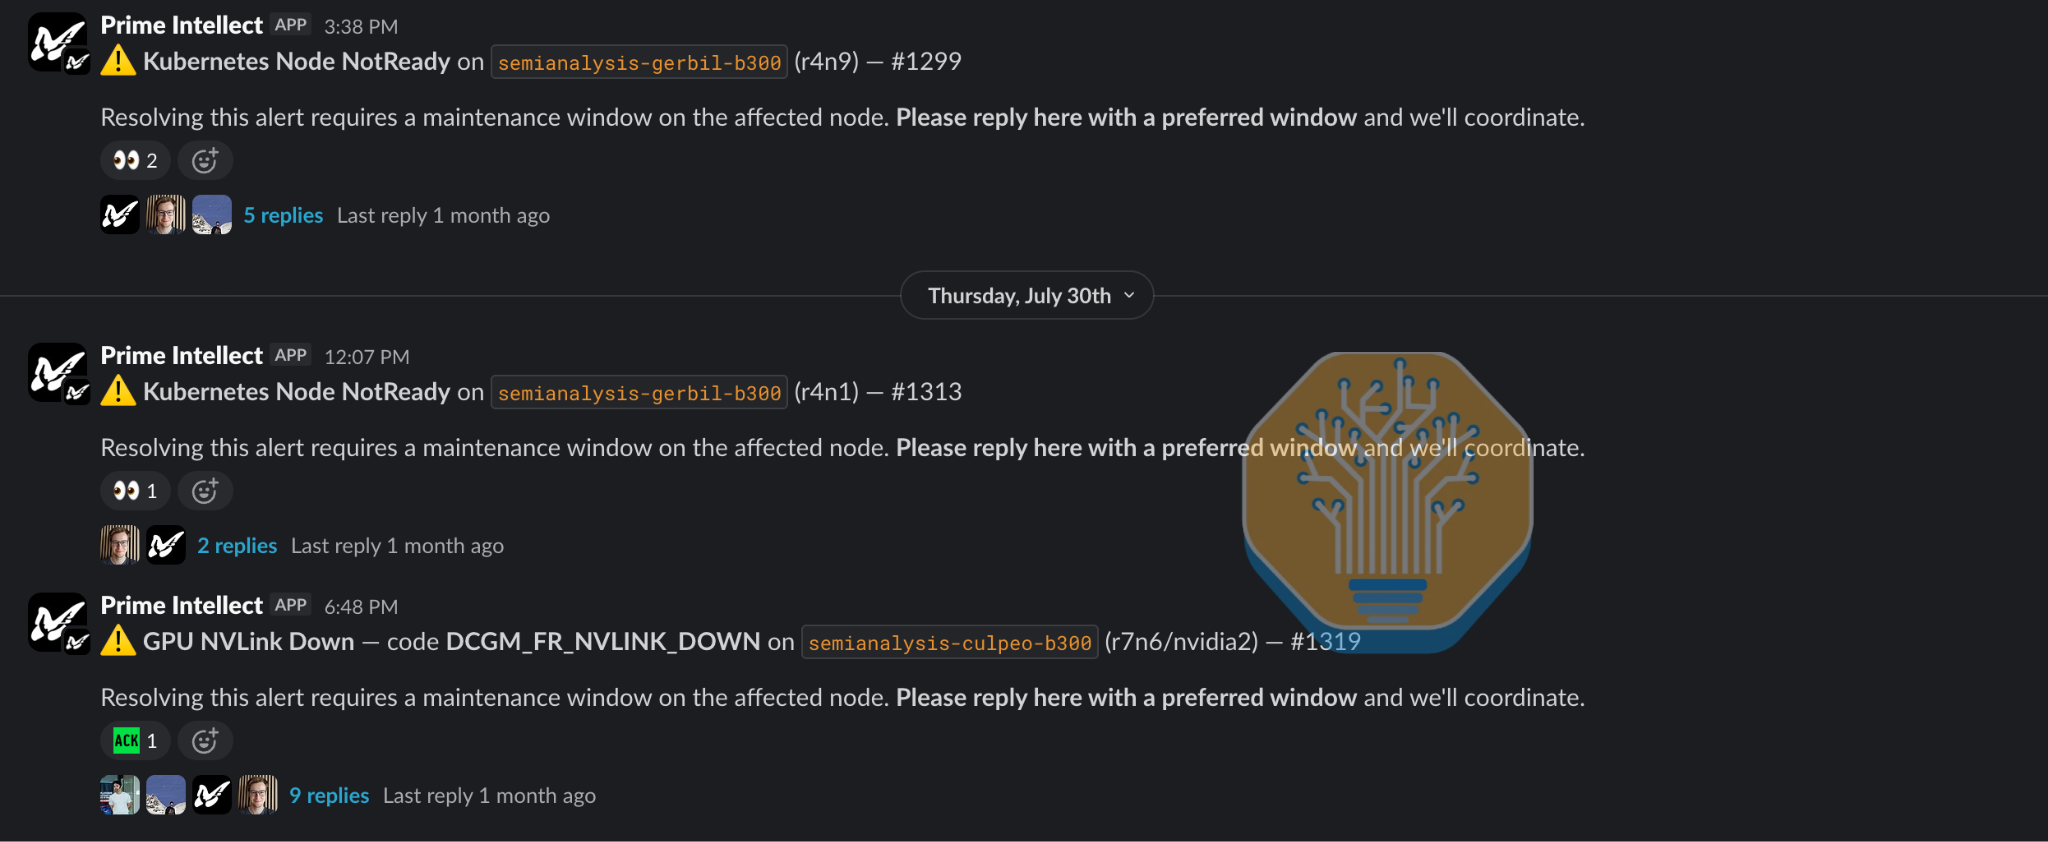
This leaves Prime Intellect with a straightforward assignment, and one that we cannot have direct insight into: improve reliability, build a base-load of compute capacity, and rise in the rankings as a true neocloud. We have no doubts about the team’s technical ability; they have done a lot of hard things correctly on this cluster, and are the only provider on this list that injects real experience training models into their approach to software and support. For better or worse, their work elsewhere is much more impressive than the bread-and-butter managed compute offering evaluated here.
We got a preview of their hosted training product during this period and are very impressed. RL infrastructure is decidedly more complex than a simple managed Slurm or Kubernetes cluster, since its built on top of the same foundation but with three components that need to stay in sync:
Training
Inference
Sandboxes/environments
Coming soon, we will be evaluating hosted training infrastructure providers and RLaaS companies for hire through a project provisionally called PostTrainingX. If we had to put out an initial cut at those rankings, Prime would be in the hunt for Platinum! Stay tuned.
DigitalOcean
This marks the first round of testing that we have been able to get the full DigitalOcean developer experience. Marketing itself as “the first cloud built end-to-end for the inference and agentic era,” DigitalOcean distinguishes itself from “bare-metal focused neo-clouds and inference wrappers that lack cloud platforms.” In fewer words: DigitalOcean sells, among other things, managed clusters.
DigitalOcean’s managed clusters are orchestrated by Kubernetes, which proved solid but slightly immature. Their onboarding doc asked us to install Multus ourselves, then create network attachments, install MPI Operator, and create the MPIJob manifest. There’s no reason not to set this up for the customer in advance. Once configured, our cluster performed well, hitting all the standard benchmarks for compute and XDR networking, and completing burn-in without incident. The cluster also lacked a RWX StorageClass out of the box, adding another basic setup step that the better K8s providers handle for you. Once the storage was configured, its performance was interesting: sequential writes were approximately 6x faster than sequential reads at several different client counts, the inverse of what we see on most clusters. We expect that DigitalOcean’s sequential read performance could be significantly improved with retuning.
When we went to test the health checks, our first XID injection went unnoticed: the monitoring system did not detect anything, and the node remained available for scheduling. When we alerted the DigitalOcean team, they responded promptly, found the bug in their system, and asked us to reperform the test later in the week. The second try went smoothly, and we had a fresh node 50 minutes after injection.
When a neocloud is “built end-to-end for [...] inference,” that means it doesn’t offer Slurm. The DigitalOcean team helpfully offered us a runbook to stand up Slinky, and it got the basics right, but would require significant work before it could be considered production-ready. No SSH access, nor, as mentioned previously, any RWX volume by default, which means that there is nowhere to keep a `/shared`. Anyone who plans to run Slurm on DigitalOcean should expect to stand up their orchestration themselves.
DigitalOcean will be adding 60 MW of capacity throughout 2027, and, aside from its managed K8s, it has an interesting selection of GPU services like Droplets and bare-metal Hopper and MI300X that fall outside the scope of ClusterMAX testing. But no plans for GB’s or VR’s from what we can see at this point. We look forward to the team continuing to improve its managed Kubernetes service the next time we test.
Hyperstack
Hyperstack, under parent NexGen Cloud, is a UK-based neocloud that advertises Kubernetes clusters in the US, Canada, and Norway. It recently raised $45M at a $354M valuation with plans for many AI new products for “full-cycle development.” As it announced a $34M debt facility to build out a B200 fleet, it also disclosed plans to deploy 4,500 B300s later this year and for an additional 56 MW online in 2027.
The managed Kubernetes cluster that we tested marks significant progress since ClusterMAX 2.0, and a solid foundation for its continued growth. Compute and networking tests were up to spec, and burn-in sustained good numbers with no hard errors. Our Kubernetes node-reboot recovery was quick, and we had no trouble mounting and unmounting PersistentVolumes. The N/S network was fine, and storage was good enough, although we were not able to get Weka and VAST, which Hyperstack usually offers, on our timeline.
Our synthetic XID was detected in under a second with a `NvidiaFatalXid=True` flag. The test was awkward as Hyperstack had no extra capacity, so we had to take a node out of our fleet to simulate a spare. The support team notified us that they had detected the error 12m after we injected it, and our spare rejoined the fleet after a total of 52m. Interestingly, at this point, the “sick” node was still not cordoned, which took until 1h30m to register on the Kubernetes layer. This was all driven by manual intervention by Hyperstack’s SRE team after our synthetic error triggered Grafana alerts.
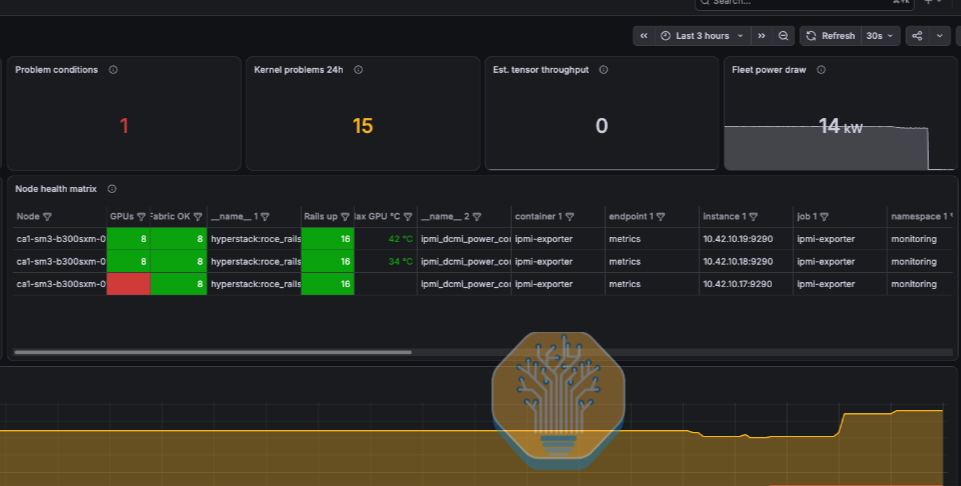
Overall, this test was a success, and we appreciate Hyperstack’s commitment to helping it go smoothly. However, as the team is aware, the amount of human support required makes us worry about its replicability. Hyperstack offers 24/7 support and targets intervention in under 60m in the event of single-node failure, but it’s better not to have to count on another engineering team pushing the right buttons before your cluster gets back to full health.
The only outright error during our testing was that two pods, `cilium-envoy` and `csi-hyperstack-node`, crash-looped with `Too many open files`. This was a minor annoyance and did not affect our workflows.
We look forward to continuing to work with Hyperstack as they grow their team, gain experience managing larger clusters, and continue to automate and harden their infrastructure.
Participation Ribbon
Vultr
Vultr advertises itself as “the world’s largest privately-held cloud infrastructure company,” which they are not, and “the world’s largest privately held hyperscaler,” which they wouldn’t be even if they were. Still, they are a relevant player in neocloud land, with modern GB300s and MI355X including a claimed 50 MW AMD site in Ohio. In ClusterMAX 2.0, Vultr’s cluster was delivered with a handful of basic errors. Unfortunately, the pattern is the same almost a year later.
The images that Vultr built for our testing had many libraries with applicable CVEs, including CUDA, DCGM, Docker, runc, and ConnectX firmware. Our Slinky login pod did not mount `/shared` and lacked the Pyxis plugstack config, so we had to orchestrate from a worker pod until the Vultr support team reprovisioned the login pod mid-campaign, fixing both issues. There was another basic problem with the storage visible from the K8s layer: the default storage configuration was incompatible with our bare-metal cluster. The default StorageClass, `vultr-block-storage`, provisioned and bound without complaint, then the pod sat in `ContainerCreating` forever. However, the Lustre tier, which came attached to the worker nodes, was excellent, achieving 91.7 GB/s aggregate read across 32 clients. Grafana was configured but only partially correct, as NVLink read 0 due to unconfigured `DCGM_FI_PROF_NVLINK_*` fields.
Vultr is known to have been experiencing issues with the reliability in its scale-out networking, which has discouraged partners from beginning or expanding existing deals. We recommend that Vultr continue to improve the sturdiness of its clusters and work to create golden images with all relevant utilities and orchestration reasonably configured and up to date.
Vessl
Vessl is a new Korean neocloud who fancies itself a “multi cloud orchestrator” rather than a broker, buying bare metal long-term and providing a management layer with SLAs on top. They claim 5,000 GPUs currently in operation and have an ambitious target of 100 MW by the end of 2027. An old Vessl BizOps job posting says to expect “Speed. We MUST move fast, learn fast, and iterate constantly,” demanding “a minimum of 60 hours per week.”
We love the ambition; however, the immaturity of Vessl’s cluster, which we sampled in its Kubernetes and Slinky flavors, gives them plenty to work on. Our onboarding began with a notice to pin three settings to render the RDMA fabric usable. A heads-up is better than nothing, but we much prefer to be given a cluster that performs well out of the box.

The third bullet was in response to a particularly cumbersome configuration: by default, due to Vessl’s Kubernetes `LimitRange`, each container would hard-fail if it used more than 2GB of host memory. Although a defensive default might make sense in certain cases, this is a poor setting. Nodes rarely are called on to run more than one job at a time, so containers can expect to have all of the host DRAM to play with—hundreds of GB—and OOM-killing them for going above 2GB is stifling. We recommend that Vessl relax this limit, bringing it in line with the physical capacity of the host while also making failure more graceful.
In terms of management, Vessl provided no way to handle users on the Slinky layer except via traditional Linux tools on the machine. The SSH key we added from the console did not show up on the cluster, nor did the one we added via the Vessl CLI; we later learned that these utilities are independent of Vessl’s Blackwell clusters. We could therefore use only the private key and `kubeconfig` DMed to us on Slack.

The cluster provided a reasonable (though strange) `add-user` convenience script to make new Linux users.
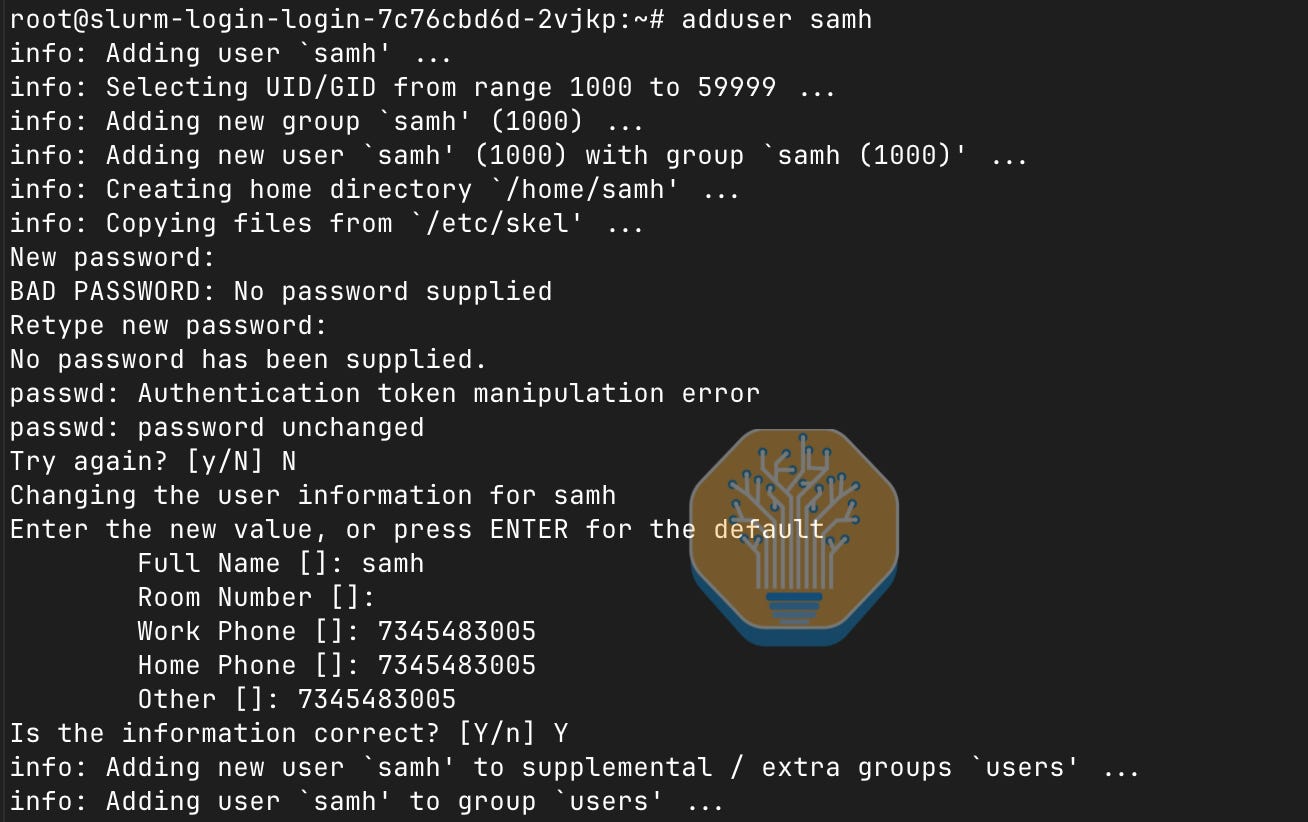
It did not provide, however, basic packages like `pip`, `git`, or even `sudo`.



The cluster therefore took some work to get to the starting line. But our intern was still not done putting in reps as Linux sysadmin. Vessl ran the Slurm login node with an ephemeral OverlayFS root, so runtime changes to `/etc/passwd` and `/usr/bin` existed only in the container’s writable layer and were not preserved when Kubernetes recycled the pod. This caused our users to disappear midway through testing.
Another Slinky misconfiguration brought down the Slurm layer for part of testing. Our workloads wrote to an overlay that they did not clean up, accumulating 863 GiB in the root volume, causing Kubernetes to mark the node `DiskPressure` and restart it. This not only brought down the local worker, but the Slurm controller daemon as well, rendering the whole Slurm layer intermittently inaccessible. We infer that `slurmctld` was scheduled on to a node also running `slurmd`. Co-scheduling a `slurmd-pyxis` pod with a `slurmctld` is generally a bad practice for reasons well illustrated by this anecdote: the data plane should not be bogged down by the administrative duties of the control plane, and the control plane should not be within the blast radius of the data plane. Vessl quickly stopped the bleeding by having Enroot write to a larger volume, but to our knowledge the root cause—the co-scheduled worker and controller—remains unaddressed. It is clear that Vessl does not have experience running Slinky at scale in production.
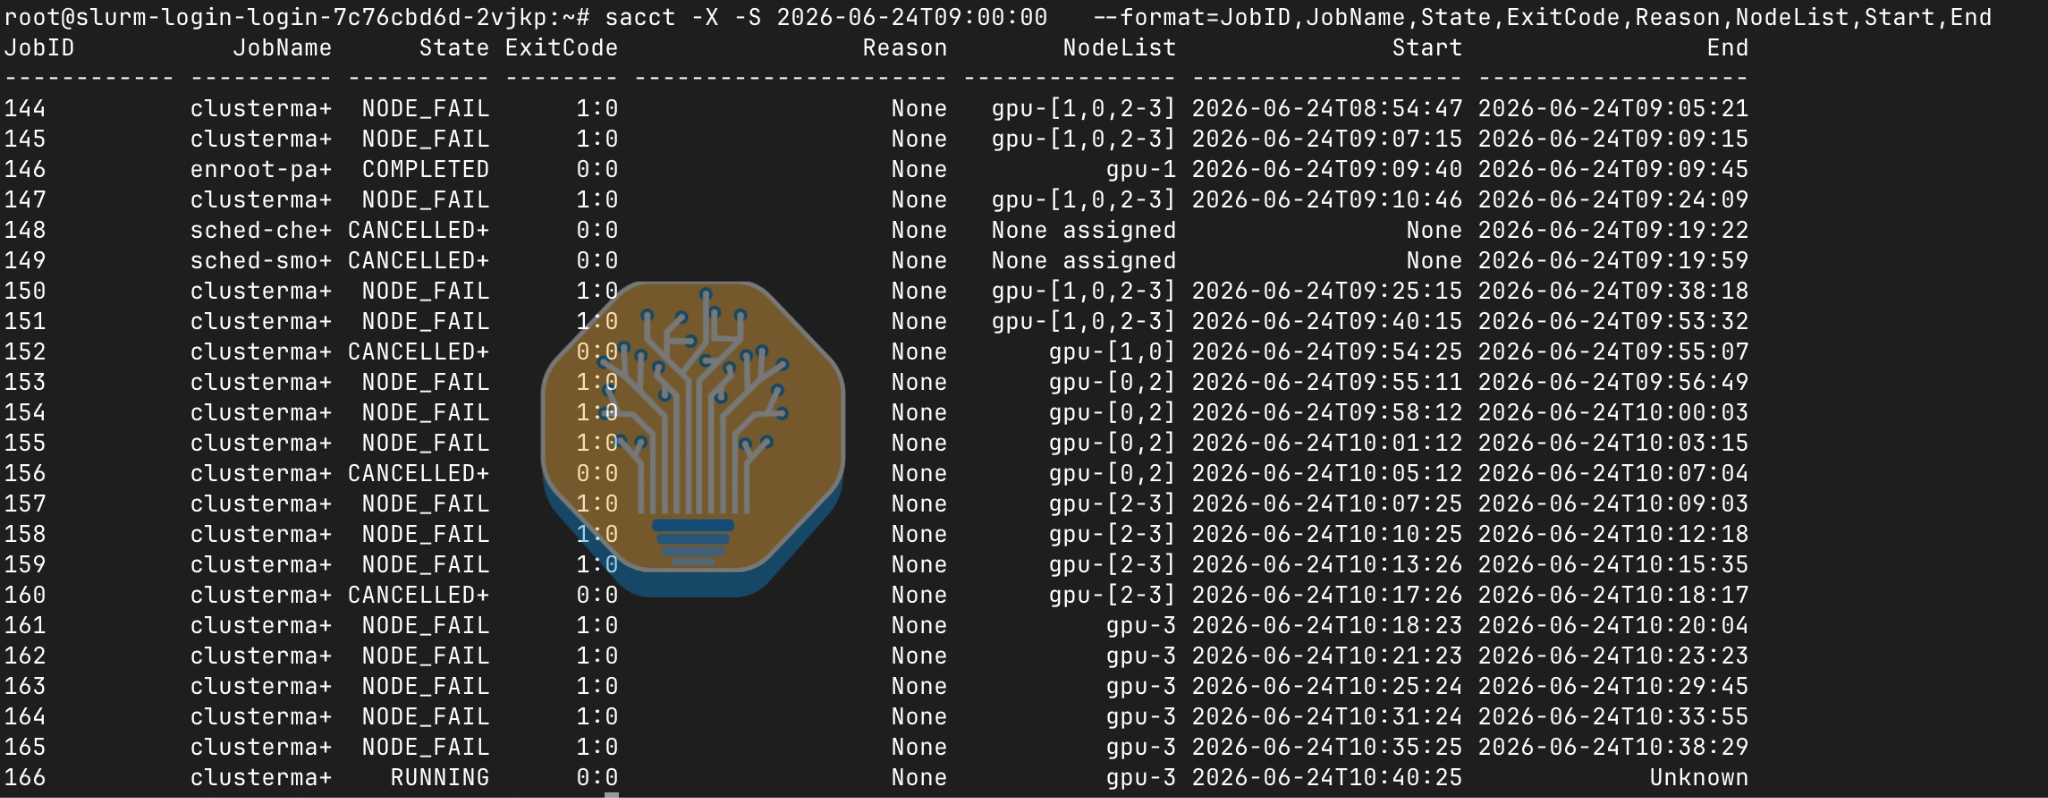
A separate error made Kubernetes access inconsistent. The URL in our `kubeconfig`’s `server` field did not always resolve to the same IP address: Vessl had erroneously published the private `10.x` IP to the record set in addition to the public one. Sometimes our `kubectl` command resolved to the right (public) IP, and we could access, but other times it would resolve to the wrong one and our request would hang until a retry went through. We recommend that Vessl remove the `10.x` IP from the public record set.
The `NetworkPolicy` we set on the Kubernetes layer of our Vessl cluster was accepted but not enforced, as HTTP requests between all tenant pods were accepted without regard to defined rules. Vessl did not have a health check program configured and should prioritize this along with all the mundane “quality of life” features indicated above.

The hardware itself that Vessl offered performed well throughout testing, including on NCCL tests over InfiniBand. Given that it has such a large fleet advertised as coming online soon, Vessl has every motivation to harden its offering, providing superior services to its users and enabling it to command superior prices. We will be interested to observe Vessl’s progress when we next test.
Runpod
Runpod is a neocloud headquartered in Moorestown, New Jersey with a fleet including RTX PRO 6000, H100, H200, B200, and B300. This June, they raised $100M at a $1B valuation, announcing on Twitter that their revenue doubled to $240M ARR from February to June.
The cluster we were able to test was in Seattle, and was so new that it did not even have storage configured yet. Our “Instant Cluster” was just about instant, spinning up in under 2 minutes.
Runpod’s user model is unusual. In an ideal world, we manage permissions via a web console with RBAC, where we can add our team members by email, increase or decrease privileges, make groups, and drop in our SSH keys to be automatically synced to the cluster. Instead, taking advantage of its snappy provisioning, Runpod recommends minting Instant Clusters as needed. Engineers then operate their cluster with a single tenant and return them to the pool when finished. This means that budgeting, monitoring, and other such policies are handled above the cluster level, rather than via traditional tools like Linux user management or Slurm accounting. Runpod’s design choice is viable, but it is revealing we did not end up using the cluster in the suggested manner, preferring to fall back to the more familiar pattern of making Linux accounts tied to our SSH keys.
Our first burn-in failed as one of our nodes had port 1 links go down on two NICs, suspected to be due to an issue with a leaf switch. There was no health check to catch the error, but there was a Grafana dashboard that highlighted the error if you know where to look. With our feedback, the Runpod team quickly improved the dashboard to make InfiniBand state easier to spot.
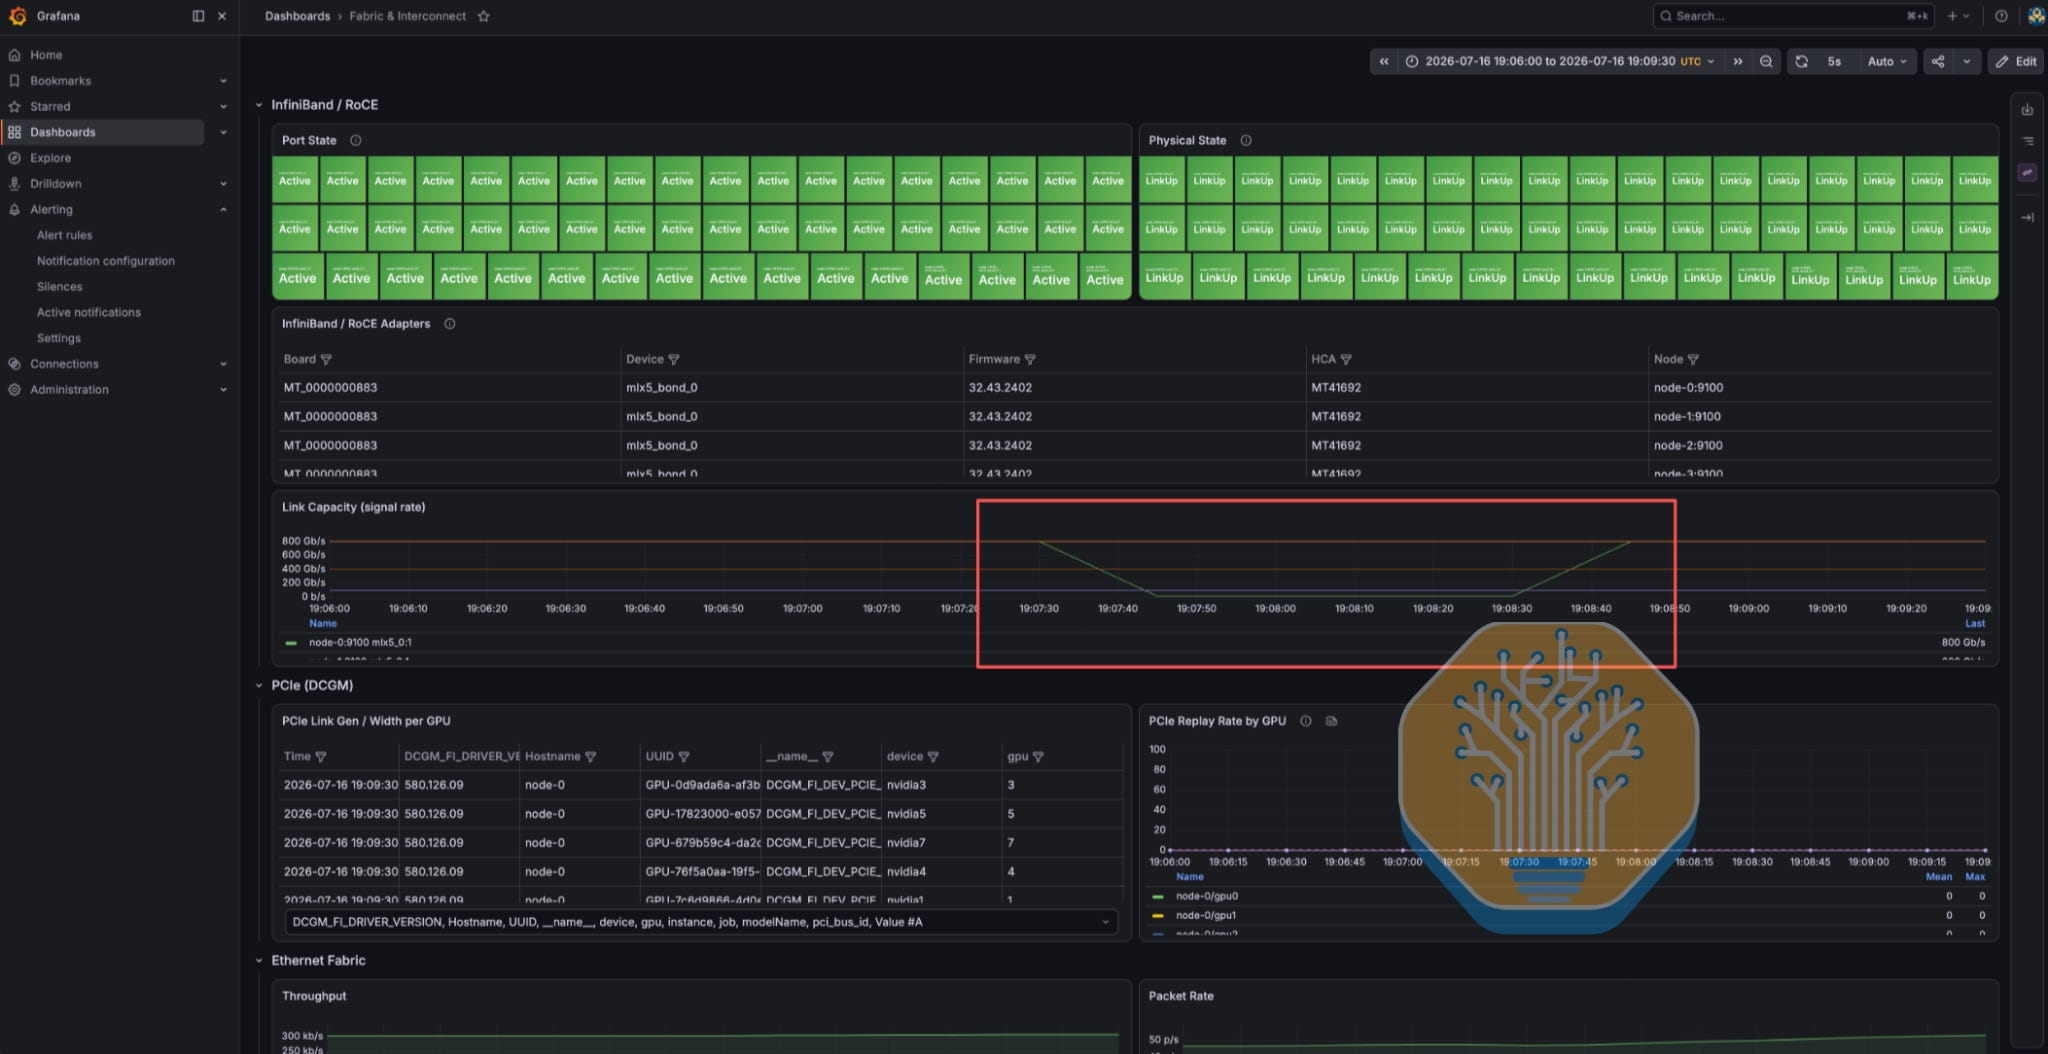
On the second burn-in attempt, the networking performed well and the test completed without error.
The cluster was so new that there was no shared filesystem to test. On the software side, though, our initial audit found many things to be improved. The CUDA Toolkit, GPU driver, and NIC firmware were deprecated for security reasons, and the CUDA Toolkit was additionally a liability because 12.8 does not support SM103, the B300 SM architecture. This caused some of our benchmarks to fail on the first try. The cluster was also missing lots of expected tooling, with no container runtime and many basic HPC packages absent. Slurm also occasionally marked waiting jobs as `InvalidAccount`, which prevented jobs from running, even though `AccountingStorageEnforce=none` and `AllowAccounts=ALL`. The workaround was to spam `scontrol update JobId=<jobid> Account=me` until Slurm accepted.
We also saw a node drained when an image extraction filled our 50 GB root overlay, which was shared with `/var/spool/slurmd`, leaving `slurmd` unable to write. Our tenant lacked credentials to `scontrol update`, so our testing continued shorthanded. Separately, Linux rejected `unshare -Ur`, so we had to run with `udocker` instead. Our standard XID injection route was blocked because we lacked permission to write to `/dev/kmsg`; we had no mechanism to issue node reboots; passwordless `sudo` was not enabled by default. The theme here is clear: within the Runpod environment, users lack many permissions they need to get their work done.
We find the Runpod team unusually receptive to feedback and eager to explain their decisions. We like that the majority of their job postings are in serious engineering roles, and we hope they continue to work to strike a better balance between ease of access and developer control.
Bitdeer
Bitdeer was a new inclusion in ClusterMAX testing as of ClusterMAX 2.1. Yet another crypto miner pivoting to AI, Bitdeer already has an impressive 1.75GW in total electrical capacity according to its most recent announcement. However, this mostly feeds cryptocurrency mining rigs: our SemiAnalysis Datacenter Industry Model estimates they only have a handful of AI MW online. Still, Bitdeer is steering hard toward the higher-margin GPU business, with hundreds of MW already in the pipeline over the next couple of years as it works on sites, either converted or now, in Knoxville, Wenatchee, Fox Creek, and Rockdale, as well as in Norway and Malaysia. Hoping to grow its business vertically as well as horizontally, Bitdeer is not content with mere colo deals, with fledgling offerings from token-as-a-service to managed agents to, of course, managed clusters.
We spent a lot of time trying to figure out what exactly Bitdeer expected us to test when they gave us credits on their public console. Health checks were not set up, the monitoring dashboard did not work, many basic libraries like PyTorch and Docker were not installed, networking settings were empty, IMEX was not configured, and the console did not support ordinary conveniences like RBAC. Bitdeer’s monitoring installer downloaded a binary for the wrong CPU architecture. SSH worked eventually, but oddly required an RSA key rather than ed25519. Kubernetes queries repeatedly lost their connection. In short, the management of this cluster was strictly nominal. The most that can be said is that it had GPU drivers, NCCL, CUDA, and an OS and kernel, and that all were sufficiently modern.
Once we had the time to set things up, performance was fine. GPUs hit expected numbers on burn-in and NVLink supported the expected traffic.
However, the cluster’s WAN performance was exceptionally bad, averaging around 0.1 GB/s across several tests. The cause of this poor performance is unknown to us; needless to say, it would be an impediment to real-world usage.
Most of all, getting support was a massive pain. The entire technical team was based in Asia (Malaysia, or Singapore in our case), which meant 8-12h TAT when we were trying to troubleshoot issues. It was impossible to consider Bitdeer for anything other than this tier.
We look forward to seeing Bitdeer’s improvements in future rounds of testing as its managed cloud offering matures and it implements features like health checks and managed Kubernetes. It will be interesting to see where Bitdeer allocates its time and attention, as management has unambiguously announced that its neocloud business is not its main focus: “Executing on colocation lease agreements is THE top priority.”
Shadeform
Shadeform continues to focus on brokering and small scale marketplace reselling of individual GPU VMs with a small team. We enjoy the interface and working with the Shadeform team, but without more ambition they will stay in our lowest tier.
Radiant
Radiant was formed after Brookfield acquired Ori, a UK-based neocloud that we discussed in ClusterMAX 2.1. Unfortunately we have not been able to test a working, secure cluster. Despite almost a year of planning, along with quite a bit of marketing effort, and announcements that mention Billions and Gigawatts, Radiant is yet to deploy a Blackwell GPU.
FPT
FPT suffered from a number of security issues during our testing, which we described in ClusterMAX 2.1. We have yet to re-test and are not aware of any Blackwell capacity.
Core42
Core42 is a dark horse in this category. They have a solid team, allocation of GPUs, political backing, and an infinite money glitch in the form of Mubadala. We expect to see them put the pieces together and rocket up the rankings as they enter the US market.
Latitude
Latitude is making progress to keep their modest cloud business afloat, being recently acquired by Megaport and as a result going public. We had the chance to test some RTX Pro 6000 Blackwell servers, but as long as Latitude is missing the latest and greatest GPUs, we expect them to be stuck in this category.
IBM Cloud
We have not had the opportunity to re-try IBM Cloud since our horrendous experience in ClusterMAX 2.0.
BuzzHPC
Buzz is making waves in Canada, latching onto the Sovereign AI wave associated with the Carney vs Trump showdown, to the tune of 1.2GW and $50B in Saskatchewan, in partnership with Bell and others. This is quite the complement for their 300MW+ elsewhere in the country. BuzzHPC is one of the many public companies on the ClusterMAX list, via parent company HIVE Digital Technologies Ltd. Unfortunately, all the GPUs that we have tested from Buzz were in clusters of questionable quality, relying on questionable software vendor partner choices. We have not had the opportunity to re-test since ClusterMAX 2.0, but we hope this changes in the near future.
Neysa
Indian neocloud Neysa announced a $1.2B in financing this February, including $600M equity and $600M debt, in a round led by Blackstone that left them at $1.4B post-money. They claim “9,216 air-cooled NVIDIA B300 staged between December 2026 and March 2027,” with an equal number of AMD MI350X in the pipeline as well. Impressive growth, and clearly the leader in India in this regard.
This round, our testing unfortunately revealed a cluster that was riddled with errors. Many software packages that came pre-installed during cluster provisioning were months or even years out of date, with several serious CVEs applicable. CUDA Toolkit 12.0, for example, was released in December 2022, making it older than Neysa itself. Somehow this was installed on our cluster at /usr/bin/nvcc.
We enjoyed working with the Neysa team and encourage them to continue to improve their security posture and shore up their fundamentals as their capacity spikes and the bring on large customers from abroad. While current Neysa customers are mostly stuck on the Hopper generation, with a few B300s available, they are no GB’s (and, as a result, no direct liquid cooling) that have made it to production on the Indian subcontinent.
Vast.ai
A reseller/marketplace that keeps coming up in customer conversations for random GPUs on-demand, representing one of the better partnerships teams in the industry, finding unused capacity all over the world. Unfortunately, the UI is just terrible, so hard to use.
Hyperbolic
We haven’t had the chance to re-test Hyperbolic since the last round, but they got a basic security compliance attestation done finally! Hyperbolic moves onto the list.
STN
STN has been very confusing. One of the earliest clouds to deploy B300s, and one of the only providers with an option for “private cloud”, where customers take care of procuring the cluster themselves, and keep the chips on their balance sheet, but STN takes care of cluster operations. We hear from multiple customers how they enjoy this arrangement and prefer it over price gouging neoclouds.
We’ve always enjoyed working with the STN team, but unfortunately each of the last three times we’ve engaged with the team, we have run into some performance, reliability, or configuration issue, asked for a fix, been promised a fix, not gotten the fix, and then time has run out.
We regrettably keep STN in this tier until we can see a complete end to end testing experience as the customer would experience it.
Not Recommended - Underperforming
Based on hands-on testing, these providers can quickly rise to Bronze by fixing one or more critical issues, such as offering only older GPUs, missing basic security attestation (SOC 2, ISO 27001), misconfiguring key server features (leaving PCIe ACS enabled, or failing to enable GPUDirect RDMA), or charging for GPU hours during cluster creation or hardware downtime.
SharonAI
Sharon AI is an Australian neocloud that claims 132MW in its pipeline, with 116MW already contracted out, against a current footprint that we estimate around 4 MW. They do not have SOC 2 or ISO 27001. We were able to test 2 bare metal H200 nodes to verify basic functionality. We look forward to testing Sharon AI down the line as their offerings mature.
IREN
IREN continues to come up in our conversations with neocloud customers, and usually for the wrong reasons. They’ve got rock bottom prices on HGX B200 and B300 GPUs in Prince George and Mackenzie in Northern BC, Canada, and we’ve heard the stories. Multi-day power outages, network upgrades, storage failures, air quality controls leading to link flaps, XID’s everywhere. The #1 worst site in the industry according to users. And we are some of their users, as we’ve gotten to test IREN GPUs from multiple providers that resell their capacity. A lot of our users that aren’t having an good time that we are hearing from aren’t renting from IREN resellers but IREN themselves
With that said, the new builds in Childress and Sweetwater look much better (read: not N+0 power, cooling, and ISPs!). We’ve covered plenty about these sites in our Datacenter Model, suffice it to say that despite all the technical shortcomings in their cloud services, we expect the $2.1B investment from NVIDIA will help them cut less corners this time around.
We recommend that IREN stop pretending to offer managed clusters and inference endpoints in public marketing and investment materials, and focus on their bare metal offerings, where there is plenty of market demand for their services.
Hydra Host
Hydra Host raised a $100M Series A in June 2026, with NVIDIA among its backers. They are focusing on brokering deals, and our earlier testing is all we have to go on for managed cluster experience. We need to test a real managed cluster before considering an upgrade.
FarmGPU
We couldn’t make much progress in our testing of FarmGPU. The Slurm layer did not advertise GPU resources properly, while Kubernetes did not expose any RDMA devices for scale-out networking.
With that said, we very much appreciate FarmGPU’s open development culture, including their solid Grafana monitoring experience and detailed notes on provisioning. We find the technical team to be trustworthy and solid to work with, even if they are stretched too thin just trying to get a few small clusters deployed correctly.
WhiteFiber
WhiteFiber raised $159.4M gross at its initial IPO closing in August 2025. Our prior testing found good network performance but unusable Slurm/Kubernetes integration and weak job monitoring. More recent customer feedback suggested improvement, though the ephemeral Slurm login filesystem remained a concern. We need to verify that these operational problems are fixed.
PaleBlueDot
PaleBlueDot raised a $150M Series B led by B Capital in January 2026. We previously found its marketplace easy to use for individual VMs, but it lacked a complete managed-cluster experience. Unfortunately, they have shut down their on-demand console in favor of serving some big customers in dedicated datacenters.
Akamai
Not much has changed in the last year at Akamai/Linode, with single-node GPUs being the focus and no managed Slurm or Kubernetes available. We’ll keep watching to see if this sleeping giant wakes up anytime soon.
Hetzner
Hetzner’s low-cost hosting model still provides some cheap PCIe GPUs, specifically the RTX 4000 and 6000 Pro Blackwell Edition. We’re waiting to see if they take the plunge with anything bigger, building on all their datacenter operations experience to really serve the AI market.
Mithril
Mithril, formerly Foundry, announced $80M in funding back in 2024 to “restore the promise of public cloud to AI”. Today, it’s a marketplace wrapping 3 Nebius availability zones with H100 or H200, though only the H200’s have an option with a scale-out network.
There were some announcements about TPU support that we were quite excited about, but that partnership seems to have been scrubbed away.
OVHCloud
OVHcloud has substantial infrastructure globally, operating in tons of datacenters globally, some of which are shared with top neoclouds on this list. But our concerns remain that general purpose IaaS is not the growth engine of the AI age with companies doing crazy things to get access to the latest and greatest. Another sleeping giant.
Massed Compute
Massed Compute last announced capital raise involved up to $300M in equity and revenue-share financing from Digital Alpha in August 2025. They have used this to drive reasonable growth for a bare metal business, but that alone does not cut it on the ClusterMAX rating system, especially since their slop cannon chatbot is still getting indexed by web crawlers.
Not Recommended - Unavailable
Our “Not Recommended - Unavailable” tier is the same as ever, but to clarify, for this section we include four types of companies:
Those that we have previously tested who now claim to have zero spare capacity and/or refuse to test with us. This includes Fluidstack, Cirrascale, Lightning AI (recently merged with Voltage Park), Scaleway, CUDO Compute, Denvr Dataworks, and Atlas Cloud.
Those that are yet to launch, yet to be tested, and are generally interesting to us, though we believe some unnamed of this bunch are misleading investors (i.e., lying) by claiming in public marketing materials that they do managed clusters when they really just do bare metal. This includes SpaceXAI, Mistral, Poolside Infrastructure Company, Nscale, Highrise, Corvex, Andromeda, Volta, Firebird, Tatra, Sesterce, Yotta, Boostrun, GlobalAI, Argentum and Qumulus.
Those who are big and important, but who we cannot test properly due to geographic or regulatory concerns. This includes Alibaba Cloud, MegaSpeed, BytePlus, RunSun, SK Telecom, Naver Cloud and Indosat/Zankore/Lintasarta.
Those who are too small to be relevant. These are still covered in our market view, but not part of the rating system.
Fluidstack
Fluidstack has (currently) exited the managed clusters market, as far as we are concerned, because their focus has shifted from managed Nvidia clusters to bare-metal TPU deployments at 100K+ chip scale. We look forward to testing with them again in the future, with whatever chips they may offer at that time.
Cirrascale
Unfortunately, after receiving a legal letter to modify our previous article’s description of our experience working with Cirrascale, we have not been able to establish a productive working relationship.
Lightning (merged with Voltage Park)
Following the merger of Lightning and Voltage Park, the combined company has unfortunately run out of GPUs, and we haven’t been able to test the reconciled products. This is despite the company consistently advertising that they are the 3rd biggest neocloud in the world in terms of GPUs deployed. They are not in the top 10.
Scaleway
Recently, we hear that Scaleway has de-prioritized a number of customer engagements and decided to voluntarily break ties with NVIDIA, in favour of AMD, for seemingly no good reason. We think this is a shame.
CUDO
CUDO did not make a representative managed Slurm or Kubernetes environment available for this cycle as it focuses on other business priorities (namely, managing the build out of a bunch of bare metal datacenters). We look forward to reassessing CUDO when an environment becomes available.
Denvr Dataworks
Despite changes in leadership and random bouts of activity in the community, we have yet to make any progress testing Denvr and have not seen any meaningful growth in the business that would allow them to dig themselves out of the hole their founders put them in.
Atlas Cloud
We haven’t been able to get GPUs from Atlas recently, despite big announcements about bare metal datacenters from their crypto parent company and random appearances on endpoint provider lists with their managed inference offering.
SpaceXAI
We love Colossus and can’t wait to test the SpaceXAI neocloud offering!
Mistral
Mistral just raised a €3B Series D, and has yet to confirm the validity of a hacker from TeamPCP claiming to put its entire codebase up for sale on the dark web. Anyway, we are very excited to test their neocloud offering. The team told us the platform was still coming up and onboarding its first customers in August, so we very much look forward to testing with them in the future. It seems obvious to us that companies with experience building training clusters for their own models (see above) will be successful neoclouds if they choose to pivot.
Poolside Infrastructure Company
Following a $6B licensiquihire by Nvidia that took an incredible group and buried them in the Nemotron bureaucracy, Poolside’s legacy lives on through the Poolside Infrastructure Company, which is developing their Project Horizon campus in West Texas. We have not yet tested anything from them, but their experience and ambition makes them an immediate contender if the skeleton crew decides to go for it on the neocloud business.
Nscale
Nscale announced a $2B Series C in March, announced the acquisition of AnyScale in May, and just filed an S1 to go public on NYSE a few days ago. It is unbelievable to us that they can have such a big business, and continue to claim in public marketing materials that they offer managed clusters and inference endpoints, when this is clearly not true. Obviously, though, they’ll continue to be successful. They’ve got access to lots of land and power, some construction and datacenter operations experience, and people really want that bare metal at a nice price.
Highrise
Highrise, Hut 8’s AI Cloud business, is constantly in the news. We hope we can test some managed clusters from them soon.
Corvex
Corvex continues to run scared from ClusterMAX, though they announced a $33M private placement in August to expand their datacenter capacity. Their choice of merger partner was Movano, maker of the Evie smart ring. Quite a change in product roadmap. Privately, they claim some secure government customers in the USG. We look forward to testing.
Andromeda
Andromeda takes capacity from other providers and puts a managed cluster service on top. We have discussed testing multiple times, and enjoyed working with the technical team, but find the business side to be a little shady. Resellers have a perverse incentive to keep the customer in the dark about who the underlying provider is, out of fear that the customer can just go around them and contract with them directly. Unfortunately, this can lead to bad games of broken telephone, and lots of finger pointing in the worst case. Specifically, we have a problem with non-circumvention clauses and hope that Andromeda can build a durable business model that allows them to be honest about their solid technical team and the value it can provide. We look forward to testing some of their Blackwell capacity soon, wherever it may be.
Volta
Volta launched with $300M in venture funding and a separate $5B financing pool for customers. Its first large announced contract uses Bitdeer’s Norway site. We have not tested the cloud software or customer operations.
Firebird
Firebird is building GPU infrastructure in Armenia, with $60M in construction financing announced by Ameriabank, and expansion plans in Kazakhstan. Recently, they became the subject of a story about Nvidia chip access and the Armenia-Azerbaijan peace process; co-founder Razmig Hovaghimian responded that the project had roots going back years before those diplomatic developments. GPU diplomacy. Pressure’s on to deliver for the people of Armenia! We still need to see the managed cloud in action.
Tatra
Tatra is developing B300 and GB300 capacity in Slovakia, using the country’s nuclear and hydro power base. We have some great feedback about the technical chops of the father/son team—hard working, impressive family. For now, though, we need them to get their first tranche fully deployed so we can put them to the test.
Sesterce
We spun up an on-demand H100 through Sesterce in August. The console showed an out-of-date Ubuntu option, provisioning took its time, and eventually we got a working machine. Then we found Shadeform underneath. A broker on top of a broker. We would quite like to know how many companies need a margin before the customer gets to run a workload! With that said, Sesterce is pursuing some big bare metal Blackwell clusters with big offtakers. We want to test those.
Groq
Groq set out to challenge Nvidia, but after a licensiquihire took Jonathan Ross and most of the engineering team, the remaining company has pivoted… to renting out Nvidia GPUs! Becoming a neocloud is the move if you want another $350M to live out your dreams (as announced in August). We look forward to testing more than just endpoints one day. Jensen gets the chip team and another customer. Not bad.
Yotta
Yotta handed us a four-node H100 Kubernetes cluster after an onboarding demo that mostly included a tour of the login screen. To file a ticket, we were directed from Shakti Cloud into One Yotta, then back through the Shakti domain. Unfortunately, all these portals do not help keep clusters online, with us hitting a real failure (Xid 94) within a day of starting our testing. Our testing is ongoing here, and performance is solid (though way after our deadline), but judging from customer feedback and our own experience, we’re getting pretty clear signals so far. We need to see Blackwell GPUs and some improved reliability for them to keep pace with others in the industry.
Darya
Darya is bringing GPU cloud infrastructure to Tajikistan, right on the border of Afghanistan, which certainly expands the map of places we need to test. Its H200 cluster launched in June 2025, and it subsequently signed an agreement with Yotta to develop a hydropower-fed AI datacenter in Darvoz. Interesting stuff, but after our experience navigating Yotta’s portals, we are particularly curious which parts of the operating model make the trip to Tajikistan. We have not yet had access to Darya’s cluster, though we would love to visit the site.
Boostrun
Boostrun has some solid bare metal, but bought its way past some of the Kubernetes engineering: vCluster says the company launched managed Kubernetes in under 45 days with no new platform engineering hires. They went with isolated tenant control planes, dedicated private nodes, and Netris for network provisioning. Sensible. We would rather see a small provider use working software than spend a year rediscovering Kubernetes. In customer discussions, we have still considered adding another operator for a fully managed training experience. We have tested a Boostrun cluster indirectly, through another provider reselling their capacity, but await the opportunity to engage with their support teams directly. We want to see how much of the day two operations Boostrun handles for themselves in a real engagement before moving them onto the list.
Global AI
Global AI takes the sovereign-cloud pitch quite literally: dedicated, single-tenant, air-gapped clusters sold by the data hall (or so they say). Customers decide when Global AI can access their systems, a solid offering for bare metal. However, when advertising an option for managed clusters, we need to see more. Just to assess bare metal we want to see things like how provisioning and security patches get handled, how comprehensive the monitoring stack is, how reliability and health checks work, and generally how competent the onsite team is at closing tickets quickly and correctly. We have not yet gotten to see this level of detail.
Argentum
Argentum’s website says “200,000+ GPUs available now.” Had you heard of Argentum before you got to this section of the article?
QumulusAI
QumulusAI found a different source of GPU debt: a $500M non-recourse facility through USD.AI, using GPU Warehouse Receipt Tokens as collateral for stablecoin borrowing, with financing for up to 70% of approved deployments. GPU Warehouse Receipt Tokens is the actual name. The announcement describes a facility, so we are not counting $500M of installed hardware. In our customer discussions, Qumulus has come up as a capacity supplier that may need another operator on top for managed training. We still need to inspect its own software and support, but initial customer feedback has been surprisingly solid.
Alibaba Cloud
Alibaba has considerably more software to show us than the usual neocloud startup. One example is its ACK Slurm operator: a SlurmCopilot component coordinates resource allocations between Slurm and Kubernetes so idle resources do not remain stranded in one scheduler. This is the kind of orchestration plumbing we like to poke at, and obviously this is a company that is not ready for a poking. We have an account, have been whitelisted for a few model endpoints, and have engaged directly with the sales team, but have yet to get access to any modern GPUs or this ACK software for testing.
Megaspeed
Plenty of hardware to investigate in their Malaysian and Indonesian sites, but no login yet.
BytePlus
BytePlus’s GPU service advertises switch-affinity placement on a multi-rail network, direct RDMA access to its vePFS parallel filesystem, and integration with our favourite model ever: Seedance 2.5. We have not yet completed an evaluation of their clusters, but there is clearly stuff to watch out for. Tik, tok.
Humain
Humain has given itself plenty to do. Alongside the Saudi GPU buildout, Tareq Amin announced a roughly 6 GW datacenter ambition, as well as Humain One, a real-time voice interface for any computer. We would be happy to start with a login and a functioning cluster, but we have yet to get a response from the team, leaving us wondering what secrets they’re hiding next to their Groq systems.
SK Telecom
SK Telecom runs over 1,000 B200s for Korea’s sovereign foundation-model initiative. As we covered in a recent article, the government also rented ~3,000 H100 equivalents from SK Telecom and Naver combined for the competition’s first round. SK Telecom has announced a much larger 2 GW NVIDIA DSX AI factory, expected to deploy Vera Rubin systems with SK Hynix HBM4, within SK Group’s planned 5 GW first-phase buildout. We have tested SK Telecom GPUs through Vessl, and they were solid, but nothing with SK directly. We need to see more from them on the international market to consider them a serious player, but the technical foundation is clearly there.
Naver
Naver, much like SK Telecom, is highly credible. It already operates hyperscaler-class datacenters, and its July plan with NVIDIA and Brookfield calls for expanding the GAK Sejong AI factory from an initial 55 MW buildout to 200 MW by 2028. We are interested in how much of that operational experience reaches external customers, vs the internal research teams at Naver. We have yet to test that experience.
Indosat (Zankore)
Zankore has announced the first phase of roughly 200 MW of GB300 NVL72 capacity is to be delivered in the first half of 2027. Even if they are a little behind schedule on deploying Blackwell, they are still well on their way to a long-term 1 GW ambition, primarily to serve offtakers (rumoured to be) from mainland China. And they’ve landed a $3.1B loan to go do it!